

Article Figures & Data
Figures
- Fig. 1.
FM1–43 staining and destaining ofDrosophila nerve terminals in variously treated preparations. Preparations that were freshly isolated (A), pretreated for 7 min with 20 μm forskolin (B), with severed axons incubated for 2 hr (C), and pretreated for 20 min with 10 μm cyclosporin A (D), were incubated for 5 min in high K+ saline containing 10 μm FM1–43, then washed with Ca2+-free saline for 15 min and viewed (top picture in each preparation). The stained preparations were then stimulated at 22°C for 5 min by high K+ saline (bottom picture in each preparation). For details, see Results. Scale bar, 10 μm.
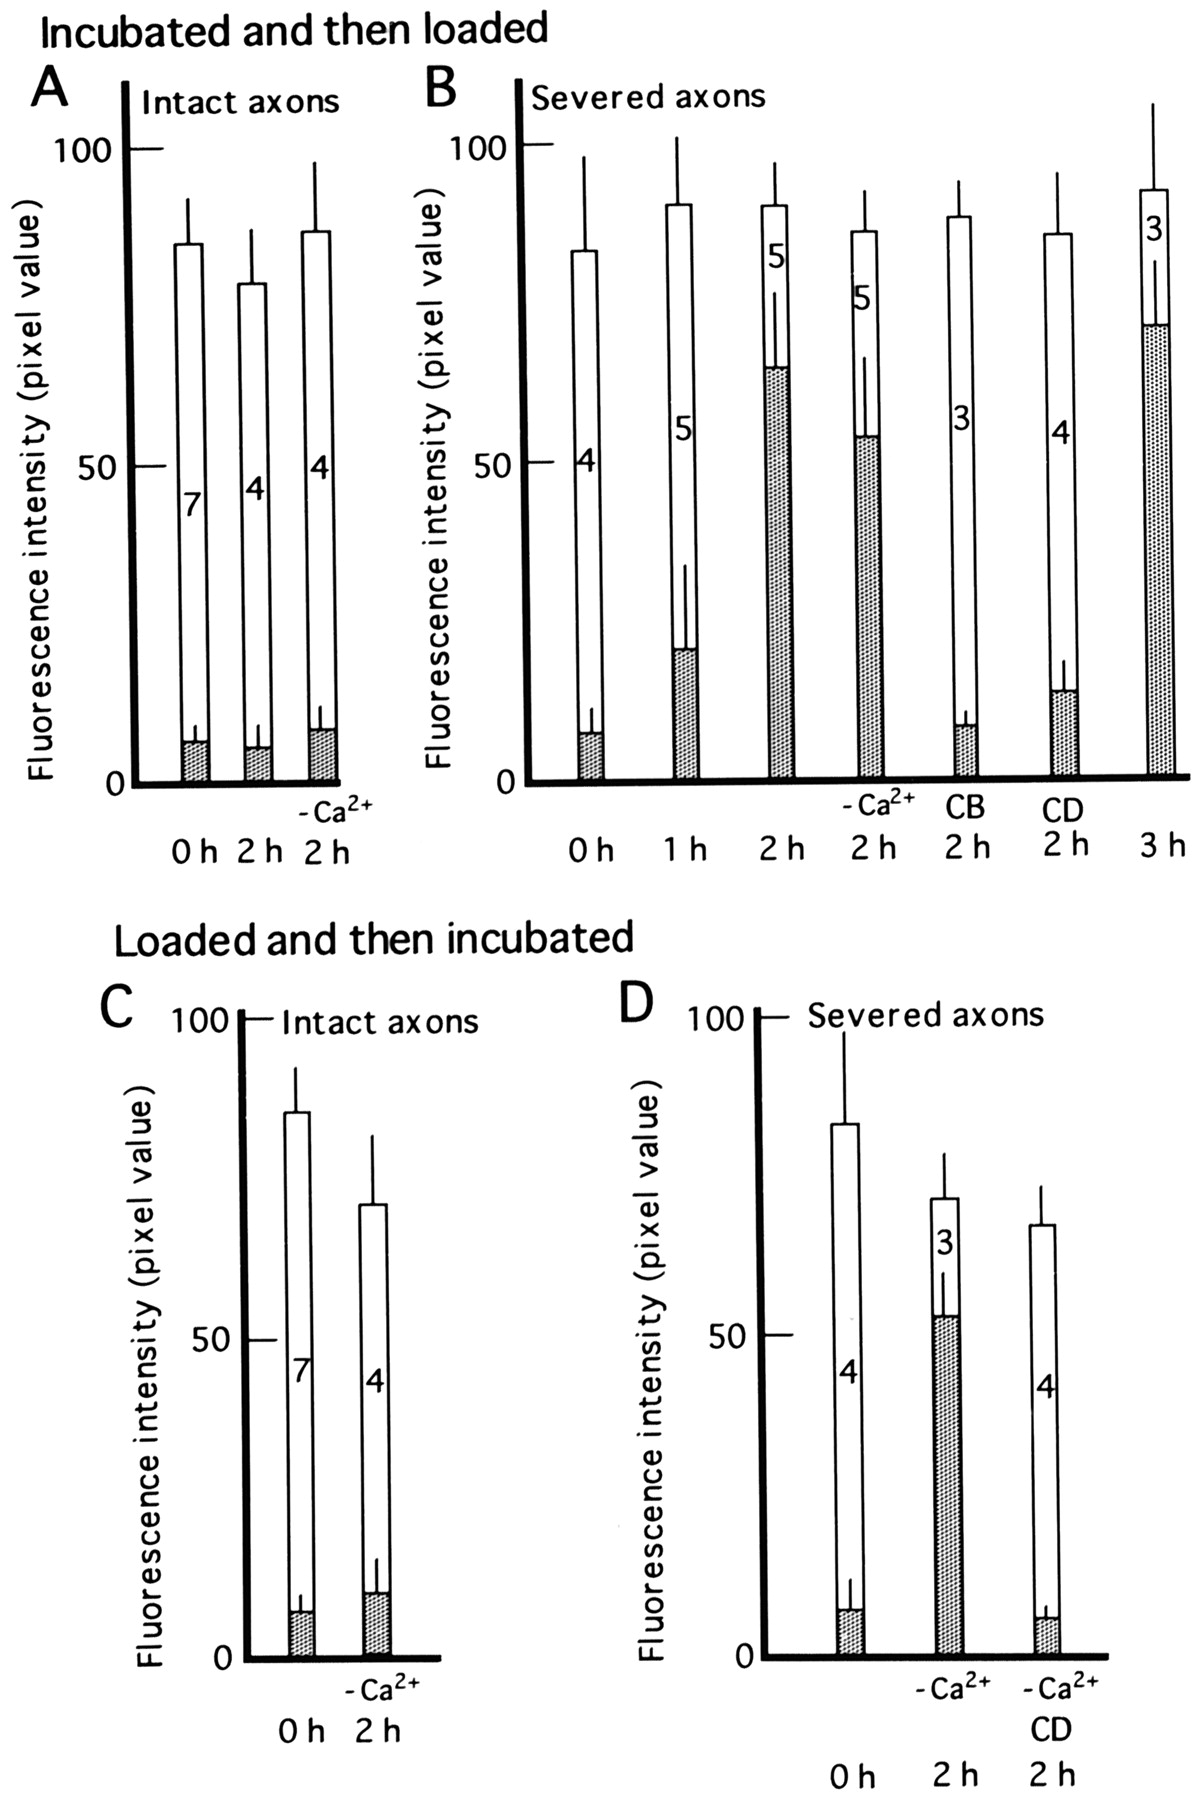
- Fig. 2.
FM1–43 fluorescence intensities in boutons of preparations that were incubated from various lengths of time in different media before (A, B) or after (C, D) loading with FM1–43. Preparations with intact axons (A, C) and with severed axons (B, D) were incubated in HL3 medium (not labeled) or in Ca2+-free saline (labeled with “−Ca2+”). Some preparations were pretreated for 20 min with cytochalasin B (10 μm, CB) or cytochalasin D (10 μm, CD), which were also present in the medium during incubation. The ordinates show FM1–43 fluorescence intensities (pixel values) in boutons before (the heights of columns) and after (top ends of dotted portion of columns) high K+ stimulation. For measurements of the intensities of fluorescence of boutons, 12-bit images were acquired with the CCD camera, and pixel values were compressed to 8 bits. Average intensities were computed for each bouton. Five to six boutons were examined in each preparation. Mean fluorescence values of boutons were determined in each preparation and summarized (mean and SEM). The numbers in columns are the number of preparations examined.Vertical bar of each column is SEM. The time below columns shows the incubation time.
- Fig. 3.
FM1–43 fluorescence intensities in boutons of wild-type and shibire(shits1) preparations with axons severed and incubated in the medium for 2 hr. The ordinates show FM1–43 fluorescence intensities (pixel values) in boutons before (heights of columns) and after (top ends ofdotted and filled portions) high K+ stimulation at 22°C (dotted) or 34°C (filled). Wild-type andshits1 preparations with severed axons were incubated in HL-3 medium for 2 hr and then loaded with FM1–43 (A), or first loaded with FM1–43 and then incubated in Ca2+-free saline for 2 hr (B). For details, see the legend to Figure2.
- Fig. 4.
Effects of drugs on FM1–43 fluorescence fractions in boutons of preparations with intact axons. The heights of columns are the fluorescence intensities of boutons before high K+ stimulation, and dotted portionsof columns represent fluorescence intensities remaining after high K+ stimulation. Preparations were treated with the drug shown: cyclosporin A (20 min), forskolin (7 min), or db-cAMP (15 min). Some preparations were first loaded with FM1–43 by high K+ stimulation, and these stained preparations were then treated with cyclosporin A (10 μm) for 20 min (loaded with FM1–43 and then treated with cyclosporin A). *p ± 0.05; **p ± 0.01, compared with corresponding fluorescence intensities in control preparations (Drosophila medium).
- Fig. 6.
EJPs and MEJPs in variously treated preparations (A–E) and Ca2+dependence of evoked release (F).A–E, Representative traces of synaptic potential in freshly isolated preparation (A), cyclosporin A-treated (10 μm for 20 min) preparation (B), forskolin-treated (20 μm for 7 min) preparation (C), preparation with axons severed and incubated for 2 hr in HL3 medium (D), and preparation with axons severed and incubated for 2 hr in the presence of cytochalasin D (E, 10 μm). Thetopmost record in each panel shows evoked junctional potentials, and the bottom four traces show spontaneous events recorded in the same muscle fibers. MEJP records were selected to show representative amplitudes. Calibration: 8 mV, 0.1 sec (for EJPs); 1 mV, 0.2 sec (for MEJP). F, Quantal content is plotted as a function of extracellular Ca2+concentration for forskolin-treated (20 μm, filled circles), nontreated (open circles), and cyclosporin A-treated (10 μm, filled triangles) preparations. The Ca2+concentration of the recording solution was adjusted to 0.1, 0.2, 0.4, and 0.8 mm with fixed 5 mmMgCl2.
- Fig. 7.
Relationship between the size of exo/endo cycling vesicle pool and the quantal content. The size of exo/endo cycling vesicle pool (abscissa) and the quantal content (ordinate) were determined in various preparations in the medium containing 2 mm Ca2+ as described in Results.Vertical and horizontal bars of eachcircle are SEM. FSK, Forskolin-treated preparations; Cyc.A., cyclosporin A-treated preparations; Fresh, freshly isolated nontreated preparations; Severed,Cyt.D. 2 h, preparations with axons severed and incubated for 2 hr in HL3 medium containing cytochalasin D; Intact, 2 h, preparations with intact axons incubated for 2 hr in HL3 medium;Severed, 2 h, preparations with axons severed and incubated for 2 hr in HL3 medium.


Tables
- Table 1.
Membrane potentials and quantal contents of synaptic potentials in variously treated preparations
Preparation N Rp (mV) MEJP (mV) EJP (mV) M Freshly isolated 9 51 ± 2.8 0.93 ± 0.06 33 ± 1.7 109 ± 9.3 FSK-treated 9 51 ± 2.6 0.93 ± 0.07 38 ± 1.8 191 ± 28* Cyc. A-treated 8 50 ± 2.6 0.96 ± 0.06 34 ± 1.7 130 ± 26 Intact, 2 hr 9 49 ± 0.6 0.89 ± 0.05 30 ± 1.6 90 ± 9.5 Severed, 2 hr 8 49 ± 1.0 1.07 ± 0.08 16 ± 1.5* 22 ± 2.6* Severed, 2 hr, Cyt. D. 7 49 ± 1.9 1.08 ± 0.10 33 ± 0.9 102 ± 14 Values represent the mean ± SEM. N, Number of preparations examined; Rp, resting membrane potential; MEJP, amplitude of spontaneous junctional potential; EJP, amplitude of nerve-evoked junctional potential; M, quantal content of synaptic potential, which was determined by dividing the mean EJP amplitude of each fiber by its mean MEJP amplitude and correcting for the nonlinearity of EJP amplitude; Freshly isolated, freshly isolated nontreated preparations; FSK-treated, preparations pretreated with 20 μm forskolin for 7 min; Cyc. A-treated, preparations pretreated with 10 μm cyclosporin A for 20 min; Intact, 2 hr, preparations with intact axons incubated for 2 hr; severed, 2 hr, preparations with axons severed and incubated for 2 hr; Severed, 2 hr, Cyt. D, preparations with axons severed and incubated for 2 hr in the medium containing 10 μm cytochalasin D.
* indicates a statistical difference from freshly isolated nontreated preparations at p < 0.01.


