

Article Figures & Data
Figures
- Fig. 1.
Structure of the GluR1 subunit.A, Linear schematic model showing the amino acid sequence (below) and numbering (above) for the C-terminal region of the GluR1 subunit. The four putative membrane-associated domains (M1–M4) (Hollmann and Heinemann, 1994) are indicated by boxes. The proposed transmembrane topology is indicated above (Dingledine et al., 1999). The regions suggested to show homology with the bacterial periplasmic amino acid-binding protein LAOBP (lysine-arginine-ornithine binding protein), which are referred to as S1- and S2-segments byStern-Bach et al. (1994), are indicated above the GluR1 subunit. Several previous studies have shown Ser831 to be a substrate for phosphorylation by PKC and Ca2+, calmodulin-dependent kinase II (CAMKII), and Ser845 to be a substrate for phosphorylation by PKA (see Results).
- Fig. 2.
The catalytic subunit Cα-PKA increases and calcineurin decreases neuronal AMPA receptor PO, PEAK. A, Photomicrograph of an acutely dissociated CA1 hippocampal neuron. B, Typical current–voltage relationship for AMPA receptor responses in acutely dissociated hippocampal neurons, corrected for a +9 mV junction potential. Inset shows responses recorded at different potentials. C, D, Superimposed macroscopic current responses to 10 mm glutamate (plus 20 μm MK-801) were recorded from an outside-out patch excised from acutely dissociated CA1 neurons held at −60 mV. The difference currents between the mean waveform and each individual current are shown below. The insets show the current–variance plot for these responses. Responses were recorded with either calcineurin plus calmodulin (C) or Cα-PKA plus ATP (D) included in the internal pipette solution; free Ca2+ was buffered to 100 nm for both patches. E, The composite current–variance relationship from the patch in C is shown for 57 macroscopic responses. F, The composite current–variance relationship from the patch in D is shown for 28 macroscopic responses recorded with Cα-PKA included in the pipette. The smooth curves in E, Fare Equation 1 fitted to the data; the chord conductance is shown assuming a reversal potential of 0 mV.
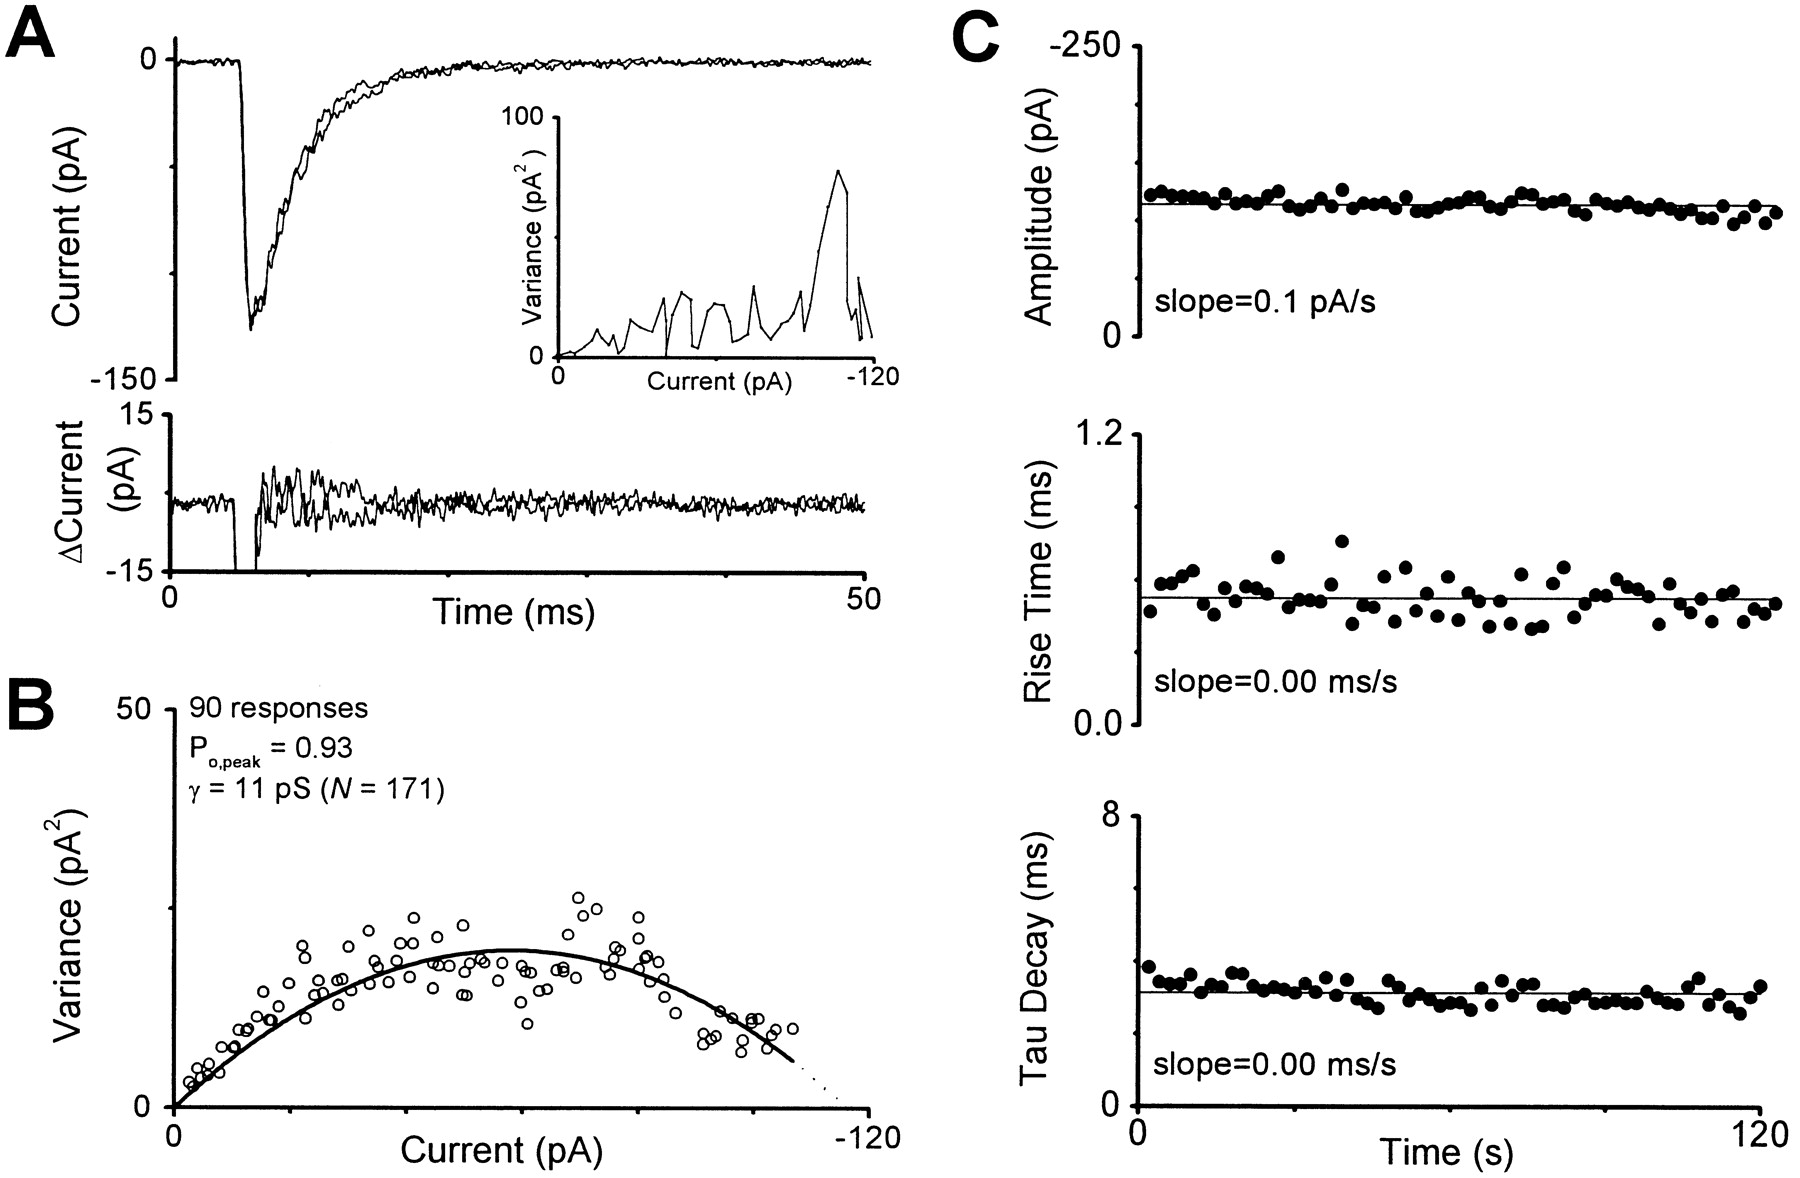
- Fig. 3.
Nonstationary variance analysis of GluR1 current responses obtained from an outside-out patch. A, Two GluR1 macroscopic current responses recorded from an excised membrane patch that was held at −60 mV and challenged with 10 mm glutamate for 160 msec are superimposed. The difference currents between the mean waveform and each individual current are shown below. The inset shows the current–variance plot for these two responses. These responses were recorded from wild-type GluR1 with Cα-PKA included in the pipette. B, The composite current–variance relationship is shown for 90 macroscopic responses; the smooth curve is Equation 1 fitted to the data. γ is the weighted mean chord conductance, and N is the number of channels. C, Analysis of 60 consecutive agonist-induced responses in the excised membrane patch fromA and B showed minimal run-down during the course of this experiment. Response characteristics such as peak amplitude (115 pA), 10–90% rise time (0.5 msec), and exponential decay time constant (3.1 msec) were stable during the experiment.
- Fig. 4.
Control of GluR1 Ser845 phosphorylation by cotransfection with cDNA encoding Cα-PKA and PKI. A,Top panel, Representative immunoblot showing reduction in GluR1 Ser845 phosphorylation with cotransfection of a cDNA encoding the peptide inhibitor PKI. The same immunoblot was probed with an antibody that recognizes phosphorylated Ser845, and stripped and reprobed using an antibody against GluR1. P/C is the ratio of S845-P signal intensity normalized to GluR1 C-terminal antibody signal intensity (total GluR1) for PKI or PKA treatment versus control and illustrates the reduction in basal phosphorylation by the PKI vector (p < 0.05). For comparison, a P/C ratio of 1.0 is shown for the control lane (R1).Bottom panel, Immunoblot showing that cotransfection with PKI also reduces Ser831 phosphorylation (p < 0.05). B, Top panel, Immunoblot showing enhancement of GluR1 Ser845 phosphorylation with cotransfection of cDNA encoding Cα-PKA. An antibody selective for phosporylated-Ser845 (S845-P) was used to probe the blot, and the same blot subsequently was stripped and reprobed with a GluR1-selective antibody (see Materials and Methods). The bar graph to the right shows the quantification of the Cα-PKA-induced enhancement of Ser845 phosphorylation as the ratio of immunodetected phosphorylated GluR1 to total GluR1; error bars are SEM (p < 0.05; paired t test). Control bars (R1) were set at 1.0 for comparison. The level of basal phosphorylation inA and B are similar and appear different because of the different exposure times for the ECF analysis.Bottom panel, Immunoblot and analysis showing the lack of effect on phosphorylation of GluR1 Ser831 by cotransfection with Cα-PKA.
- Fig. 5.
The catalytic subunit Cα-PKA increases and calcineurin decreases GluR1 PO, PEAK.A, Top panel, The meanPO, PEAK was determined using values fromi and N from fits of current–variance relationships for 30–300 responses to 10 mm glutamate recorded in excised patches with Cα-PKA (labeled PKA) or calcineurin (labeled PPase) added to the pipette solution (Table 1). PKI indicates cells transfected with a cDNA encoding a PKI-GFP fusion protein and recorded with a low Ca2+ internal solution without PKA or calcineurin added (Table 1). Symbols show values from individual membrane patches, and bars show meanPO, PEAK; error bars are SEM, and the number of patches is indicated in parentheses.PO, PEAK is calculated from the fitted values for N and i, and therefore estimates occasionally exceed 1.0. Normalized current–variance plots were averaged for all patches containing Cα-PKA (middle panel) or calcineurin (bottom panel). Continuous lines show fitted normalized variance from Equation 3. B,C, The mean PO, PEAK was determined using fitted values of i and Nfrom the current–variance relationship for responses to 10 mm glutamate recorded under the same conditions as above for (B) GluR1(S845A) or (C) GluR1(S831A) with Cα-PKA or calcineurin added to the patch pipette, respectively. For all panels, asterisks indicatep < 0.05 using Student's t test for GluR1(S845A) and ANOVA for GluR1(S831A) and wild-type GluR1 (A). When no significant difference was found, the power to detect a difference of 0.2 ranged between 0.8 and 0.9.
- Fig. 6.
Homomeric GluR1 subconductance levels activated by glutamate. A, C, Examples are shown for unitary currents recorded in response to 10 μm glutamate from outside-out patches containing recombinant homomeric GluR1 receptors with either Cα-PKA (A) or calcineurin plus its coactivators (C) included in the patch pipette. Single-channel currents were recorded at −100 mV, filtered at 1 kHz, digitized at 20 kHz. Broken lines show the mean fitted sublevel conductances assuming a reversal potential of 0 mV; cindicates the closed level. B, D, Composite amplitude histograms from all patches are shown with mean fitted sublevels indicated, as well as the closed point distribution (filled) scaled to the fitted peak of the lowest conductance level. In both situations, four Gaussian components were required to fit the histogram, with two components under 10 pA (shown as asterisks); this second subconductance level is more evident in PKA. The solid line is a fit to this composite curve. Fitted individual unitary current (in pA), SD (in pA), and relative proportions for Cα-PKA werei1 = −0.4,w1 = 0.75, SD1 = 0.17,i2 = −0.8,w2 = 0.18, SD2 = 0.2,i3 = −1.5,w3 = 0.06, SD3 = 0.26,i4 = −2.3,w4 = 0.01, SD4 = 0.26 and for calcineurin were i1 = −0.3,w1 = 0.63, SD1 = 0.14,i2 = −0.6,w2 = 0.12, SD2 = 0.13,i3 = −1.0,w3 = 0.17, SD3 = 0.43,i4 = −2.5,w4 = 0.08, SD4 = 0.79. The weighted means (see Table 4 legend) of the two low conductance states are indicated, and the individual components are shown with anasterisk. Nine (PKA) and 57 (Calcineurin) individual transitions with an amplitude between −3 and −5 pA were omitted from the fitting process.
- Fig. 7.
Homomeric GluR1 open period and burst duration histograms. A, The composite open period histograms from all patches with Cα-PKA or calcineurin plus its coactivators included in the pipette solution were fitted by the sum of two exponential components. Open periods are shown between 0.12 and 10 msec; 13 and 32 open periods greater than 10 msec in duration were omitted for PKA and calcineurin, respectively. B, The composite burst length histograms from all patches with Cα-PKA or calcineurin plus its coactivators included in the pipette solution were fitted by the sum of two exponential components. Bursts durations were determined using aTCRIT of 1.0 msec and are shown between 0.12 and 20 msec; 19 and 28 burst durations greater than 20 msec were omitted for PKA and calcineurin, respectively.
- Fig. 8.
Changing subconductance level proportions and PO, PEAK. A, Equation 1 was used to generate theoretical current–variance curves (−100 mV) with properties of our responses with PKA or calcineurin in the patch pipette. The unitary current and PO, PEAK values are indicated and reflect the pooled mean of data from wild-type GluR1 and GluR1(S831A) receptors. B, Equation 6 was used to calculate a theoretical current–variance relationship and compare it with the relationships shown inA. Different combinations (2 × 10⁹) of the 5, 13, and 24 pS conductance levels (varied between 0 and 1 in steps of 0.001 or 0.0005) were compared with the current–variance curves for GluR1 responses recorded with Cα-PKA or calcineurin included in the patch pipette. The two lines show the set of solutions for PKA and calcineurin. Any combinations of sublevel open probabilities along these lines can produce a current–variance curve indistinguishable from that produced by Equation 1 when fitted to our idealized data in A.PO, PEAK was calculated as the sum of the sublevel peak open probabilities and varied across the set of solutions for both calcineurin and PKA. However, the range of possiblePO, PEAK values that we obtain using the mean of the three main sublevels described in Figure 6 legend is distinct for PKA versus calcineurin.
- Fig. 9.
Fluctuations between agonist unbound states can reduce PO, PEAK.A, The kinetic scheme was adapted from Heckmann et al. (1996), Jonas et al. (1993), and Hausser and Roth (1997), with changes made to the channel closing rate α, channel opening rate β, rate constants for recovery from desensitizationkD-1 andkD-2 , and desensitization rate constant from the doubly liganded state kD+2. These changes resulted in a simulated response time course (10–90% rise time to step rise in agonist 110 μsec, tauDECAY 3.7 msec for 10 mmglutamate), mean channel open time (625 μsec), steady-state–peak current ratio (0.025), EC50 (0.4 mm), and tauRECOVERY from desensitization (180 msec) that are similar to those measured for homomeric GluR1(flip) receptors (Mosbacher et al., 1994; Partin et al., 1996; Wahl et al., 1998; this study). The simulated agonist EC50 is also similar to that determined for CA1 pyramidal cells (0.42 mm) (Jonas and Sakmann, 1992), and IC50 for predesensitization (10 μm) is similar to that determined for AMPA receptors in chick spinal neurons (10 μm) (Trussell and Fischbach, 1989) and CA1 hippocampal neurons (4–9 μm) (Colquhoun et al., 1992). Responses were simulated by solving a Q-matrix (SCALCS provided by D. Colquhoun) as well as by using Monte Carlo methods. Rate constants (in s−1) werek-1 = 1500,k+2 = 1,k-2 = 1 (Ser845-dephosphorylated receptor) or 25 (Ser845-phosphorylated receptor),kD+1 = 100, kD-1 = 7, kD+2= 4150, kD-2 = 7, α = 1600, β = 2 × 10⁴.kREV was adjusted to 72.2 sec−1 to ensure microscopic reversibility, and the forward agonist binding constantk+1 was 3.6 × 10⁶s−1m−1.B, Response time course is unchanged by partial occupancy of nonfunctional unbound state R2 despite large changes to PO, PEAK. The simulation was run with 96.2 or 50% of the channels starting in R1 fork-2 = 25 or 1 s−1, respectively; the remainder of the channels started in state R2. C, Fluctuations during the response interval in the occupancy of the unbound state R1 are shown (top panel) when the rate constants between the two unbound states (R1 and R2) favor occupancy of state R1 at rest (k+2 = 1,k-2 = 25 sec−1). Four responses at the times indicated by the arrows are superimposed to theright. Calibration: 2 msec, 30 pA. The variance of responses of 200 channels (12 pS conductance, −100 mV) was simulated by incorporating the fluctuations in the proportion of channels in state R1 at the start of agonist application. Fifty responses were simulated and analyzed as described in Materials and Methods for the model shown in A withk-2 = 25. D, Fluctuations during the response interval in the occupancy of the unbound state R1 are shown when the rate constants between the two unbound states (R1 and R2) are equal (k+2 =k-2 = 1 sec−1). Note the much larger fluctuations into and out of R1 for dephosphorylated receptor than for the phosphorylated receptor (C). Four responses at the times indicated by thearrows are superimposed to the right.Calibration: 2 msec, 20 pA. These traces illustrate the increased fluctuation of the peak current compared with C. The variance of responses of 200 channels (12 pS conductance, −100 mV) were simulated by incorporating the fluctuations in the proportion of channels in state R1 at the start of an agonist application as indicated in B. Fifty responses were simulated and analyzed as described in Materials and Methods for the model shown inA with k-2 = 1. This analysis confirms that fluctuations in the occupancy of R1before agonist application appear as a reduction inPO, PEAK, provided that fluctuations occur on a more rapid time scale (tauEQUILIBRIUM = 0.5 sec for k-2 = 1) than our stimulation protocol (inter-stimulus interval 2 sec) yet on a slower time scale than the duration of agonist application (0.2 sec).


Tables
Units PKA ATP PKA AMP-PNP PKI Calcineurin Gluconic acid mm 110 110 110 110 CsCl mm 30 30 30 30 NaCl mm 4 4 4 4 HEPES mm 5 5 5 5 BAPTA mm 5 5 5 EGTA mm 4.16 CaCl2 mm 0.5 0.5 0.5 2.1 Free Ca2+ nm <10 <10 <10 100 MgCl2 mm 2 2 2 2.27 ATP/AMP-PNP mm 4 4 GTP mm 0.3 PKI μm 4.5 4.5 Calmodulin μg/ml 10 Cα-PKA U/ml 125–300 125–300 Calcineurin U/ml 0.2 γCHORD (pS) 10–90% rise time (msec) tauDECAY1 (msec) tauDECAY2(msec) Open period (msec) Burst length (msec) SS/peak ratio N Native AMPA-R + PKA 12 ± 1 0.44 ± 0.02 5.23 ± 0.25 30.0 ± 1.8 0.02 ± 0.01 6 Native AMPA-R + calcineurin 11 ± 0.3 0.41 ± 0.01* 5.36 ± 0.39 33.0 ± 2.9 0.05 ± 0.01 9 GluR1 + PKA 14 ± 1 0.49 ± 0.06 2.72 ± 0.15 0.56 ± 0.08 0.72 0.02 ± 0.01 13, 7 GluR1 + calcineurin 13 ± 1 0.56 ± 0.02 2.63 ± 0.11 0.60 ± 0.06 0.80 0.02 ± 0.01 10, 6 GluR1 + PKI 14 ± 1 0.53 ± 0.02 2.75 ± 0.17 0.02 ± 0.01 11 Measurements (mean ± SEM) were made from excised membrane patches held under voltage clamp at −20 to −60 mV (neuronal responses), −60 mV (macroscopic recombinant GluR1 responses), or −100 mV (recombinant GluR1 single-channel recordings). Rise time and tauDECAY were the mean from the five patches with the fastest rise times. tauDECAY values were determined by fitting the average macroscopic responses with A(t) = A1 exp(−time/tauDECAY1) + A2 exp(−time/tauDECAY2) + Iss, where A(t) is the current amplitude and Iss is the steady-state current. The relative proportions of the fastest component for PKA and calcineurin were 0.66 ± 0.05 and 0.50 ± 0.02, respectively, for all patches (p < 0.05). Recombinant receptor responses were fit with A2 set to 0. Mean open periods as defined in Materials and Methods were determined from the fits of two exponential components to the open duration histograms from each patch; mean burst length was determined from the fit of two exponential components to the composite histogram from all patches (see Fig. 7). SS/peak ratio refers to the ratio of steady-state current to the peak current; statistical tests were not performed on this ratio (which was uniformly low) given the ambiguity in measuring the low amplitude steady-state current. PKI indicates cells cotransfected with a cDNA encoding the PKA inhibitor peptide. γCHORD is the weighted mean conductance determined from variance analysis. N is the number of patches for macroscopic and single-channel data. Statistical comparisons were made within the neuronal data set (unpaired t test) or within the recombinant receptor data set (ANOVA or unpaired t test);asterisk denotes significance at p < 0.05. Power to detect a 4.7 pS, 0.18 msec, 2 msec, or 0.2 msec difference in γ, rise time, tauDECAY, or mean open time at α = 0.05 ranged between 0.6 and 0.9.
Mutant GluR1 γCHORD (pS) 10–90% rise time (msec) tauDECAY (msec) SS/peak ratio N GluR1(S845A) + PKA 12 ± 1 0.42 ± 0.02 2.10 ± 0.19 0.04 11 GluR1(S845A) + calcineurin 12 ± 1 0.35 ± 0.02 2.01 ± 0.27 0.02 12 GluR1(S831A) + PKA 14 ± 1 0.47 ± 0.09 2.52 ± 0.10 0.02 24 GluR1(S831A) + calcineurin 14 ± 2 0.40 ± 0.01 2.37 ± 0.24 0.04 11 GluR1(S831A) + PKI 12 ± 1 0.35 ± 0.02 2.07 ± 0.09 0.03 11 Measurements (mean ± SEM) were made from excised membrane patches held under voltage clamp at −60 mV and obtained from cells transfected with GluR1(S845A) or GluR1(S831A) cDNA. Rise time and tauDECAY were calculated from the five patches with the fastest rise times; tauDECAY was determined as described in Table 2. N is the number of patches. SS/peak ratio refers to the ratio of steady-state current to the peak current (see Table 2legend); statistical tests were not performed on this ratio given the ambiguity in measuring the low amplitude steady-state current. Measurements made for each mutant were not significantly different (p > 0.05) by ANOVA. Power to detect a 4.7 pS, 0.25 msec, or 2.5 msec difference in γ, rise time, tauDECAY at α = 0.05 ranged between 0.8 and 0.9.
Wild-type GluR1 γ1 γ2 γ3 γNOISE (pS) (%) (pS) (%) (pS) (%) (pS) N +PKA 5 86 14 12 20 2 8.3 7 +Calcineurin 4 66 11 27 25 7 11.8 6 Chord subconductance values (γ) were determined from the amplitude histogram constructed from time course-fitted unitary current amplitudes assuming a reversal potential of 0 mV. Fits of three Gaussian components were made to the amplitude histogram from each patch using maximum likelihood. Single-channel currents were recorded as described in Materials and Methods. γNOISE is the mean weighted chord conductance calculated from these sublevels (Cull-Candy et al., 1988) according to:
 where is wJ is the proportion of k sublevels, each with conductance γJ.N is the number of patches. The standard deviation of the Gaussian component describing γ3 is broad, perhaps because of the presence of rarely accessed large conductance states. In addition, γ1 may reflect the average of two smaller sublevels that were difficult to distinguish in all but our lowest noise patches.


