

Article Figures & Data
Figures
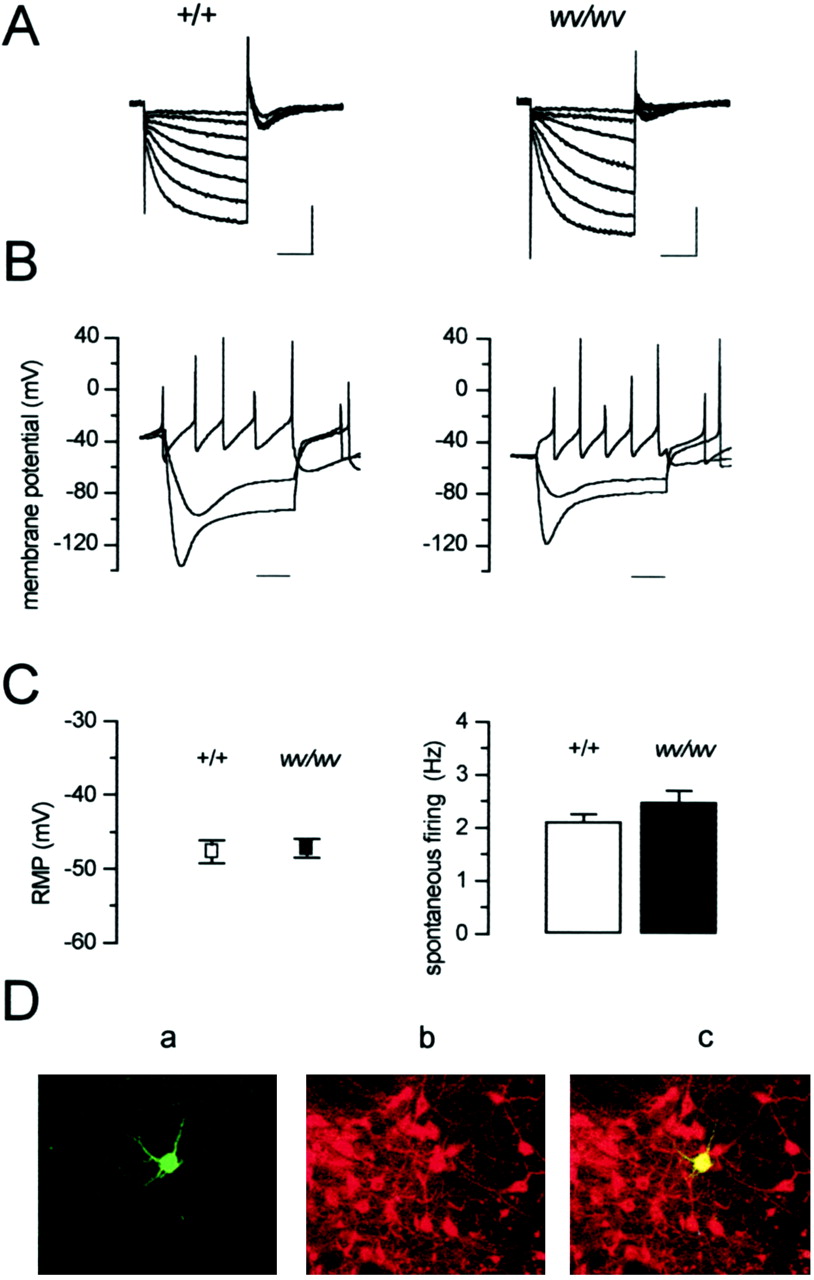
- Fig. 1.
Electrophysiological and immunohistochemical identification of midbrain dopaminergic neurons in +/+ andwv/wv mice. A, Hyperpolarizing voltage steps from −60 to −120 mV (10 mV increments,Vh of −40 mV) activated the mixed cation current (Ih) in both genotypes. Calibration: 250 msec, 500 pA. B, The corresponding current-clamp recording showed that hyperpolarizing pulses (−0.5 and −1 nA) activated the Ih current, thus producing a typical sag potential in both cells taken form the two genotypes. A depolarizing current pulse (0.5 nA) elicited a pacemaker-like sequence of action potentials in both neurons. Action potential amplitudes are clipped because of low sampling rate of the digital interface. Time bar: 100 msec. C,Left, The white square indicates the mean resting membrane potential (RMP) of +/+ dopaminergic cells (−47.6 ± 1.5 mV, n = 17), and theblack square indicates the mean resting membrane potential of wv/wv cells (−47.1 ± 1.3 mV,n = 18); values were not significantly different (p = 0.81). Right, Thecolumns indicate the mean spontaneous firing recorded in cell-attached configuration in +/+ (white) (2.1 ± 0.12 Hz, n = 7) and wv/wv(black) (2.4 ± 0.2 Hz, n = 15) neurons; values were not significantly different (p = 0.35). D, Confocal laser scanning microscope image of a wv/wv neuron loaded with biocytin (5 mm) through the patch pipette showing typical features of a dopaminergic neuron (magnification, 20×):a, biocytin staining as revealed by FITC fluorescence;b, TH immunostaining as revealed by TRITC fluorescence (note that many neurons, including the recorded one, resulted in being TH-positive, within the SNc); c, merged image of the two fluorescent stainings.
- Fig. 2.
DA mediates inhibition of +/+ and excitation ofwv/wv neurons. A, Cell-attached recordings from a +/+ (left) and wv/wv(right) cell showing the changes of spontaneous firing during the extracellular application of DA (30 μm). DA clearly inhibited the firing of the +/+ neuron, whereas it increased the activity of the wv/wv neuron. B, Whole-cell current-clamp recordings of two dopaminergic cells in which DA caused membrane hyperpolarization–inhibition (+/+) and depolarization–excitation (wv/wv). C, Voltage-clamp recordings (at Vh of −40 mV) showing the activation of outward (+/+) and inward (wv/wv) currents caused by DA (100 μm) in +/+ and wv/wv dopaminergic cells, respectively.
- Fig. 3.
The GABAB agonist baclofen mediates inhibition of +/+ and excitation of wv/wv neurons.A, Cell-attached recordings from a +/+ (left) and a wv/wv (right) neuron showing the modification of the spontaneous firing caused by the GABAB receptor agonist baclofen (10 μm). Note the increase in firing frequency induced by this compound in thewv/wv neuron. B, Whole-cell current-clamp recordings showing the modification in membrane potential and firing activity in +/+ and wv/wv neurons. C, Corresponding voltage-clamp recordings (atVh of −40 mV) showing the changes in membrane current caused by baclofen in a +/+ versus awv/wv neuron. Note that, like dopamine, baclofen activated an inward rather than outward current in wv/wvneurons.
- Fig. 4.
Properties of the DA- and baclofen-induced currents in wv/wv neurons. A, Voltage ramps (from −120 to 0 mV) delivered in control condition and in the presence of DA revealed that the DA-induced (100 μm) current reversed at −86 ± 6 mV (n = 4) in +/+ neurons (one cell is shown in the left), whereas it reversed at −27 ± 3.2 mV (n = 6) inwv/wv neurons (one cell is shown in theright). B, The baclofen-activated (10 μm) current reversed at negative potentials (−87 ± 3 mV, n = 4) in +/+ neurons (one cell is shown in the left), whereas it reversed at −34.1 ± 3.2 mV (n = 6) in wv/wv neurons (one cell is shown in the right). The current traces of thewv/wv neurons were recorded in the presence of TTX (0.5 μm), tetraethylammonium chloride (5 mm), and nifedipine (10 μm) to reduce voltage-dependent sodium, potassium, and calcium conductances. C shows the protocol used to induce the slow depolarizing ramps.
- Fig. 5.
The cation channel blockers QX-314 and ZD 7288 inhibit the DA- and baclofen-induced inward currents inwv/wv neurons. A, B, The DA-induced (100 μm) current was strongly inhibited by QX-314 (100 μm) and ZD 7288 (50 μm).C, D, QX-314 (100 μm) and ZD 7288 (50 μm) also inhibited the current induced by baclofen (10 μm). Note that the protocol of the voltage ramps in this and the following figures is the same shown in Figure4C.
- Fig. 6.
D2 and GABAB receptor antagonists reduce the DA- and baclofen-induced inward currents.A, The inward current induced by both agonists inwv/wv dopaminergic neurons was inhibited by the presence of sulpiride (10 μm; B,top) and CGP 55845A (250 nm;B, bottom). C, The plots show the mean values of DA-induced (top, black columns) and baclofen-induced (bottom,white columns) inward currents at the points indicated by asterisks in A (−120 mV). The DA-induced inward current was 207 ± 33 pA (n= 7; left bar) and was significantly reduced by QX-314 (100 μm) to 111 ± 13 pA (paired ttest, p < 0.05; middle bar) and by sulpiride (10 μm) to 117 ± 17 pA (pairedt test, p < 0.05; right bar). The baclofen-induced inward current of 198 ± 28 pA (n = 6; left bar) was significantly reduced by QX-314 (100 μm) to 63 ± 15 (pairedt test, p < 0.01; middle bar) and by CGP 55845A (250 nm) to 21 ± 8 pA (paired t test, p < 0.01;right bar).
- Fig. 7.
D2 and GABABreceptors couple to wv GIRK2 in a G-protein-dependent manner. A, Recordings of the spontaneous firing of twowv/wv neurons in cell-attached configuration with a pipette solution containing the GTP analog GTP-γ-S (0.6 mm). Note that both DA (left) and baclofen (right) induced an increase of the spontaneous firing before the rupture of the membrane patches. B, Theblack columns show the amplitude of the DA-induced current (at −120 mV) (204 ± 30 pA, n= 10) in control conditions and during the dialysis with GTP-γ-S (38 ± 14 pA, n = 5) (p < 0.05, unpaired data). The white columns show the amplitude of the baclofen-induced current (at −120 mV) (205 ± 40 pA, n = 6) in control condition and during the intracellular dialysis with GTP-γ-S (57 ± 10, n = 5) (p < 0.05, unpaired data). C, GTP-γ-S induced a tonic inward current that was reversibly blocked by QX-314 and irreversibly inhibited by ZD 7288. Note that, under this condition, the response to DA application was not observed.
- Fig. 8.
GDP-β-S prevents the DA- and baclofen-induced inward currents. A, Cell-attached recordings of twowv/wv neurons with a pipette containing the GDP analog GDP-β-S (0.6 mm) showing the increase of the spontaneous firing caused by DA and baclofen. B,Left, black columns, In whole-cell configuration, the DA-induced current (at −120 mV) was 204 ± 30 pA (n = 10) and was significantly reduced by GDP-β-S to 39 ± 15 pA (n = 5,p < 0.01, unpaired data). Right,white columns, The baclofen-induced current (at −120 mV) was 205 ± 40 pA (n = 6) and was significantly reduced by GDP-β-S to 21 ± 19 pA (n = 5, p < 0.01, unpaired data).


