

Abstract
Lesion studies show that the hippocampus is critically involved in timing behavior, but so far there has been little analysis of how it might encode time. We recorded the activity of 266 CA1 neurons, 51 CA3 neurons, and 219 entorhinal neurons from rats performing on a differential reinforcement of low rates (DRL) 15 sec schedule in which reinforcement was contingent on responses that occurred at least 15 sec after the preceding response. The unit data were analyzed using two different methods. First, each unit was subjected to an ANOVA that examined the effects of the following: (1) the outcome of the previous response (reward or nonreward); (2) the outcome of the response on which the firing of the cell was synchronized; and (3) time. This showed that, for CA1, CA3, and entorhinal cortex, changes in unit activity were related to all aspects of the task, with the firing of >90% of units recorded in each region being related to at least one of the three factors. Second, intercorrelations between the firing profiles of individual units revealed several functional categories of hippocampal neurons but no clear categories of entorhinal neurons. Of the hippocampal categories, the most common profile was an initial increase in unit activity at the beginning of the DRL interval, followed by a gradual decrease throughout the interval. We suggest that this profile reflects temporal decay in circuits that may code details of the previous trial and that could be used to “time” the DRL interval.
Hippocampal complex-spike cells often fire preferentially in a circumscribed region of the testing apparatus, the so-called “place field” of the cell. Place fields are the foundation of the influential view that the hippocampus is selectively involved in spatial mapping (O'Keefe and Nadel, 1978). More recently, nonspatial fields of these cells have also been demonstrated. Hippocampal unit activity in both rats (Wible et al., 1986; Wiener et al., 1989; Young et al., 1994) and monkeys (Rolls et al., 1989; Ono et al., 1991) can reflect conjunctions of simultaneously presented spatial and nonspatial cues. It can also reflect the sequence of cues presented during successive discrimination in rats (Foster et al., 1986; Eichenbaum et al., 1987) and recognition testing in rats (Otto and Eichenbaum, 1992a) and monkeys (Riches et al., 1991). Motor activity can also influence hippocampal activity, with a number of investigators reporting changes in hippocampal unit activity associated with conditional or voluntary motor responses in humans (Halgren, 1991), monkeys (Cahusac and Miyashita, 1988;Wilson et al., 1990), rabbits (Berger et al., 1983), and rats (Sakurai, 1990).
Timing is one form of hippocampal-dependent nonspatial information processing that has received little attention from researchers studying single unit activity. This neglect is surprising because timing is a particularly good, if not the ultimate, example of nonspatial processing, and at least some timing tasks are sensitive to damage at virtually all levels of the hippocampal system. For example, lesions of the septum (Brookes et al., 1983), fimbria-fornix (Johnson et al., 1977; Ramirez et al., 1995), hippocampus proper (Sinden et al., 1986), and entorhinal cortex (but see Johnson et al., 1977; Port et al., 1990) can all impair performance on a differential reinforcement of low rates (DRL) schedule (in which reward is contingent on responses that are separated by some predetermined time interval).
In the present study, we recorded the activity of hippocampal CA1 and CA3 cells and medial entorhinal cells while rats performed on a DRL 15 sec schedule. We selected this task because of its clearly established sensitivity to hippocampal damage (see above) and its operational simplicity. We recorded from different levels of the hippocampal system to allow comparison of the firing patterns between the levels at specific points in the behavioral task and hence to allow assessment of the nature of the information transformations occurring between these levels. We anticipated uncovering a category (or categories) of neurons displaying interval-related activity that could reflect the involvement of the hippocampus in correctly solving the DRL problem. To this end, our analyses of the unit data in the present paper concentrated on revealing firing patterns that were common to groups of hippocampal and entorhinal cells and quantified but did not attempt to analyze the large number of cells with unique firing patterns.
MATERIALS AND METHODS
Subjects. Eleven male Sprague Dawley rats, weighing between 320 and 580 gm at the beginning of the experiment, served as subjects. The animals were individually housed, maintained on a 12 hr light/dark cycle, and given ad libitum access to water. Food access was restricted to that earned during the performance of the DRL task and to 60 min of ad libitum access per day at the end of each test session.
Electrodes, surgery, and histology. The microelectrode assemblies consisted of eight 25 μm Formvar-coated nichrome–iron wires of equal lengths bundled into a 28 gauge cannula (Eichenbaum et al., 1977) and attached to a vertically driveable connector (Kubie, 1984). The animals were administered atropine (10 mg/kg, i.p.) to reduce mucous secretions and then anesthetized with sodium pentobarbital (50 mg/kg, i.p.) supplemented with additional doses (10 mg/kg) when necessary. Using aseptic surgical procedures, the electrode assemblies were implanted stereotaxically, with the skull level between lambda and bregma, at the following coordinates: for CA1 and CA3, 3.2 mm posterior to and 1.8 mm lateral to bregma, and 1.5 mm below the pial surface; for entorhinal cortex, 8.0 mm posterior to and 4.5 mm lateral to bregma, and 4.0 mm below the pial surface. At the conclusion of testing, each subject was administered a lethal dose of sodium pentobarbital (100 mg/kg), a 15 μA anodal current was passed through three of the recording electrodes, and the subject was then perfused transcardially with normal saline followed by 10% buffered formalin. The brains were removed from the skulls and stored in 10% buffered formalin for 24 hr and then transferred to a 3% potassium ferrocyanide solution for another 24 hr. This second solution produced a Prussian blue reaction that aided the localization of the electrode tips. Finally, the brains were transferred to a 20% sucrose–formalin solution for an additional 24–48 hr, coronal sections were cut at 30 μm on a sliding microtome, and the sections were mounted and stained with thionin.
Unit recording and computerized data acquisition. The subjects were screened once per day for unit activity. If no activity was identified during screening, the electrode assembly was advanced ∼40 μm and allowed to settle for at least 24 hr before subsequent screening. Unit activity was passed first through a high-impedance field effects transistor head stage and then to an alternating current amplifier (model P511K; Grass Instruments, Quincy, MA) in which the signals were amplified 10,000× and bandpass filtered at 300–3000 Hz. Unit data were collected on-line with unit isolation being achieved using a software template-matching algorithm (Spike2) provided with a computerized data acquisition system (model 1401+; Cambridge Electronic Design, Cambridge, UK). With this system, up to eight units could be isolated from each channel of neural activity at any one time. Only units with signal-to-noise ratios of at least 3:1 were included in the analysis. In addition to the unit data, computer-generated digital pulses that coded the behavioral events were also recorded.
Behavioral apparatus and procedures. The behavioral apparatus consisted of a modified Campden Instruments (Loughborough, UK) operant chamber with a floor area of 23 × 24 cm and sides that were extended to 41 cm. The chamber was fitted with a grid floor and contained a food hopper and two retractable operant levers. One of these levers was extended into the chamber, and a 2.8 W house light was illuminated throughout each DRL session. All procedural events were controlled and behavioral responses were recorded by a BBC microcomputer using the SPIDER control language.
Training on the DRL task proceeded in a series of three phases. First, magazine training occurred during four 30 min sessions, each conducted on consecutive days. During each of these sessions, a random time 30 sec schedule was imposed in which a 45 mg food pellet was delivered into the food hopper at randomly selected intervals ranging between 0 and 60 sec. In the second phase, the subjects were moved to a continuous reinforcement (CRF) schedule in which reinforcement was contingent on lever pressing. On the first CRF session, the operant lever was smeared with wet mash to encourage approach and manipulation. A total of four daily 45 min CRF sessions were given.
In the final training phase, by which time all rats were lever pressing reliably on the CRF schedule, DRL training commenced. For the initial four daily sessions, a 5 sec DRL schedule was imposed in which rats were reinforced only for those lever press responses that occurred at least 5 sec after the previous response. On sessions 5 to 8, the DRL schedule was extended to 10 sec, and from session 9 onward, the schedule was further extended to 15 sec. The duration of all DRL sessions was 45 min.
In 5 of the 11 subjects, the above training took place after the electrodes were implanted, and recording took place throughout acquisition. In the remaining six rats, the electrodes were implanted after the animals had reached a stable level of performance on the DRL15 task.
At the beginning of recording for four of the six rats implanted after training, a 0.5 sec auditory signal (4600 Hz, 70 dB sound pressure level at the center of the chamber) was presented halfway into the DRL interval. This signal was also introduced to the DRL procedure for four of the five rats implanted before training, but only after performance on the task was stable.
Data analysis. During DRL performance, lever press responses were assigned to 1 of 10 3-sec bins according to their inter-response time (IRT). Thus, responses occurring between 0 and 3 sec after a response were assigned to bin 1, those occurring between 3 and 6 sec after a response were assigned to bin 2, and so forth. All responses occurring more than 27 sec after a response were assigned to bin 10. In addition, a percentage efficiency score was calculated for each session by dividing the number of rewarded lever press responses by the total number of responses. The efficiency scores were arc-sine transformed before analysis to better meet the assumption of homogeneity required by the ANOVA. All behavioral data were analyzed using ANOVA, with orthogonal polynomial contrasts being used to examine trends in the within-subjects factors.
An initial analysis consisting of a three-factor ANOVA was used to determine which units displayed DRL-related activity. The three factors analyzed were as follows: (1) outcome of the previous response (reward or nonreward); (2) outcome of the response on which the profile was synchronized; and (3) variation in activity across bins. The analysis pooled data across trials and was performed on log-transformed firing rates. The transformation was performed to modify the distribution of the firing rates (which have a Poisson distribution) to better meet the assumptions of the parametric ANOVA. In addition, paired ttests were used to examine the effect of the “halfway” signal stimulus on unit activity. The three-way analysis was performed on all cells, and the one-way analysis was performed on those cells that had been recorded with the signal present.
A subsequent analysis concentrated on revealing common firing properties of the hippocampal cells by creating “clusters” of cells based on intercorrelations. The log-transformed firing rates were first normalized and smoothed (using a three-point running average), and then a triangular matrix of intercorrelations of firing rate profiles was computed for hippocampal cells and for entorhinal cells. The clusters are created in two steps. First, cells with correlated firing patterns are extracted for each reward condition separately to form preliminary groups. The members of these groups can differ between reward conditions. Second, the preliminary groups are fractionated by creating groups of cells that are similarly correlated across all reward conditions.
The preliminary groups are formed by taking the first cell in the list of all cells composing each matrix as a “seed” for the search and identifying all the other cells in the list with which this target cell has a correlation of 0.7 or more (i.e., a correlation that accounts for at least 49% of the variance). Having reached the end of the original list, the grouped cells are removed from it. The comparison is repeated but now searches for cells in the original list that have a correlation of at least 0.7 with any of the cells thus far grouped. This process is continued until no more cells are added to the group. This termination criterion means that the specific cell chosen as a starting point is irrelevant to the group finally extracted. All members of the group are correlated at least 0.7 with at least one other member, and no cell is correlated as much as 0.7 with any cell remaining in the original list. The grouped cells are deleted from the original list, the first cell on the reduced list is selected as the seed, and the process begins again. This continues until the list length is reduced to zero.
These preliminary groups were fractionated further because we had created an intercorrelation matrix and extracted groups of cells in this manner for each of four different conditions. Those conditions are as follows: (1) rewarded responses that immediately followed a rewarded response (R-R); (2) rewarded responses that immediately followed a nonrewarded response (N-R); (3) nonrewarded responses that immediately followed a rewarded response R-N); and (4) nonrewarded responses that immediately followed a nonrewarded response (N-N). After the groups had been extracted for each of the conditions, we calculated a rectangular matrix of the correlations between the average firing across group members and the firing of all individual cells for the subject. Group membership for each of the four conditions for each cell was then recorded in a spreadsheet, and individual cells were classified based on this membership. Thus, cells that belong to the same group as each other in each of the four conditions were automatically classified as belonging to the same cluster. Thus, if the preliminary groups are labeled simply by their order of extraction, one of the final groups could be labeled, for example, (1,3,2,1), meaning that it included all cells that were members of groups 1, 3, 2, and 1 in the R-R, N-R, R-N, and N-N conditions, respectively. Thus, the members of a final group shared at least 50% variance with one or more group members across all reward conditions.
The variations in firing rate common to cells of a group were assessed by calculating the average across the group for each bin. With the very large number of bins and the complex variations in firing rate across bins and reward conditions, conventional ANOVA, contrast analysis, and mean by mean post hoc testing were deemed inappropriate. Definition of contrasts would require derivation of single df contrasts from the data themselves or the use of multiple, high-order polynomials. Conventional post hoc testing would involve the ranking and pairwise testing of very large numbers of means (given the 2 × 2 × 150 starting matrix of means) with resultant difficulty in extracting the meaning of differences found between pairs of means in relation to the original ANOVA factors. Variations in firing rate across conditions were therefore tested by extracting the deviation terms from the ANOVA of the data. (These are the same deviations that, when squared and summed, provided the sum of squares for the effect or interaction of interest.) The deviations (not their squared values) were then assessed using Tukey's honestly significant difference, a confidence interval based on the same assumptions as the Student–Newman–Keuls post hoc test (Zar, 1974). Theq statistic used in these tests is calculated using the same formulae as the conventional Student's t statistic (with a pooled error estimate derived from the residual of the ANOVA). The important difference between the statistics is that q is assessed for significance against, or a confidence interval is derived from, critical values that take into account the number of comparisons that can be made between all the means included in the interval being tested. The confidence interval is based on the maximum number of means that can be tested and so is more conservative than the significance test. All effects described in Results derived from the main effects of the two reward-related factors [(1) outcome of the previous response (reward or nonreward); (2) outcome of the response on which the profile was synchronized] or their interaction. A significant effect of one of these factors or the interaction was taken to occur whenever a deviation for a particular bin exceeded the confidence limit for the entire set of deviations for that factor or interaction. In all cases discussed in Results, such deviations were found to occur within runs of similar values (including similar sign) that either closely approached or breached the confidence limit. The true level of, for example, the 5% confidence interval in practice was therefore 0.25% or more extreme. The bulk of the changes in specific bins reported in Results breached the 0.1% confidence limit for an individual deviation and also occurred in clusters of similar deviations. In a large number of cases, substantial but individually nonsignificant deviations occurred in long runs of the same sign and approximate value. These runs were assessed statistically by taking a change in the sign of the deviation between adjacent pairs of deviations as the start of a run. The first deviation of a run defined the direction of deviation required for future members of the run with the probability of the second member being the same as the first being 0.5. The probability of 10 such additional sequential deviations being in the same direction as the first is p < 0.001. With 15 possible such runs in each set of deviations and three sets of deviations tested, this delivers an overall p = 0.0439, i.e., p< 0.05 for the runs confidence interval. The bulk of runs reported breached the runs 0.1% confidence limit of 18 consecutive similar signed deviations. All the individual deviations that breached theq confidence limit were located in the body of runs that breached the runs confidence limit, as would be expected with serial data and a conservative test.
RESULTS
Behavioral performance
Acquisition of DRL
Efficiency scores improved across the first eight three-session blocks of DRL15 in both rats implanted with electrodes before training and those implanted after training (blocks, linearF(1,216) = 12.26, p < 0.01). Although the performance of the unimplanted animals appeared generally superior to that of the implanted animals, this was not significant (group, F(1,9) = 3.44,p = 0.097), and the rate of acquisition in the two groups was similar (group × blocks, all F < 1).
Effect of the halfway signal
The effect of the halfway signal on DRL performance was examined separately for animals implanted before training and animals implanted after training.
In animals trained before electrode implantation (Fig.1A), there was a strong tendency for responses to be made at, or just before, the criterion time, giving a peak of responding at 12–15 sec (bins, quadraticF(1,36) = 22.47, p < 0.01). There was also a modest amount of burst responding (0–3 sec) and very long latency responding (>27 sec), the combination of which produced a biphasic function (bins, quarticF(1,36) = 106.05, p < 0.001). Criterion-related responding increased markedly between session block 1–5 and session block 5–10 and then decreased slightly between session block 5–10 and session block 11–15 (blocks × bins, linear × quadratic F(1,72) = 9.87, p < 0.05; quadratic × quadraticF(1,72) = 9.69, p < 0.05). Figure 1A suggests a slight improvement in efficiency produced by the signal. However, the performance of rats implanted after training and tested with the signal was not significantly different from that of rats implanted after training but tested without the signal (group, F < 1; all group interactions, F(1,4) < 2.7).

Mean number of responses pooled by IRTs into consecutive 3 sec bins and collapsed across blocks of five sessions.A shows the responses of rats implanted with the microelectrode after training for the 15 sessions after the implantation procedure for each of the signal and nonsignal groups.B shows the responses of rats for the five sessions before the introduction of the signal (Sessions −5 to −1) and the 10 sessions after the introduction of the auditory signal.
Figure 1B shows the means of the IRT data for the five sessions before the introduction of the signal and the 10 sessions immediately after the introduction of the signal for rats implanted before training. Although there appears to be increased burst responding after the introduction of the signal and the response peak appears to shift from the 12–15 sec bin to the 15–18 sec bin on sessions 5–10, there were no significant changes across sessions. The variation across bins itself was highly reliable (linearF(1,3) = 22.62, p < 0.02; quartic F(1,3) = 78.24,p < 0.01), showing that the failure to detect an effect of the signal was not attributable to excessive error variance.
Overall, then, there was highly significant variation in responding related to the DRL contingency but minimal control of this responding by the halfway stimulus.
General behavior
Behavior was not systematically analyzed. However, none of the rats was observed to adopt a stereotyped pattern of intertrial responding, and none of the patterns of firing extracted as groups in the present paper shows the kind of cyclic pattern that would be expected of such behavior. Because firing patterns were extracted synchronized to lever pressing, the behavior toward the end of the interval and behavior immediately after reward delivery will have been consistent.
Electrode localizations
Reconstructions of the electrode tracks are shown in Figure2. Hippocampal recordings were made from complex-spike cells (Ranck, 1973) in the dorsal region. The majority of these recordings were of CA1 cells (n = 266); however, a subset of the cells were CA3 cells (n = 51) that were recorded after the electrode bundle had descended through the CA1 layer (Fig. 2A). In one of the four rats implanted with microelectrodes aimed at the entorhinal cortex (Fig.2B), the units were all recorded from the ventral subiculum and are not considered further because of insufficient numbers (n = 8) for a meaningful analysis. Other entorhinal locations were in the medial entorhinal cortex, ventral to the lamina dessicans.

Reconstructions of the electrode tracts for each of the subjects. Each line represents the extent of an electrode penetration.
Electrophysiological data
Task-related activity
Of the 266 CA1, 51 CA3 cells, and 219 entorhinal cells recorded, 264 (99.2%), 48 (94.1%), and 212 (96.8%), respectively, showed significant response-related firing when tested by ANOVA. In contrast, only four CA1 (1.5%), two CA3 (3.9%), and five entorhinal cells (2.3%) showed any relation to the IRT stimulus. However, many cells that had highly significant response relations (i.e., temporal variance accounted for by response-related firing) were shown by our clustering technique not to share even as much as 50% of their variance with any other cell. The tendency to cluster was quite different for cells recorded from the entorhinal cortex compared with those from hippocampus. Although some clusters of entorhinal cells were detected, these had only two members each and the majority of entorhinal cells formed an effective cluster of one. The proportions of cells in the CA1/CA3 clusters should be treated as estimates representing the lower limits of the true proportions. This is because a number of the remaining, nominally unique cells could belong functionally to the identified clusters. Sufficient noise associated with their profiles (e.g., as a result of low firing rate) would have caused them to fall below our criterion of a 0.7 correlation with any other cell in the cluster. However, given the highly significant individual ANOVA results, the majority of nonclustered cells must be considered to have highly response-related firing patterns that are quite distinct from those of all other cells. This suggests that the number of categorically different firing patterns in the hippocampal formation during DRL is very high.
Because of the hundreds of quite distinct firing patterns of the unclustered cells, detailed analysis of their possible functional significance is not attempted here.
Clustering
The clustering procedure extracted a number of discrete families of cells. Because error variance would tend to cause separate clusters to be incorrectly merged by our procedure, this result strongly suggests that the hippocampal formation contains at least some groups of cells that show common firing profiles during DRL that differ significantly from group to group. For cells recorded from CA1 and CA3, 44 of the 317 cells (13.9%) fell into three major clusters (consisting of 20, 18, and 6 cells, respectively). The proportions of CA1 and CA3 cells in each of these three clusters were approximately equal (χ2(1) values < 1.6, p values > 0.2), preventing any functional differentiation of the CA1 and CA3 cells being determined from cluster membership. Thus, for the rest of this paper, CA1 and CA3 are considered together. As noted above, entorhinal cells produced no substantial clusters.
The present paper considers further only those cases in which clusters were obtained and will concentrate on the functional implications of the size of the clusters and the nature of their profiles.
Cluster profile characteristics
To determine the general profile of a cluster, we first overlaid all of the individual cell profiles for that cluster for each of the R-R, R-N, N-R, and N-N transitions separately. Initial inspection showed that in some clusters there were one or two CA1/CA3 cells that, although sharing the qualitative characteristics of the temporal profiles of the remainder of the cluster, nonetheless showed extreme discursions outside the envelope of the remaining cells. For clarity of graphical representation and interpretation, these cells were excluded from subsequent analysis. As can be seen from the overlaid firing profiles in Figures 3,4, and 6, the concordance within each set of profiles is high and is very much greater than between one cluster and another. For the purposes of subsequent analysis, therefore, individual cluster profiles are discussed in terms of the average across the member cells of the cluster (Figs. 3B,4B, 6B).

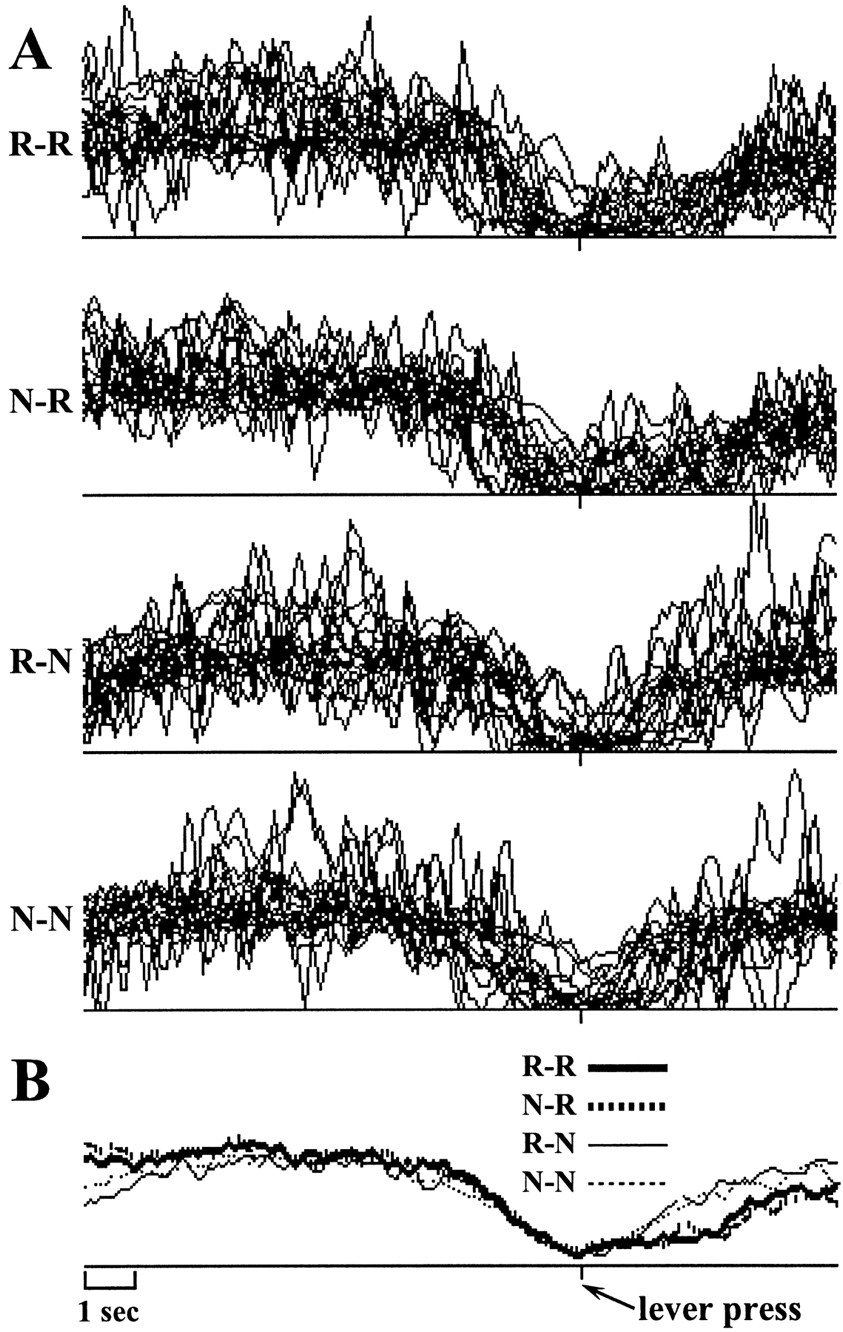
Normalized activity of the 20 CA1/CA3 neurons composing the timing cluster, synchronized on the lever press response and accumulated in 100 msec bins. For the present figure, as well as for Figures 4 and 6, A shows the overlaid firing profiles of the individual units composing the cluster for each of the four conditions produced by the two between-subjects factors (outcome of previous response and outcome of the response on which the profile was synchronized), and B shows the averaged firing rate profiles for each of the four conditions. In both A andB, 10 sec of activity before and 5 sec of activity after the lever press is shown.

Activity of the 18 units composing the behavioral inhibition cluster.
Response-related firing: CA1/CA3 clusters
The largest of the three clusters, consisting of 20 cells (0 excluded), is displayed in Figure 3. This cluster shows a steady decline in firing rate until the response is made and then shows a fairly quick postresponse rebound (all deviations in bins 94–107 breach the lower 0.1% confidence limit; this is followed by a run of upward deviations from bin 113–150, which breaches the upper 0.1% confidence limit). This rate of rebound is greater after nonreward (N-N, R-N) than after reward between bins 100 and 150 (R-R, N-R; 0.1% confidence) and is also somewhat greater if the preceding event was a nonreward (N-N, N-R) rather than a reward (R-R, R-N; 0.1% confidence). Between bins 123 and 137, the difference between N-N and R-N is somewhat smaller than the difference between N-R and R-R (5% confidence).
The rates 5 sec after the response compared with the rates 10 sec before the response are in general somewhat higher for reward and somewhat lower for nonreward, with the result that, at the beginning of the profiles, there is little apparent effect of previous reward condition (all deviations <30% of confidence limit). It should be remembered, here, that at 10 sec before response the profile will include, in the postreward case, many cases in which considerably >5 sec has elapsed since the last reward (i.e., IRTs greater than the 15 sec DRL requirement) and, hence, with a general downward trend in the profiles, will show a reduction below that expected 5 sec after reward, and, in the post-nonreward case, will include all cases between 0 and 5 sec after nonreward (i.e., IRTs less than the DRL requirement but greater than 10 sec) and, hence, with the general post-nonreward rebound, will show an increase above that expected at 5 sec after reward.
The activity of these cells follows the pattern that would be expected of subjective timing within the DRL interval. The highest rate occurs immediately after responding and firing decays steadily as time goes by, reaching its lowest value just before the response is emitted. The later postresponse rebound in the case of rewarded responses would be consistent with timing of the interval only starting once the reward had been consumed. The higher levels of activity occurring when the response was nonrewarded would be consistent with a process in which a fixed rate of decay (suggested by the preresponse profiles) delivered an IRT determined by the initial level of activity. Thus, the higher level of activity that followed nonrewarded responses would deliver a longer interval, consistent with an increase in the required IRT for future successful performance.
The second largest cluster (Fig. 4), consisting of 18 cells (three excluded), has a superficially similar pattern of responding, with a decrement somewhat before responding and a greater immediate increase after nonreward than after reward. However, firing rates plateau during the delay period rather than steadily decrementing, and both the decrease before responding (first breach of 0.1% confidence limit at bin 89 compared with bin 94 for cluster 1) and the increase after responding (last breach of 0.1% confidence limit at bin116 compared with bin 107 for cluster 1) are much more gradual than with the first cluster (compare with Fig. 3). Furthermore, the firing rate 10 sec before responding predicts the nature of that responding. Low, increasing rates of firing predict a premature response, whereas high, sustained rates predict a correct response (0.1% confidence).
The fairly consistent firing of these cells during most of the IRT could be produced by bursts of firing occurring at different points in the IRT and summating across IRTs to produce an apparently steady rate of activity. Alternatively, it could truly reflect a steady rate of firing during each IRT. To decide between these possibilities, we examined the raster plots of the cells included in this cluster. These raw firing records suggested that the second of the two explanations (that the cells fire steadily during most of the IRT) is the correct explanation. An example of a representative cell is shown in Figure5.

Representative example of a hippocampal behavioral inhibition neuron showing activity 10 sec before and 5 sec after a lever press. The figure includes a peri-response raster display of 30 consecutive responses and a peri-response histogram accumulated in 100 msec bins and averaged across 163 lever presses.
Unlike the first cluster, the output of these cells does not follow elapsed time within the DRL interval. The output follows, instead, the profile that would be expected for the strength of behavioral inhibition. The activity of the cells increases at a greater rate and to a higher value after nonreward than reward (0.1% confidence). Their rate is initially lower (0.1% confidence) and clearly less sustained (0.1% confidence) preceding a nonrewarded response. Finally, it is sustained throughout the period during which the animal is in fact inhibiting responding (0.1% confidence).
The third cluster of CA1/CA3 cells is relatively small, with only six cells in the final sample (0 excluded). As a result, the averaged waveforms are subject to more temporal “noise.” The predominant aspects of the profiles are, nonetheless, clear (Fig.6). Maximal firing occurs fractionally after responding (0.1% confidence breached by all bins between 93 and 104), at about the time reward would be expected, and firing increases steadily over the 3 sec preceding the response. In the two cases (R-R, N-R) in which reward is in fact delivered, responding rapidly falls back to baseline. In the two cases in which it does not (R-N, N-N), the return to baseline is much slower (0.1% confidence limit breached by all bins between 107 and 110), particularly in the R-N case (interaction run, bins 120–150, breaches 0.1% confidence limit).

Activity of the six units composing the response/reward cluster.
The activity in these cells follows the type of profile that would be expected of the motivational gradient associated with anticipated reward (Rescorla and Solomon, 1967). Previous nonreward is also known to increase response strength for the immediately following approach response (Amsel and Roussel, 1952), and this would explain the greater peak activity in the N-R and N-N conditions than in the R-R and R-N conditions, respectively. Increased activity in the R-N and N-N conditions persists for longer than activity in the R-R and N-R conditions. This persistence may relate to the response bursts that often follow nonrewarded trials. If this is the case, then it would tend to support the notion that the increase in the activity is related to the making of the response rather than to anticipation of reward.
Of interest is the fact that the firing of the cells also anticipates the nature of the response outcome. There is greater firing before reward than before nonreward. This would be consistent with the occurrence of premature responding as a result of impulsivity or the failure of inhibition. The anticipatory motivational gradient would be comparatively weak in these cases because of the relatively great temporal distance from the goal.
Response-related firing: entorhinal pairs
In the strict sense in which the above CA1/CA3 clusters were defined, no clusters were found in entorhinal cortex; rather, there were some concordant pairs of cells. These are presented here simply to provide some contrast to the profiles seen with the CA1/CA3 clusters. It should be noted that no entorhinal cells fell into any of the three CA1/CA3 clusters despite substantial response-related activity in virtually all entorhinal cells. Some care must be taken in interpreting the entorhinal data presented here because each average profile is based on only a pair of cells (compared with six in the smallest CA1/CA3 cluster). Nonetheless, there was high concordance between the members of a pair, and the averages are representative of each of the individual cases. Because the cells composing two of the three pairs revealed in this analysis were not recorded in the same session, there is no possibility that they are separate recordings of the same cell. Unlike the CA1/CA3 clusters just described, the entorhinal clusters themselves cannot be thought of as representative of large numbers of cells, and many equivalent pairs will not have been detected as such simply because a second cell of the same type was not picked up by our random sampling technique. Because there are only two cells in each group and these have been selected from a large pool of unique cells to be concordant with each other, statistical analysis is not appropriate, and our reporting of the patterns of cell firing must be taken as purely descriptive with no inferential power. With these caveats, the data are presented as examples of three cases in which there was high concordance in the profiles of cells. The averaged profiles are presented in Figure 7.

Averaged normalized activity of three pairs of entorhinal neurons that exhibited highly concordant firing profiles within each pair. A–C show activity accumulated in 100 sec bins for the 10 sec preceding and 5 sec after a lever press response
Figure 7A shows the average profile of two cells, the firing pattern of which was approximately similar to those shown in Figure 3and 4, except that there was no apparent modulation of postresponse activity by the presentation of reward or nonreward. Maximal depression of firing appears to occur slightly before responding when the previous trial had been nonrewarded and slightly after responding when the previous trial had been rewarded. However, this could well be the result of the underlying variability attributable to averaging only two cells (see, for example, the first 5 sec of the profiles).
These cells are clearly not signaling any of the following: (1) the passage of time within the DRL interval; (2) responding as such; (3) the receipt of reward; or (4) the receipt of nonreward. One possibility is that they are signaling the anticipation of delivery of reward. If so, this anticipation builds up over a period of ∼3 sec and appears to be a weak inversion of the profiles seen in Figure 6. This could result from CA1/CA3 driving the entorhinal cortex but not the other way around because the entorhinal response is later. However, the delay is >500 msec, suggesting that either they are unrelated or the CA1/CA3 signal has been relayed through a large number of synapses. (The latter would be consistent with the very weak entorhinal response.)
Figure 7B shows the average profile of two cells with a biphasic response to rewarded responses and a monophasic one to nonrewarded responses. In this case, the underlying variability of the cells is relatively small, and the averages are therefore a good representation of the profiles of the individual cells. It seems likely that these cells are inhibited by representations of the reward. The depression immediately after responding would reflect the anticipation (or “visualization”) of the reward and the second depression, in the case of reward only, reflecting the actuality of reward.
Figure 7C shows the results for the final pair of entorhinal cells. These show the most marked response-related variation of all of the clusters we have considered so far but, at the same time, are the hardest to assign likely correlates.
Approximately 2 sec after the delivery of reward, these cells show a marked increase in rate in the R-R and N-R conditions. This is within the time when the animals might be expected to have just completed eating the delivered food. However, it should be noted both that the rate is noticeably higher in the N-R case and that, at some time greater than 5 sec after a nonreward, the rate must increase to the same level as is seen shortly after a reward (because there is a high initial rate of firing in the N-N case).
The high initial rate in the N-N case cannot be a simple consequence of the delivery of nonreward because the rate in the N-R case is initially low and entirely consistent with the terminal rates of the R-N and N-N cases. Thus, nonreward depresses activity (or keeps it at baseline), and this low level is maintained if the animal is subsequently going to make a correct response but increases dramatically and fairly briefly in the middle of the inter-response interval if the animal is subsequently going to make a premature response.
The high level of initial activity in the R-N case can be explained by the generally high level at ∼5 sec after reward delivery (shown by both N-R and R-R) coupled with the fact that premature responding would cause sampling at an early point in time of this high level of activity. On the other hand, the pattern is highly consistent with the N-N case, and it may be that, rather than being a simple consequence of the previous reward, it effectively signals that a premature response will be made.
On balance, then, the differentially greater activity displayed in the R-N and N-N profiles before the lever press response seems most likely to be related to some behavior, such as grooming, that would be elicited both after reward and before making a premature response (when it would be a consequence of the same energizing effects of frustration as engender the premature response itself).
Stimulus-related firing: CA1/CA3 and entorhinal
When activity was synchronized on the exteroceptive IRT stimulus, three clusters of CA1/CA3 cells (n = 21,18, and 2) and two clusters of entorhinal cells (n = 22 and 3) were produced. However, as the example in Figure8 suggests, these clusters reflected variations in consistent delay activity per se and showed no sign of any signal-related activity.

Representative example of a signal-related cell cluster. A shows the overlaid firing profiles of the individual units (n = 21) composing the cluster collapsed across all trials in the recording session, andB shows the averaged firing rate profile. In bothA and B, 2 sec of activity before and after the lever press is shown. Activity was synchronized on the onset of the halfway signal, normalized, and accumulated in 100 msec bins.
DISCUSSION
Virtually all the hippocampal and entorhinal cells showed a significant relationship between firing and events. The high proportion of cells displaying activity related to the DRL task is consistent with findings from lesion experiments that have reliably shown that the hippocampus is critically involved in DRL performance (Clark and Isaacson, 1965; Sinden et al., 1986) and also lends support to the less well established finding that entorhinal cortex may be an important source of hippocampal input subserving this task (Ramirez et al., 1995) (cf. Johnson et al., 1977; Port et al., 1990).
The majority of cells, recorded in different sessions and different animals, had unique firing profiles, particularly in the entorhinal cortex in which the maximum cluster size was two. (This led us to prefer the term “pairs” above.) In contrast, a substantial proportion (14%) of hippocampal cells fell into three major clusters. The reduced clustering of entorhinal cells compared with hippocampal cells may reflect different levels of processing of DRL-related information, but >80% of hippocampal cells also formed clusters of one. The entorhinal cortex is a convergence point for cortical input to the hippocampus (Van Hoesen et al., 1972; Amaral and Witter, 1989), and to the extent this input includes information critical to the DRL task, then, as was the case, we should expect to observe a considerable proportion of neurons displaying task-related firing. It is possible that the diverse origins of this information are reflected in the predominance of unique task-related firing patterns. In contrast, the larger proportion of hippocampal neurons with similar firing patterns may reflect the fact that the information is several stages of processing on from that in entorhinal cortex and has been transformed in a manner that both contributes to successful performance of the DRL task and results in more uniform firing profiles. It could also reflect subcortical input to these cells from the septum relayed either through CA3 to CA1 (because there are no obvious differences between these areas) or from the septum directly to CA1 and CA3. In this case, the presence of the clusters could be attributed to a relatively less discrete coding of information by subcortical as opposed to cortical input, or to the carrying by the septal input of more modulatory and less stimulus- or response-specific information. Given the confluence of entorhinal and CA1 information in the subiculum, it would clearly be of interest to record there in the future.
The activity of the cells in the first of these clusters (Fig. 3) could represent neuronal coding of timing of the delay assuming the following: a threshold for response release; a fixed rate of decay of activity; setting of the desired IRT by the amount of initial activity; and an increase in the desired IRT after nonreward. Unfortunately, this account is not consistent with the influential information processing model of timing formulated by Gibbon and Church (1984). In this model, elapsed time is integrated in an accumulator and then fed to working memory, the output of which is compared with a value stored in reference memory and a response generated if the values are sufficiently similar. In contrast, the current data suggest that the activity at the beginning of the interval is set from reference memory.
An alternative and, in the case of the present data, more plausible account of the function of the cells in Figure 3 is that their decrementing activity reflects a decaying memory trace of the previous response, and as such, may be similar to the hippocampal “delay cells” described previously in both rats (Otto and Eichenbaum, 1992b;Hampson et al., 1993) and primates (Watanabe and Niki, 1985; Miyashita, 1988; Miyashita and Chang, 1988; Riches et al., 1991; Colombo and Gross, 1994). Although the nature of the information encoded by delay cells is not entirely clear, it appears that the delay activity may be some form of mnemonic representation that directs responding (Watanabe and Niki, 1985; Rolls, 1990; Hampson et al., 1993). In contrast to the delay activity observed in these earlier studies, the 10 sec of activity preceding a response was not differentially related to any particular aspect of the DRL task (e.g., rewarded vs nonrewarded responses) and therefore presumably does not encode such details. Rather, the “delay activity” observed in the present results may simply be a representation of some more general features of the response that, upon decrementing to a threshold level, results in the elicitation of a response.
A third possibility is that the profile in Figure 3 reflects the strength of inhibition required to suppress the prepotent lever press response, especially given the relatively sudden decrement just before responding. A key aspect of such a model is that it must assume that the level of inhibition steadily drops until a threshold is reached and a response is emitted. We are inclined to discount this model for two reasons. First, there are good reasons to suppose that response strength increases as a goal is approached (Hull, 1932), and one would therefore expect that behavioral inhibition should increase to match this. Second, the cells shown in Figure 4 appear to fit the requirements of behavioral inhibition better than those of Figure3.
The second major cluster (Fig. 4) followed a pattern consistent with the presence of behavioral inhibition or the occurrence of interval-related behaviors. The output of the cells was high and steady throughout most of the inter-response interval, minimal just before responding, and rebounded faster after nonreward than reward. Whatever process is reflected in cellular activity, then, must be one that either occurs throughout the interval independent of the specific behavior engaged in by the animal or is one that occurs relatively briefly but at times that are evenly distributed within the interval. Inspection of raster plots of cell firing (Fig. 5) suggested that the former is the case. Of interest is the fact that there is somewhat less firing in these cells before nonreward than before reward, a finding that is consistent with the notion that the firing of these cells reflects behavioral inhibition.
The third cluster (Fig. 6) has firing that is somewhat synchronized with the lever press response. However, the fact that the increase in activity begins several seconds before the response suggests that it could also be related to a motivational gradient elicited by situational cues that have been classically conditioned to the food delivery (Rescorla and Solomon, 1967). Unfortunately, the elevated level of neuronal activity that continued for 1–2 sec after unrewarded responses does not allow us to choose between these interpretations, because the continued activity could be either associated with response bursts that typically follow unrewarded responses or a persistence of the conditioned motivational state in continued anticipation of reward.
The present data contribute to the growing body of evidence that shows that the hippocampus is not selectively involved in spatial information processing (O'Keefe and Nadel, 1978). It is conceivable that specific response-related patterns of firing could have been generated from the classic place fields of hippocampal cells if the interval-related behavior of the animals was highly stereotyped. However, these patterns should consist of bursts of firing at specific points in the interval. Certainly, the cells shown in Figure 6 could be “lever approach” cells (with a directionally specific place field on top of the lever). However, the relationship of firing to reward condition is difficult to explain on this hypothesis, and the cells of Figure 3 and 4 do not conform to this type of pattern.
Similarly, there is little in the unit data to support the notion that the subjects used nonspatial collateral behaviors to time their responses (Slonaker and Hothersall, 1972). Stereotyped behavioral sequences presumably would have produced activity peaks in at least some firing profiles that occurred reliably at a fixed point of the IRT. Although some variation in the behavioral pattern could have produced a profile such as that shown in Figure 4, examination of unit activity before individual responses, as noted above, indicated that these cells tended to fire throughout the interval rather than in bursts.
Although we are not in a position to determine the precise functional correlates of firing in our cell clusters (with “timing of the delay,” “behavioral inhibition,” and “level of anticipatory goal responses” being purely descriptive labels), we can draw some higher level conclusions about the type of functions involved. They must be nonspatial in at least some cells. They must reflect higher level “cognitive” processes rather than simple representations of either stimuli or patterns of muscular response. Finally, they are directly related to the logical components of the DRL task itself. This is, of course, a necessity for any event-related pattern detected by our methods. However, it is not something that would necessarily be expected and, indeed, was not obtained in relation to the IRT stimulus. Moreover, the important point is that the vast majority of cells displayed event-related profiles.
Footnotes
This work was supported by Foundation for Research, Science, and Technology Grant U00413 (B.Y.) and Health Research Council Grant 95/016 (N.M.).
Correspondence should be addressed to Dr. Neil McNaughton, Department of Psychology, University of Otago, P.O. Box 56, Dunedin, New Zealand. E-mail: nmcn{at}psy.otago.ac.nz.
Dr. Young's present address: Technology Development Group, HortResearch, Ruakura Research Centre, East Street, Private Bag 3123, Hamilton, New Zealand.


