
Main menu

  • HOME
  • CONTENT
    • Early Release
    • Featured
    • Current Issue
    • Issue Archive
    • Collections
    • Podcast
  • ALERTS
  • FOR AUTHORS
    • Information for Authors
    • Fees
    • Journal Clubs
    • eLetters
    • Submit
  • EDITORIAL BOARD
  • ABOUT
    • Overview
    • Advertise
    • For the Media
    • Rights and Permissions
    • Privacy Policy
    • Feedback
  • SUBSCRIBE

User menu

  • Log in
  • My Cart

Search

  • Advanced search
Journal of Neuroscience
  • Log in
  • My Cart
Journal of Neuroscience

Advanced Search

Submit a Manuscript
  • HOME
  • CONTENT
    • Early Release
    • Featured
    • Current Issue
    • Issue Archive
    • Collections
    • Podcast
  • ALERTS
  • FOR AUTHORS
    • Information for Authors
    • Fees
    • Journal Clubs
    • eLetters
    • Submit
  • EDITORIAL BOARD
  • ABOUT
    • Overview
    • Advertise
    • For the Media
    • Rights and Permissions
    • Privacy Policy
    • Feedback
  • SUBSCRIBE
PreviousNext
ARTICLE, Behavioral/Systems

Long-Term Optical Imaging and Spectroscopy Reveal Mechanisms Underlying the Intrinsic Signal and Stability of Cortical Maps in V1 of Behaving Monkeys

Eran Shtoyerman, Amos Arieli, Hamutal Slovin, Ivo Vanzetta and Amiram Grinvald
Journal of Neuroscience 1 November 2000, 20 (21) 8111-8121; DOI: https://doi.org/10.1523/JNEUROSCI.20-21-08111.2000
Eran Shtoyerman
1Department of Neurobiology, The Weizmann Institute of Science, 76100 Rehovot, Israel
  • Find this author on Google Scholar
  • Find this author on PubMed
  • Search for this author on this site
Amos Arieli
1Department of Neurobiology, The Weizmann Institute of Science, 76100 Rehovot, Israel
  • Find this author on Google Scholar
  • Find this author on PubMed
  • Search for this author on this site
Hamutal Slovin
1Department of Neurobiology, The Weizmann Institute of Science, 76100 Rehovot, Israel
  • Find this author on Google Scholar
  • Find this author on PubMed
  • Search for this author on this site
Ivo Vanzetta
1Department of Neurobiology, The Weizmann Institute of Science, 76100 Rehovot, Israel
  • Find this author on Google Scholar
  • Find this author on PubMed
  • Search for this author on this site
Amiram Grinvald
1Department of Neurobiology, The Weizmann Institute of Science, 76100 Rehovot, Israel
  • Find this author on Google Scholar
  • Find this author on PubMed
  • Search for this author on this site
  • Article
  • Figures & Data
  • Info & Metrics
  • eLetters
  • PDF
Loading

Article Figures & Data

Figures

  • Fig. 1.
    • Download figure
    • Open in new tab
    • Download powerpoint
    Fig. 1.

    Cranial window and artificial dura mater.A, The exposed cortex as seen through the transparent silicon membrane. The lunate sulcus is in the top leftpart of the cranial window. V1 and V2 are thus available for optical imaging. This picture was taken 5 months after insertion of the artificial dura over the exposed cortex. B, Enlargement of the artificial silicon dura in the cranial window shown inA. The silicon ring in the center stabilizes the artificial dura and prevents the real dura from growing on the imaging area.

  • Fig. 2.
    • Download figure
    • Open in new tab
    • Download powerpoint
    Fig. 2.

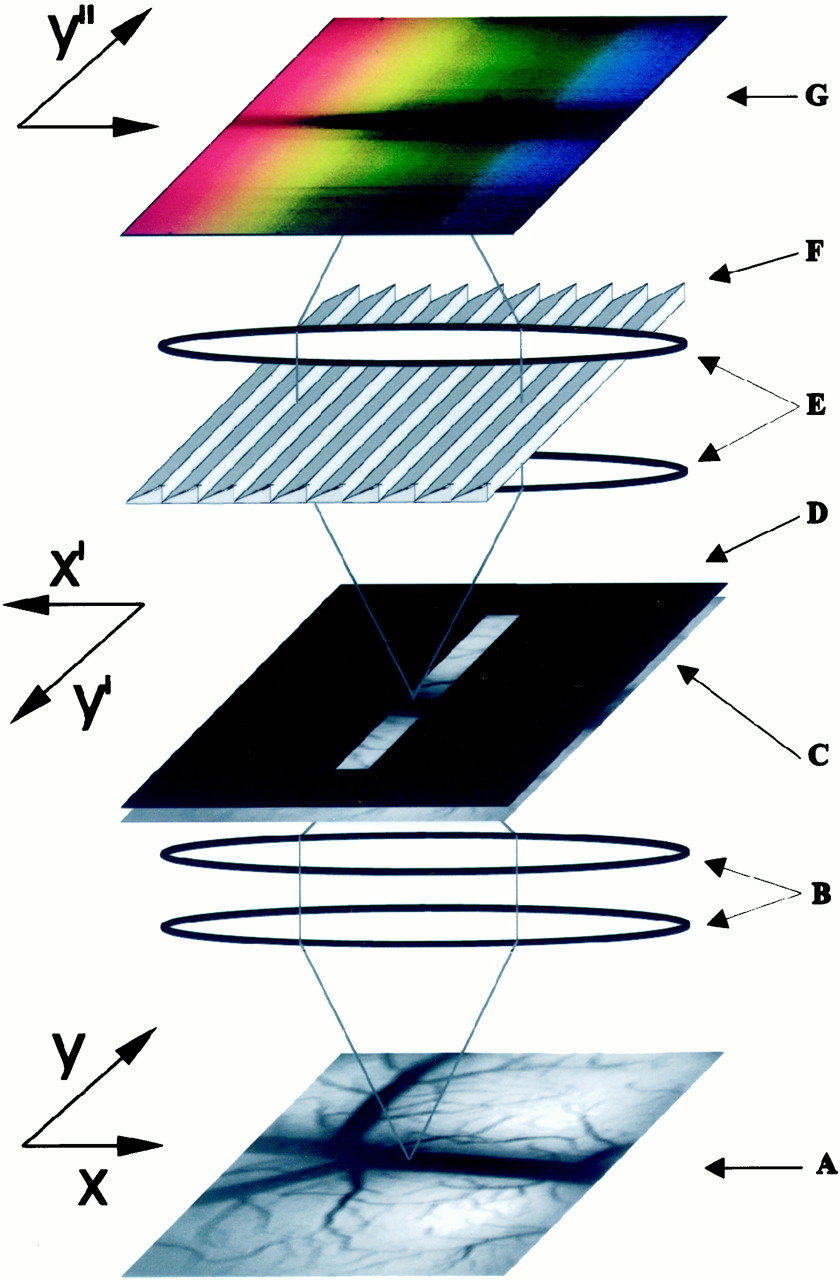
    Scheme of the imaging spectroscope (adapted fromMalonek et al., 1996). The bottom tandem-lens macroscope (B) creates an image of the exposed cortex (A) at the first image plane (C) in which an opaque disk with a transparent slit is positioned (D). The image of the slit is collimated by the objective of the second tandem-lens macroscope (E), diffracted along the axis perpendicular to the slit by the diffraction grating (F), and focused on the camera (G).

  • Fig. 3.
    • Download figure
    • Open in new tab
    • Download powerpoint
    Fig. 3.

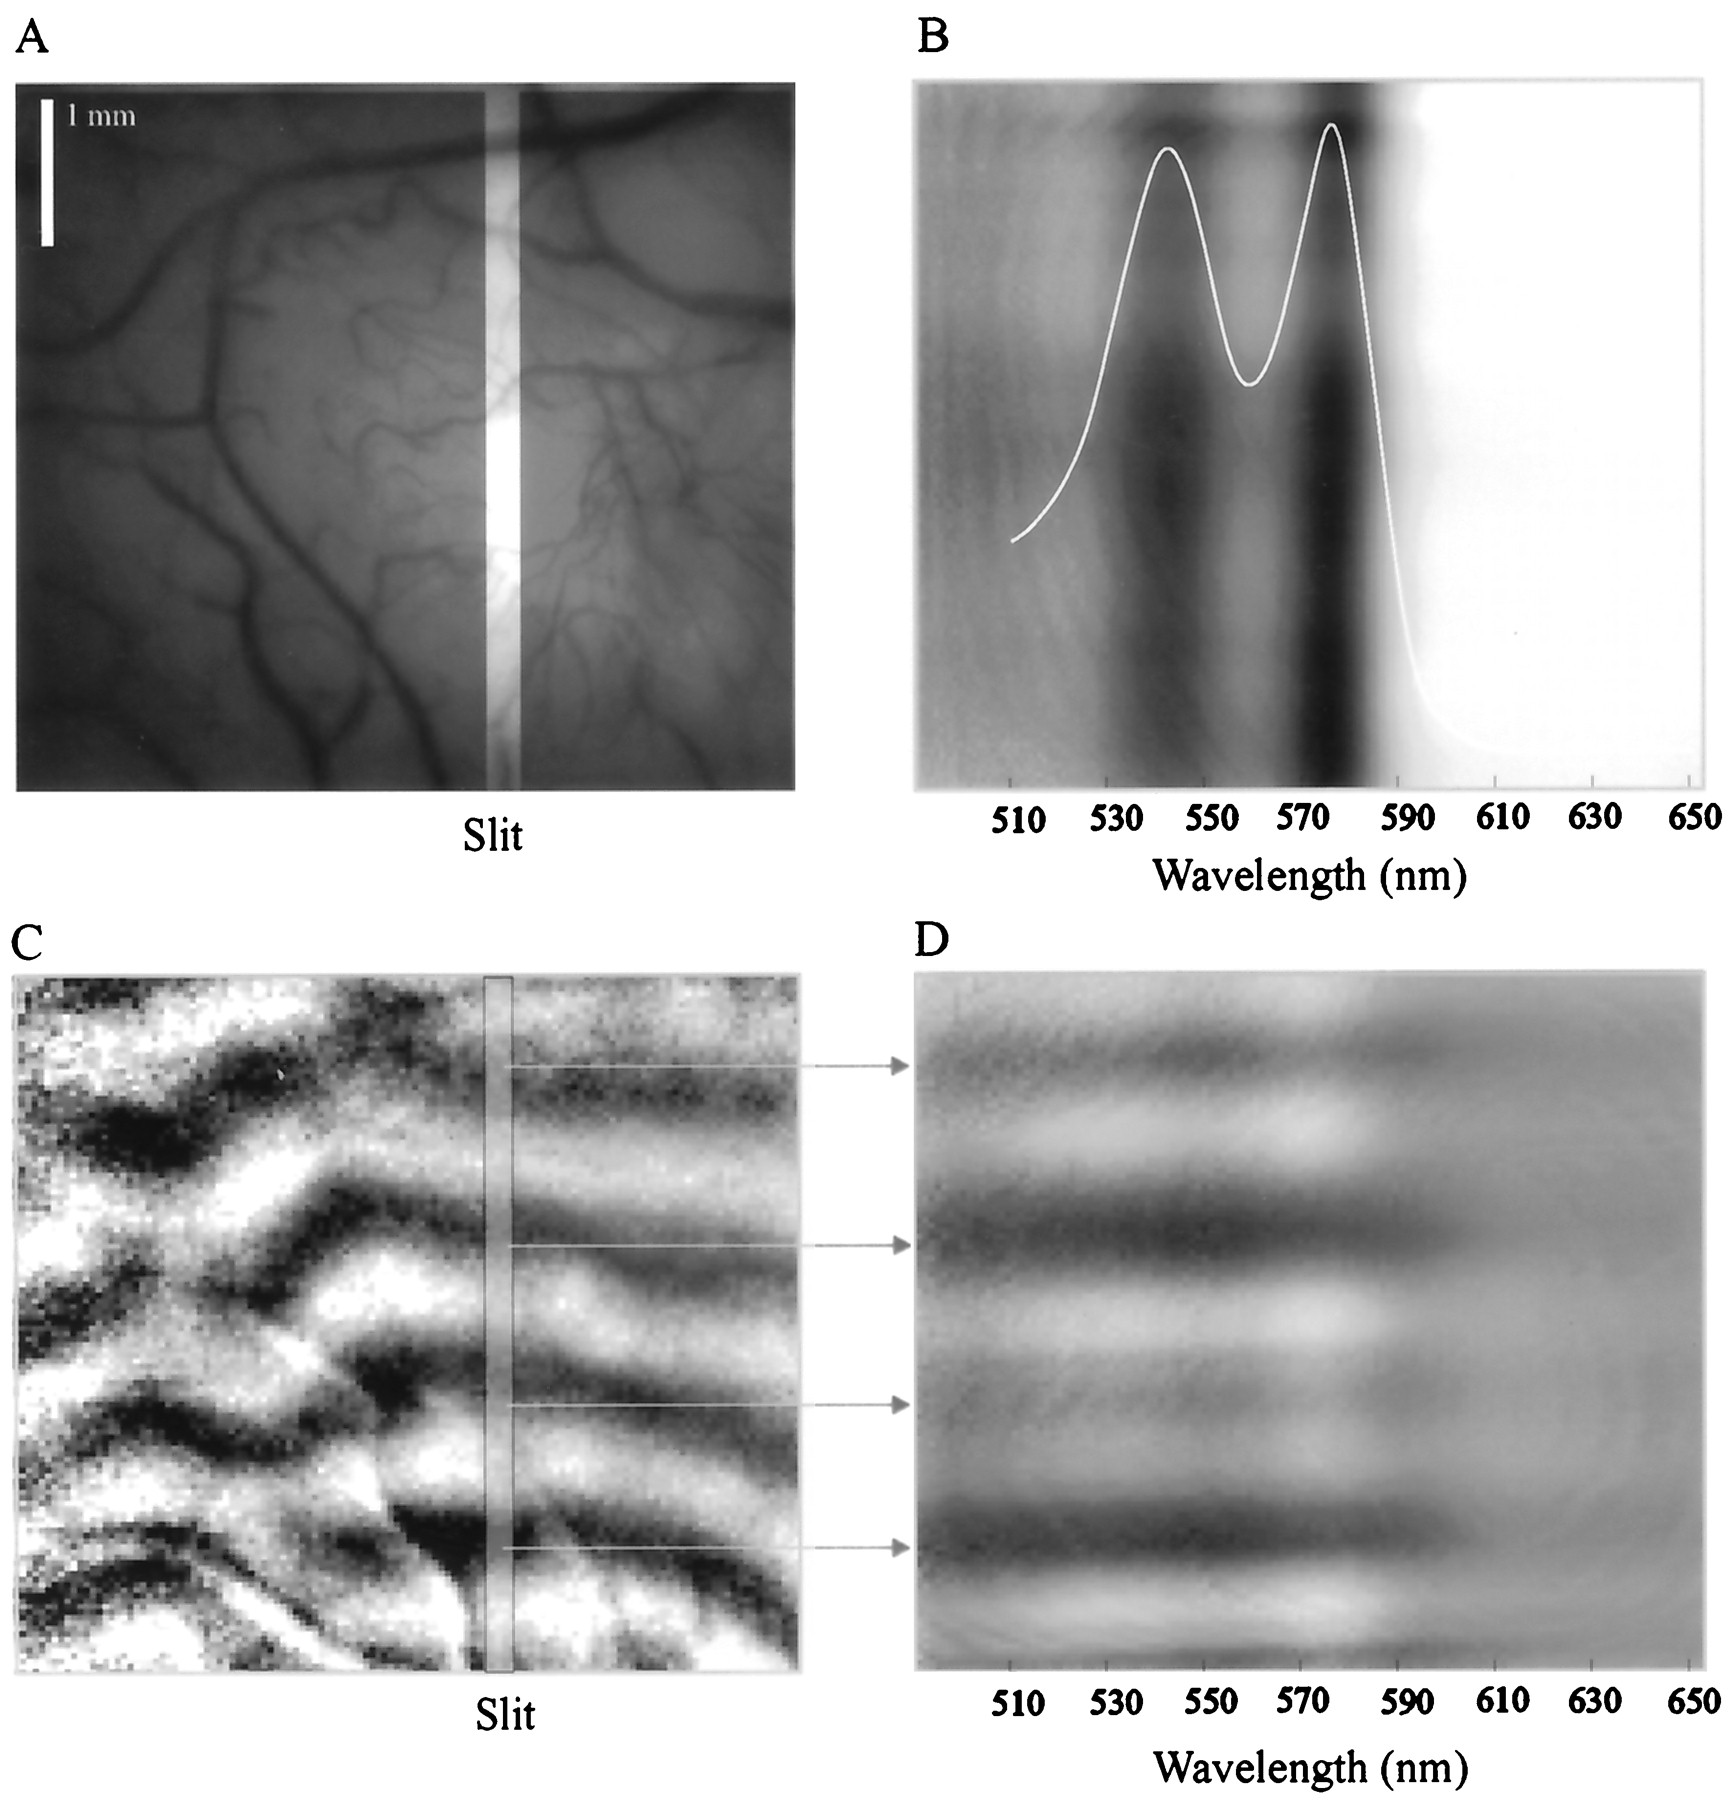
    Example of an image recorded by the optical imaging spectroscope. A, Cortical surface illuminated with green light (570 nm) to emphasize the blood vessels. The location of the slit is highlighted. B, An example of a spatiospectral image obtained by the macroscope. The raw pictures were imaged through the slit while the cortex was illuminated with broad-spectrum light. The image shown here was obtained by subtracting a frame collected before stimulus onset from a frame collected 5 sec after stimulus onset. The x-axis is the spectral dimension, and the y-axis is the spatial dimension along the slit. The two dark vertical bands in the image correspond to the two absorption peaks of oxyhemoglobin at 540 and 580 nm, as can be seen from the absorption spectrum of oxyhemoglobin (plotted in white). C, Ocular dominance map obtained through the spectroscope without the slit, at a wavelength of 605 nm. The location of the slit during the subsequent imaging spectroscopy session is marked on the map. D, Example of a spatiospectral ocular dominance map. The map was obtained through a slit located in the position shown in C. Thearrows show the correspondence between the spatiospectral bands and the two-dimensional ocular dominance stripes.

  • Fig. 4.
    • Download figure
    • Open in new tab
    • Download powerpoint
    Fig. 4.

    Time course of the global signal. The intensity of the reflected light during the stimulus condition relative to the intensity during the blank condition is plotted as a function of time from stimulus onset for awake (solid line) and anesthetized (dashed line) animals. The cortex was illuminated by red light (605 nm), which is sensitive to changes in the concentration of deoxyhemoglobin. A downward deflection shows darkening of the cortex.

  • Fig. 5.
    • Download figure
    • Open in new tab
    • Download powerpoint
    Fig. 5.

    Time course of the mapping signal. Functional orientation maps were created by dividing (equivalent to subtraction) images of the cortex collected when the stimulus consisted of bars of 45° by images collected when the stimulus consisted of bars of 135°. To show the time course of the map amplitude, the mean intensity of the centers of the black patches in the maps (patches of the cortex selective to bars of 45°) was then subtracted from the mean intensity of the white patches(patches of the cortex selective to bars of 135°) in each frame, and the result is plotted here as a function of time.

  • Fig. 6.
    • Download figure
    • Open in new tab
    • Download powerpoint
    Fig. 6.

    Two orientation maps collected from the same patch of the primary visual cortex, with a time difference of 6 months.

  • Fig. 7.
    • Download figure
    • Open in new tab
    • Download powerpoint
    Fig. 7.

    Stability of ocular dominance maps over 38 weeks of recording. The maps were recorded from the same patch of the visual cortex using identical stimuli. They are displayed here after transformation to the same standard coordinate system. The white lines are plotted at same location, relative to the blood vessels, in all of the maps.

  • Fig. 8.
    • Download figure
    • Open in new tab
    • Download powerpoint
    Fig. 8.

    Changes in the centers of the right-eye ocular dominance columns over 38 weeks. A, Demonstration of the stability of three ocular dominance columns. The centers of the three columns were independently measured in nine different imaging sessions and then superimposed according to the blood vessel landmarks.B, Demonstration of the method of calculation of the difference area (blue). The green line is the center of a right-eye ocular dominance column measured on one of the recording days. The red line is the average value of the center of the column measured over several recording days. Scale bar, 1 mm.

  • Fig. 9.
    • Download figure
    • Open in new tab
    • Download powerpoint
    Fig. 9.

    Mean difference area as a function of time from cortex exposure. Slow, consistent changes in the ocular dominance maps over a period of months would be indicated by a linewith a slope different from zero. Linear regression analysis confirmed that the slope does not differ significantly from zero (t test; p ≤ 0.01), indicating that there are no consistent changes in the location of the ocular dominance column centers.

  • Fig. 10.
    • Download figure
    • Open in new tab
    • Download powerpoint
    Fig. 10.

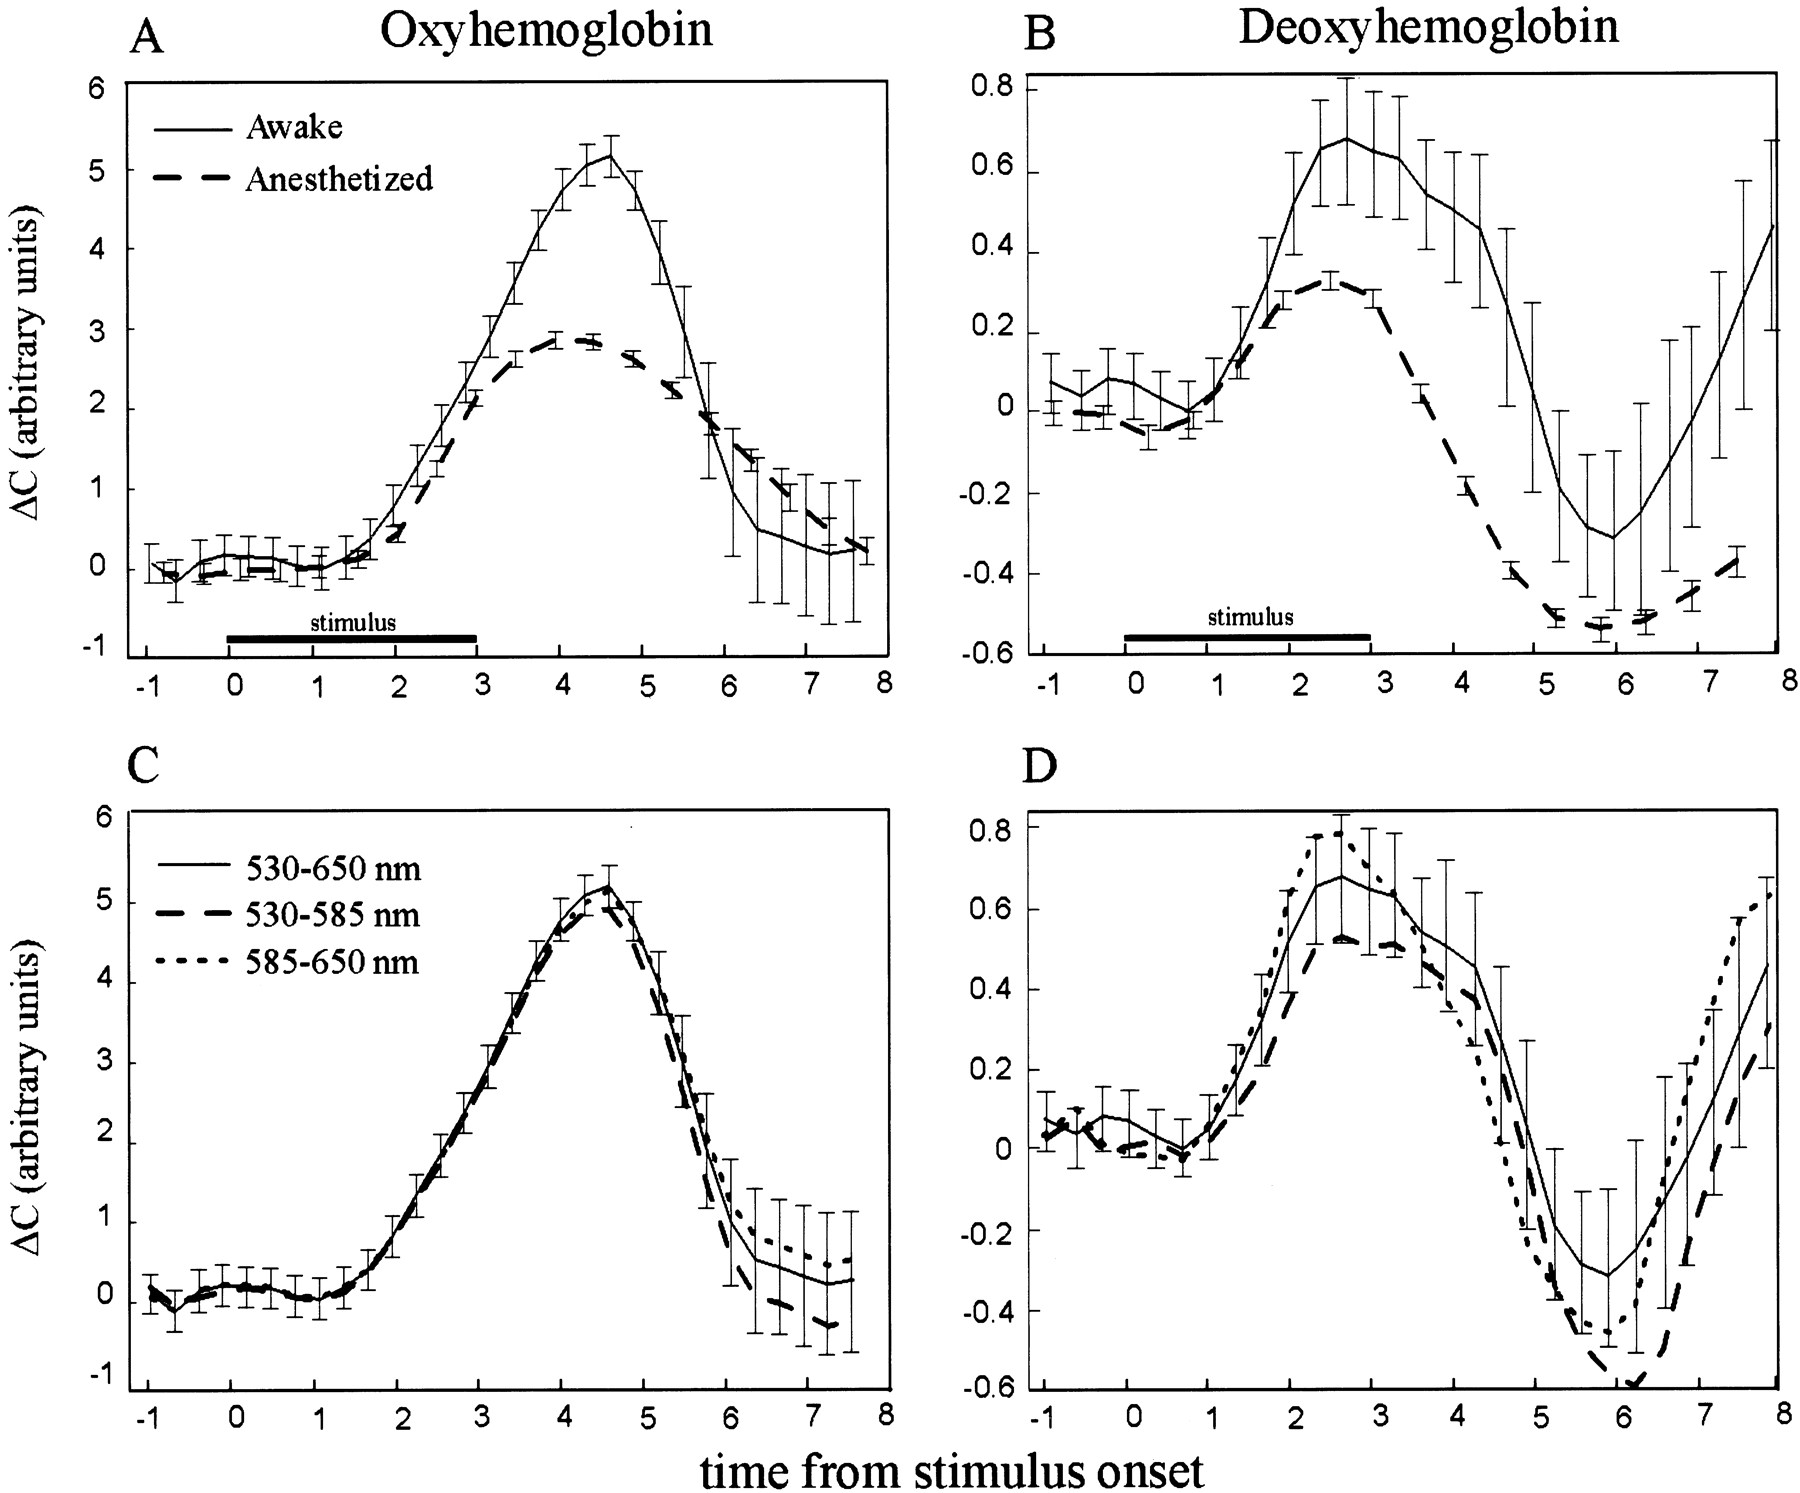
    Time course of the global changes in hemoglobin concentration. The y-axis units are linearly related to the concentrations of oxyhemoglobin and deoxyhemoglobin. Thex-axis is time from stimulus onset. A, Stimulus-evoked changes in the concentration of oxyhemoglobin.Solid lines, Awake monkeys; dashed lines, anesthetized cats (adapted from Malonek and Grinvald, 1996).B, Changes in the concentration of deoxyhemoglobin.Linecodes as in A.C, Changes in the concentration of oxyhemoglobin measured at two independent wavelength ranges: 530–585 (dashed line) and 585–650 (dotted line) nm. Thesolid plot shows the concentration calculated from the combined range of 530–650 nm. D, Changes in the concentration of deoxyhemoglobin measured at two independent wavelength ranges. Linecodes as inC.

  • Fig. 11.
    • Download figure
    • Open in new tab
    • Download powerpoint
    Fig. 11.

    Time development of ocular dominance maps in awake monkeys. The x-axis is the time dimension, and they-axis is the space dimension. The slit was oriented perpendicular to the ocular dominance columns (see Fig. 3).A, Time course of the oxyhemoglobin component.B, Time course of the deoxyhemoglobin component. Note that the horizontal bands indicative of the ocular dominance columns are much clearer for the deoxyhemoglobin component than for the oxyhemoglobin component. C, Mean mapping signal in the right-eye columns subtracted from the mean mapping signal in the left-eye columns.

Back to top

In this issue

The Journal of Neuroscience: 20 (21)
Journal of Neuroscience
Vol. 20, Issue 21
1 Nov 2000
  • Table of Contents
  • Cover (PDF)
  • Index by author
Email

Thank you for sharing this Journal of Neuroscience article.

NOTE: We request your email address only to inform the recipient that it was you who recommended this article, and that it is not junk mail. We do not retain these email addresses.

Enter multiple addresses on separate lines or separate them with commas.
Long-Term Optical Imaging and Spectroscopy Reveal Mechanisms Underlying the Intrinsic Signal and Stability of Cortical Maps in V1 of Behaving Monkeys
(Your Name) has forwarded a page to you from Journal of Neuroscience
(Your Name) thought you would be interested in this article in Journal of Neuroscience.
CAPTCHA
This question is for testing whether or not you are a human visitor and to prevent automated spam submissions.
Print
View Full Page PDF
Citation Tools
Long-Term Optical Imaging and Spectroscopy Reveal Mechanisms Underlying the Intrinsic Signal and Stability of Cortical Maps in V1 of Behaving Monkeys
Eran Shtoyerman, Amos Arieli, Hamutal Slovin, Ivo Vanzetta, Amiram Grinvald
Journal of Neuroscience 1 November 2000, 20 (21) 8111-8121; DOI: 10.1523/JNEUROSCI.20-21-08111.2000

Citation Manager Formats

  • BibTeX
  • Bookends
  • EasyBib
  • EndNote (tagged)
  • EndNote 8 (xml)
  • Medlars
  • Mendeley
  • Papers
  • RefWorks Tagged
  • Ref Manager
  • RIS
  • Zotero
Respond to this article
Request Permissions
Share
Long-Term Optical Imaging and Spectroscopy Reveal Mechanisms Underlying the Intrinsic Signal and Stability of Cortical Maps in V1 of Behaving Monkeys
Eran Shtoyerman, Amos Arieli, Hamutal Slovin, Ivo Vanzetta, Amiram Grinvald
Journal of Neuroscience 1 November 2000, 20 (21) 8111-8121; DOI: 10.1523/JNEUROSCI.20-21-08111.2000
del.icio.us logo Digg logo Reddit logo Twitter logo CiteULike logo Facebook logo Google logo Mendeley logo
  • Tweet Widget
  • Facebook Like
  • Google Plus One

Jump to section

  • Article
    • Abstract
    • MATERIALS AND METHODS
    • RESULTS
    • DISCUSSION
    • Footnotes
    • REFERENCES
  • Figures & Data
  • Info & Metrics
  • eLetters
  • PDF

Keywords

  • anesthesia
  • behaving monkeys
  • brain mapping
  • cortical columns
  • f-MRI
  • hemodynamics
  • optical imaging
  • plasticity
  • primary visual cortex

Responses to this article

Respond to this article

Jump to comment:

No eLetters have been published for this article.

Related Articles

Cited By...

More in this TOC Section

ARTICLE

  • Functional Hemichannels in Astrocytes: A Novel Mechanism of Glutamate Release
  • A Precise Retinotopic Map of Primate Striate Cortex Generated from the Representation of Angioscotomas
  • Differential Role of Mitogen-Activated Protein Kinase in Three Distinct Phases of Memory for Sensitization in Aplysia
Show more ARTICLE

Behavioral/Systems

  • Functional Hemichannels in Astrocytes: A Novel Mechanism of Glutamate Release
  • A Precise Retinotopic Map of Primate Striate Cortex Generated from the Representation of Angioscotomas
  • Differential Role of Mitogen-Activated Protein Kinase in Three Distinct Phases of Memory for Sensitization in Aplysia
Show more Behavioral/Systems
  • Home
  • Alerts
  • Visit Society for Neuroscience on Facebook
  • Follow Society for Neuroscience on Twitter
  • Follow Society for Neuroscience on LinkedIn
  • Visit Society for Neuroscience on Youtube
  • Follow our RSS feeds

Content

  • Early Release
  • Current Issue
  • Issue Archive
  • Collections

Information

  • For Authors
  • For Advertisers
  • For the Media
  • For Subscribers

About

  • About the Journal
  • Editorial Board
  • Privacy Policy
  • Contact
(JNeurosci logo)
(SfN logo)

Copyright © 2022 by the Society for Neuroscience.
JNeurosci Online ISSN: 1529-2401

The ideas and opinions expressed in JNeurosci do not necessarily reflect those of SfN or the JNeurosci Editorial Board. Publication of an advertisement or other product mention in JNeurosci should not be construed as an endorsement of the manufacturer’s claims. SfN does not assume any responsibility for any injury and/or damage to persons or property arising from or related to any use of any material contained in JNeurosci.