

Abstract
Many neurons in the rat lateral mammillary nuclei (LMN) fire selectively in relation to the animal's head direction (HD) in the horizontal plane independent of the rat's location or behavior. One hypothesis of how this representation is generated and updated is via subcortical projections from the dorsal tegmental nucleus (DTN). Here we report the type of activity in DTN neurons. The majority of cells (75%) fired as a function of the rat's angular head velocity (AHV). Cells exhibited one of two types of firing patterns: (1) symmetric, in which the firing rate was positively correlated with AHV during head turns in both directions, and (2) asymmetric, in which the firing rate was positively correlated with head turns in one direction and correlated either negatively or not at all in the opposite direction. In addition to modulation by AHV, some of the AHV cells (40.1%) were weakly modulated by the rat's linear velocity, and a smaller number were modulated by HD (11%) or head pitch (15.9%). Autocorrelation analyses indicated that with the head stationary, AHV cells displayed irregular discharge patterns. Because afferents from the DTN are the major source of information projecting to the LMN, these results suggest that AHV information from the DTN plays a significant role in generating the HD signal in LMN. A model is proposed showing how DTN AHV cells can generate and update the LMN HD cell signal.
- dorsal tegmental nucleus of Gudden
- lateral mammillary nuclei
- head direction cell
- angular head velocity
- nucleus prepositus hypoglossi
- directional heading
- neural integration
- vestibular system
- navigation
- spatial orientation
Neurons that discharge selectively in relation to an animal's head direction (HD) in the horizontal plane (HD cells) have been identified in several limbic system structures in the rat, including the postsubiculum (Taube et al., 1990a), anterior dorsal thalamic nucleus (ADN) (Taube, 1995), lateral mammillary nuclei (LMN) (Blair et al., 1998; Stackman and Taube, 1998), lateral dorsal thalamic nucleus (Mizumori and Williams, 1993), and retrosplenial cortex (Chen et al., 1994; Cho and Sharp, 2001). These brain areas are interconnected with one another in the classic Papez circuit. A series of lesion studies has identified the sequence of processing of the HD signal. Goodridge and Taube (1997) found that lesions of the ADN disrupted HD cell firing in the postsubiculum but that lesioning the postsubiculum left HD cell firing intact in the ADN. Two recent studies have established that bilateral lesions of the LMN disrupt HD cell firing in the ADN (Tullman and Taube, 1998; Blair et al., 1999). Thus, the HD cell signal appears to be generated in the LMN or in areas afferent to it.
Previous studies have postulated that the ADN serves as a convergence point for different types of spatial information onto HD cells, with idiothetic or self-generated cues about movement (e.g., vestibular, proprioceptive, and motor efference copy) ascending from subcortical structures and allothetic or externally originating cues about the local environment (landmarks) descending from cortical association areas (Taube, 1998). In this way, idiothetic information might keep a constantly updated representation of the animal's movement relative to the environment, subject to error correction from landmark cues, and thereby maintain a stable representation of the animal's perceived directional heading (Gallistel, 1990; McNaughton et al., 1991). Although several studies have indicated the importance of motor information for updating HD cell firing (Taube et al., 1996; Taube and Muller, 1998), vestibular input onto HD signals is critical for the presence of direction-specific firing, because lesions of the vestibular apparatus, or temporary inactivation of it, completely disrupt HD cell firing in the ADN and postsubiculum (Stackman and Taube, 1997; Stackman et al., 2001). How vestibular information is conveyed to the ADN and LMN is unclear, but anatomical studies indicate that projections from the medial vestibular nuclei innervate the dorsal tegmental nucleus (of Gudden) (DTN) directly and indirectly via the nucleus prepositus hypoglossi (nPH) (Liu et al., 1984). The DTN in turn has reciprocal connections with the LMN (Shibata, 1987; Allen and Hopkins, 1989) and with the nPH (Liu et al., 1984). The nPH is believed to be one site where angular head velocity (AHV) signals from the vestibular nucleus are transformed into eye position signals for the vestibular ocular reflex (Baker, 1977). The medial vestibular nucleus receives its major input from the horizontal semicircular canals, which are sensitive to angular acceleration of the head in the horizontal plane (Leigh and Zee, 1999). It is precisely this type of information that, if integrated twice over time, would yield information about how much to shift the animal's perceived HD after a head turn, just as angular acceleration is integrated twice over time to yield an eye position signal in the vestibulo-ocular reflex (VOR) (Robinson, 1989). The type of information encoded by neurons in the DTN is unknown. The present study was therefore designed to identify signals in the DTN that might contribute to the HD representation in LMN. We report that the majority of cells in the DTN had activity correlated with the animal's AHV. Some of these AHV cells were also modulated by the animal's linear velocity, head pitch, or HD.
MATERIALS AND METHODS
Subjects and training
Subjects were 13 female Long–Evans rats, weighing 250–300 gm. Rats were maintained on a food-restricted diet (15–20 gm/d), and water was available ad libitum. All training and unit screening took place while rats foraged for food pellets in a gray cylindrical enclosure (76 cm diameter and 51 cm high) with replaceable gray photographic backdrop paper covering the floor. A black curtain suspended from the ceiling surrounded the cylinder and extended from the floor to the ceiling. Lighting was provided by eight uniformly arranged DC lights suspended overhead. A color video camera (model XC-711; Sony, Tokyo, Japan) was centered above the cylinder 3 m from the floor surface. The only intentionally introduced asymmetry in the environment was a white cue card that occupied 100° of arc along the wall of the cylinder and extended from the floor to the top of the cylinder. The cue card was intended to serve as an orientation reference point for the rats. Rats were habituated to the cylinder and trained to forage for small food pellets (20 mg; Bio-Serv, Frenchtown, NJ) ejected automatically from a ceiling-mounted dispenser at random intervals that averaged 20 sec. By the completion of training, rats engaged in near-continuous food pellet foraging, moving over the entire floor surface of the cylinder. All procedures involving the rats were performed in compliance with institutional standards set forth by theNational Institutes of Health Guide for the Care and Use of Laboratory Animals and the Society for Neuroscience.
Electrode implantation
Electrode construction and implantation have been described in detail previously (Kubie, 1984) and are only reviewed briefly here. Each electrode array consisted of 10 25-μm-diameter nichrome wires (California Fine Wire Company, Grover City, CA) insulated except at the tips. The wires were passed through a 26 gauge stainless steel cannula that was 25 mm long, and each wire was connected to a modified 11-pin Augat connector. The electrode array could be advanced in the dorsal–ventral plane via the use of three screws attached to an acrylic base on the electrode. After at least 1 week of training (1 trial/d), each rat was anesthetized with a ketamine–xylazine mixture (2 ml/kg, i.m.) and stereotaxically implanted with an electrode array directed at the DTN in one hemisphere (seven rats, right hemisphere; six rats, left hemisphere). Coordinates with respect to bregma were as follows: anterior–posterior, −8.85 to −9.25 mm; medial–lateral, ±0.25 mm; and dorsal–ventral, −7.0 mm from the bregma–lambda plane (Paxinos and Watson, 1998). Two stainless steel screws were placed in the skull posterior to lambda, and two more screws were placed anterior to bregma. Dental cement anchored the electrode in place. Rats were given a postoperative analgesic for the first day after surgery (buprenorphine hydrochloride, 0.75 mg/kg, i.p.) and were allowed at least 1 week of postoperative recovery before commencing single-unit screening.
Isolation and recording of single-unit activity
The activity on each electrode wire was assessed during daily screening sessions while the rat foraged for food pellets in the cylinder. The electrode wires were advanced over several weeks while screening for single-unit waveforms that were isolatable from background electrical noise. Each rat was hand carried into the recording room, and no attempt was made to disorient the rat as it was placed into the cylinder. Each cell was recorded for at least 8 min.
Electrical signals from the electrode wires were passed through a field-effect transistor in a source–follower configuration and then through an overhead commutator (Biela Development). The signals were then amplified (Grass Instruments, P5 series), bandpass filtered (300–10,000 Hz; ≥3 dB/octave; model PME8; Peavey Electronics), and then passed through a series of window discriminators (model DDIS-1; BAK Electronics). The resultant signal was then displayed on an oscilloscope (model 2214; Tektronix). The activity from each electrode was monitored while observing the rat's behavior on a video monitor. Two light-emitting diodes (LEDs; one red and one green) attached to the recording cable rotated with the rat's head and were visible to the camera mounted overhead. The x–y coordinates of the red LED positioned over the rat's snout and the green LED positioned over its back were monitored at 60 Hz. The relative position of the two LEDs with respect to one another indicated the rat's HD and its position in the cylinder. If isolatable activity was not found, the electrode was advanced further into the brain, and the screening process was repeated a minimum of 2 hr later. When the waveform of a cell could be sufficiently isolated from background noise, the LED coordinates and neuronal discharges were sampled at 60 Hz and acquired by a data acquisition interface board (DIO-96; National Instruments) in a personal computer (Macintosh G4). Data were stored for subsequent off-line analyses using LabView software programs (National Instruments).
Data analysis
Head direction and angular head velocity. HD and AHV were determined using methods described previously (Taube, 1995). Briefly, the rat's HD was determined from the relative positions of the two LEDs. The firing rate as a function of HD was computed by summing the number of spikes that occurred and the time spent in each 6° angular bin and then dividing the total number of spikes by the time spent in each bin across the entire recording session.
For AHV, HD values were used to construct an HD versus time function that was then smoothed using the following function:n = (nt−2 +nt−1 + n +nt+1 +nt+2)/5. The first derivative (angular velocity) for each time sample was calculated by defining an episode of five time points centered on that sample and then determining the slope of the best-fit line through those five points. For each cell, the firing rate was plotted as a function of AHV using 6°/sec bin intervals. Because high AHVs must necessarily be preceded by passing through the range of lower AHVs, there is an inherent sampling bias toward lower AHVs, resulting in fewer samples and therefore greater variance at high AHVs. Therefore, to minimize the effect of this sampling bias, we excluded all AHV bins containing <60 samples (corresponding to 1 sec of recording time). For each 6°/sec AHV bin, we calculated values for mean velocity and mean firing rate (number of spikes divided by the number of time samples in each bin). We then plotted a firing rate by AHV scattergram for each recording session.
From the firing rate–AHV functions, we calculated several parameters: (1) baseline firing rate, (2) peak firing rate, and (3) slope and correlation coefficients for the best-fit lines of the clockwise (CW) and counterclockwise (CCW) functions.
The baseline firing rate was defined as the firing rate when the rat's head was relatively motionless in the angular dimension. Because the firing rate–AHV function was plotted in 6° bin intervals, the baseline firing rate was therefore defined as the mean firing rate of the first bins in the CW and CCW directions (i.e., head turns of −6 to 6°/sec). Because this definition of the baseline rate would include episodes of both nonmovement and very slow movement, there was some concern that this measure would lead to misleading estimates of the baseline firing rate, particularly for cases in which a cell had a very steep firing rate–AHV function (see Fig. 2 for example). We tested for this possibility by constructing firing rate–AHV plots with 1°/sec bins. This analysis yielded baseline firing rates that were only marginally lower (∼1.5 spikes/sec on average) than those yielded by 6°/sec bins (data not shown). Thus, for simplicity, the baseline firing rate values reported here use 6°/sec bin analyses.
We defined the peak firing rate as the maximum value of the best-fit third-order polynomial of the firing rate–AHV function. This procedure was used because selecting the highest observed firing rate for the peak firing rate of the firing rate–AHV function appeared misrepresentative of the data because of the high variance and poor sampling at high AHVs.
Linear velocity. The relationship between firing rate and linear velocity was calculated using procedures described previously (Taube et al., 1990a). Briefly, all episodes in which the rat maintained its head within a ±6° radius of arc for at least 10 consecutive samples were selected from the recorded session. For each episode, the distance the rat traveled between the first and last samples was correlated with the mean firing rate across the episode.
Head pitch. Head pitch was determined by methods described previously (Stackman and Taube, 1998). Briefly, for each sample (1/60th of a second), pitch was calculated by determining the arccosine of the distance between the red and green LED head lights and dividing by the maximum distance between the two LEDs (11 cm). This method does not distinguish between upward and downward pitches. However, the LED apparatus restricts forward head pitches beyond −40° when all four limbs are in contact with the ground; thus, downward head tilts seldom exceeded −40° during exploratory behavior and foraging. Therefore, 40° was defined as the cutoff point, above which pitch values were considered relatively free of contamination by negative pitch. Firing rate by head pitch functions were constructed for each cell by dividing the range of head pitch from 0 to 88° into 4° bins and determining a mean firing rate for each bin. The amount of sampling was usually low above a head pitch of 80°; thus, firing rate–head pitch tuning functions depict only bins containing at least 60 samples (1 sec).
Autocorrelograms. The number of spikes that occurred for each 1 msec bin for 500 msec before and after the incidence of a spike at time 0 was summed. Histograms of spikes in each millisecond bin reveal the presence or absence of periodic modulation of cell firing. Because the rats were freely moving, angular head acceleration varied throughout the session. This situation might obscure possible regular patterns of firing if analyses were conducted using samples from all AHVs. Consequently, the presence or absence of periodic discharge in vestibular neurons was determined with the animal at rest, and spikes that occurred during head movements of >6°/sec were excluded from analysis.
Statistical procedures. t tests were used to determine the significance of differences between groups of data. Paired-sample t tests were used for comparing correlation coefficient and slope values obtained from the same cell for CW and CCW functions. For tests comparing samples of different sizes, mixed-variance t tests were used with corrected degrees of freedom (Hays, 1994). All statistical error values are reported as SEM. Significance for all statistical tests was set at 0.05.
Histology
After the electrode array had been advanced at least 2 mm, unit screening and recording ceased, and the rats were given a lethal dose of sodium pentobarbital (100 mg/kg, i.p.). Weak anodal current (15 μA for 20 sec) was passed through one or more of the electrode wires to mark the location of the electrode with a Prussian blue reaction resulting from ferrous deposits. The rats were perfused transcardially with 0.9% saline followed by 10% formalin. Brains were removed and placed into 10% formalin for at least 48 hr, then transferred to a 10% formalin and 2% potassium ferrocyanide solution for 24 hr, returned to the 10% formalin solution for 24 hr, and finally placed in a 20% sucrose solution. After at least 48 hr in the sucrose solution, brains were blocked, frozen, and sectioned coronally at 25 μm on a cryostat and mounted onto microscope slides. Sections were stained with cresyl violet and examined under light microscopy to determine the location of recording sites. Prussian blue marks at the most ventral extent of the electrode tracks were used to approximate the dorsal–ventral location of recorded cells. Because some regions adjacent to the DTN, such as the medial longitudinal fasciculus (Remmel and Skinner, 1979; Minor et al., 1990), cerebellum (Hirai, 1987), and possibly the central gray (Liu et al., 1984; Cottingham and Pfaff, 1987), contain cells that either receive afferents from the vestibular system or contain fibers that carry vestibular signals, we might conceivably have encountered firing correlates outside the DTN that were similar to those reported here for DTN neurons. Thus, data collected from subjects in which electrode placement within the DTN could not be unequivocally verified were not used for analysis.
RESULTS
Histology
Histological analyses confirmed that the electrode array had passed through the DTN in all 13 rats. However, accurate estimates of the dorsal–ventral placement of recorded cells could only be made in 8 of these 13 rats. The cells recorded from the remaining 5 rats had neuronal correlates similar to those described below, but they were not included in the analyses because the electrode placements could not be verified with certainty in the dorsal–ventral dimension and thus we could not conclusively rule out the possibility that they were recorded in an adjacent area containing AHV signals. On the basis of cytoarchitectonics and connectivity, the DTN can be subdivided into two distinct subnuclei, pars centralis and pars pericentralis (Paxinos and Watson, 1998). However, because these two subnuclei overlie one another, our electrodes passed through both structures, and it was not possible to determine from which subnuclei the cells discussed below originated. Figure 1 shows a schematic diagram of a coronal section through the DTN at the anterior–posterior level where we observed most of the recording sites and a photomicrograph of a representative histological section confirming the electrode placement.

A, Schematic illustration of a coronal section showing DTN at −9.16 mm posterior to bregma. The DTN are shaded bilaterally. B, Photomicrograph of a coronal section stained with cresyl violet. Two electrode tracks are visible passing through the DTN in the left hemisphere; a white arrow points to the center of the intact DTN in the right hemisphere [modified from Paxinos and Watson (1998)]. 4V, Fourth ventricle; Cb, cerebellum; LC, locus coeruleus; mcp, middle cerebellar peduncle; Me5, mesencephalic nucleus of V; ml, medial lemniscus; mlf, medial longitudinal fasciculus; PaS, parasubiculum;py, pyramidal tract; rs, rubrospinal tract; scp, superior cerebellar peduncle;tz, trapezoid body; Tz, nucleus of the trapezoid body. Scale bar, 250 μm.
Qualitative description and categorization
A total of 44 cells in eight rats could be histologically confirmed as having been recorded in the DTN. Twenty-five cells were recorded in the right hemisphere from four rats, and 19 cells were recorded in the left hemisphere from four rats. The firing activity of most cells (n = 33; 75%) appeared related to the AHV of the animals. The remaining cells (n = 11; 25%) had no determinable behavioral correlate. Cells that were modulated by AHV were grouped into one of two categories based on the firing rate by AHV plot of the cell. The percentages below are expressed as the percentage of the total number of cells recorded in the DTN.
Symmetric AHV cells (n = 21; 47.7%) exhibited increased firing rates with greater AHV during head turns in either CW or CCW directions. In addition, the rate of increase in firing rate with greater AHV (i.e., slope of the firing rate–AHV function) was also similar in both turn directions. Symmetric AHV cells varied widely in their peak and baseline firing rates and in the slope of their firing rate–AHV functions.
Asymmetric AHV cells (n = 12; 27.3%) exhibited firing rate increases (n = 11) or decreases (n= 1) with greater AHV during head turns in one direction but decreases or constant firing rates during head turns in the opposite direction. As with symmetric AHV cells, they displayed a wide range of characteristic firing rate–AHV functions. The 11 cells that showed firing rate increases are referred to as asymmetric AHV cells, whereas the one cell in which the firing rate decreased linearly with AHV is referred to as an asymmetric-negative AHV cell.
Some AHV cells from both categories were modulated by the animal's linear velocity, head pitch, or directional heading. These secondary firing correlates will be discussed further below. Symmetric AHV cells were observed in all rats, and asymmetric AHV cells were observed in four of eight rats. Symmetric and asymmetric cells were encountered in no discernable order as the electrodes were advanced. Thus, we were unable to detect any topographical organization by function or firing properties in the DTN.
Quantitative description of AHV-modulated DTN cells
Symmetric AHV cells
Figure 2 shows firing rate–AHV functions from three representative symmetric AHV cells. For some cells, the firing rate–AHV relationship was very linear across all AHVs (Fig. 2A), whereas for other cells, the rate of change in firing rate declined at higher AHVs (Fig.2B). For a few cells, there was a strong relationship between firing rate and AHV only within a narrow range of AHVs from 0 to ∼90°/sec or less (Fig. 2C).

Symmetric AHV cells. Examples of different symmetric AHV cells showing different variations of the firing rate by AHV functions. A, AHV cell showing linear functions from low to high AHVs. B, Cell with steep slopes at low AHVs and shallower slopes above ∼90°/sec. C, Cell with steep slopes at low AHVs and near-zero slopes at high AHVs. CW and CCW directions are as indicated in A for all graphs.
For each symmetric AHV cell, we performed a linear regression analysis on the firing rate–AHV functions for CW and CCW head turns. The correlation coefficients were >0.50 for 18 of 21 cells. The remaining four cells had low correlation coefficients because there was only a good relationship between firing rate and AHV at low AHVs; at high AHVs, there was no apparent relationship. An example of one of these cells is shown in Figure 2C. Because these four cells contained strong relationships at low AHVs, we determined their correlation coefficients and slope values using AHVs between 0 and 60°.
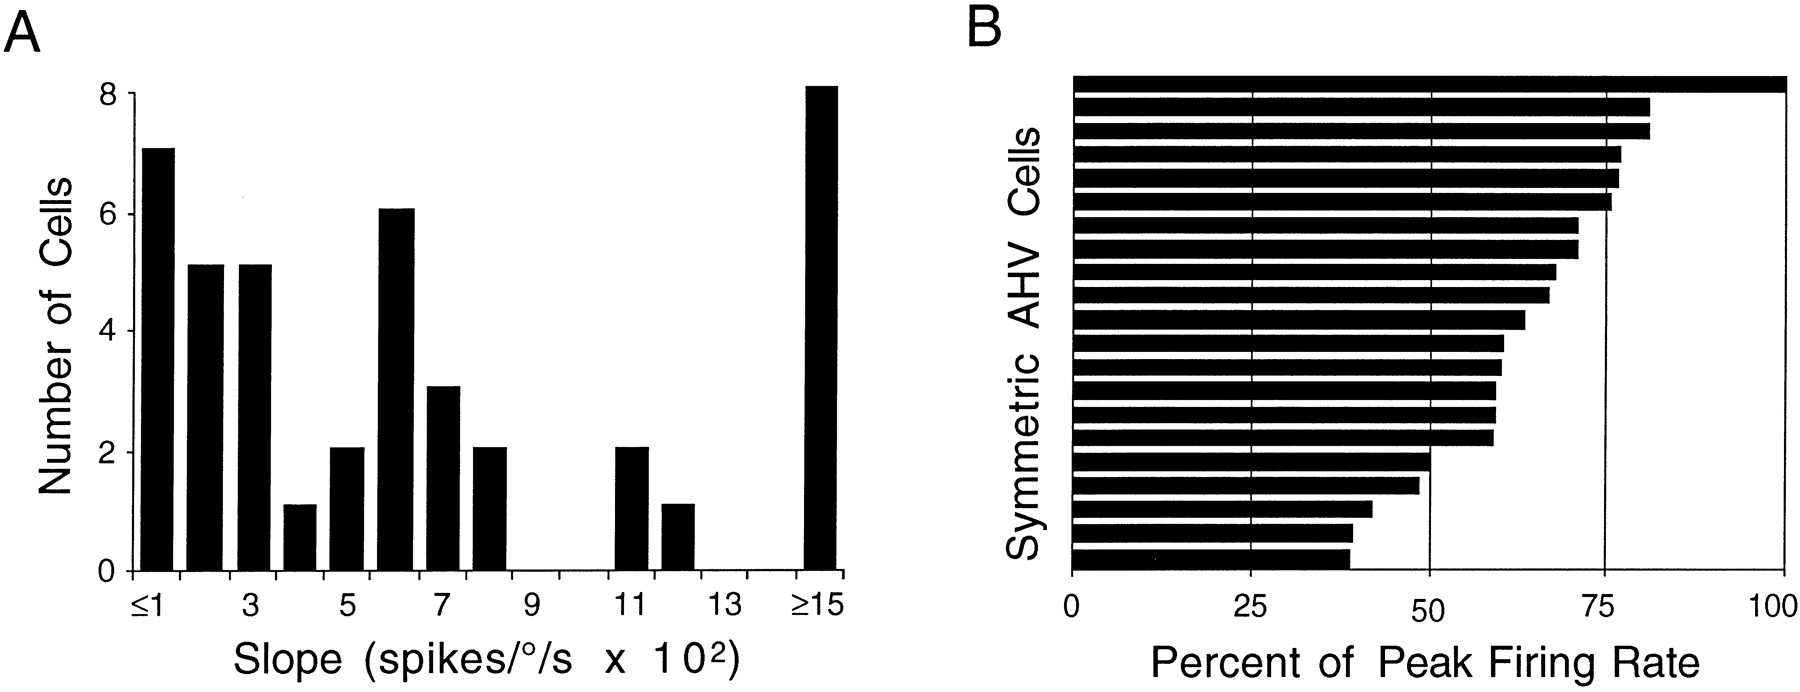
The mean correlation coefficients for CW and CCW head turns were 0.755 ± 0.033 (range, 0.487–0.935) and 0.750 ± 0.032 (range, 0.340–0.940), respectively. The slopes of the best-fit regression lines varied considerably for both CW and CCW head turns. For CW head turns, the mean slope was 0.0807 ± 0.0191 spikes per degrees per second (range, 0.0050–0.3103 spikes per degrees per second). For CCW head turns, the mean slope was 0.0791 ± 0.0185 spikes per degrees per second (range, 0.0047–0.2840 spikes per degrees per second). Figure3A shows the distribution of slopes for CW and CCW head turns across all cells. Although the slopes varied considerably across cells, the slopes were generally similar for CW and CCW head turns for the same cell. As a measure of the difference between CW and CCW slopes, we calculated a “difference score” for each function, which was defined as the absolute value of the CW slope minus the CCW slope. If the firing rate by AHV functions are truly symmetrical, then these scores should not vary significantly from zero. The mean difference score was 0.0015 ± 0.0032 spikes per degrees per second (range, −0.0163 to 0.0371 spikes per degrees per second).

A, Frequency distribution histogram of the slopes of the firing rate–AHV function for symmetric AHV cells. A wide range of slope values is displayed across all cells.B, Firing rate at 45°/sec as a percentage of the maximum firing rate for symmetric AHV cells. Cells approach their peak firing rates across a wide range of AHVs. Consequently, there is a wide range of percentages observed across the AHV cell population, suggesting that each cell is tuned to maximally encode a specific AHV range.
The mean baseline firing rate was 9.0 ± 1.9 spikes/sec (range, 1.2–34.7 spikes/sec). To determine the peak firing rate for each cell, the CW and CCW firing rate–AHV functions were combined (because the two functions were symmetrical) and fit to a third-order polynomial. This procedure was used to offset the poor sampling and large variability in firing rate at high AHVs observed for many cells. The mean peak firing rate across all symmetric AHV cells was 28.2 ± 6.2 spikes/sec (range, 4.2–91.2 spikes/sec).
Because of the wide ranges of baseline and peak firing rates among these cells, we determined whether baseline or peak firing rates were related to the strength or slope of the firing rate–AHV correlation. Using the combined CW and CCW function, baseline firing rate (r = 0.316) and peak firing rate (r = 0.448) were positively correlated with the strength of the firing rate–AHV function. Interestingly, both parameters were highly correlated with the slope of the function (baseline firing rate,r = 0.816; maximum firing rate, r = 0.811), indicating that cells with higher firing rates tended to have a stronger relationship between firing rate and AHV and a greater rate of change.
As described above, many of the firing rate–AHV functions had good linear fits with steep slopes at low AHVs, but at high AHVs the linear relationships became less striking, and the slopes became less steep (Fig. 2C). This observation coupled with the large range of slopes suggests that individual cells may optimally encode a specific range of AHVs and enable the population of DTN cells to encode collectively the entire range of AHVs. To test this hypothesis, the firing rate–AHV function for each cell was fit to a third-order polynomial, and the firing rates for head turns at 45°/sec were determined; these rates were then expressed as a percentage of the peak firing rate of the cell. For this analysis, CW and CCW head turns were combined, and we computed a head turn direction-independent firing rate–AHV function. The firing rate percentages at AHVs of 45°/sec varied considerably across cells, and Figure 3B illustrates all of the firing rate percentage values in ascending order. The wide distribution indicates that for head turns of 45°/sec, some cells discharged near their maximum firing rate, some cells discharged at rates in the middle range of their firing rates, and other cells discharged at the low end of their firing rate range. This distribution suggests that individual cells within the population are optimally tuned for encoding different ranges of AHVs. Nonetheless, most cells had their greatest modulation of firing rate at low AHVs; Figure3B shows that 17/21 (81%) of the cells reached at least 50% of their peak firing rate at 45°/sec. This steep slope at low AHVs may be attributable to an acceleration component within the function. Because acceleration is usually highest at the beginning of a head turn, a firing rate by acceleration function would rise sharply from zero and then asymptote, thus reaching a maximum firing rate at a point well below the peak velocity for the head turn. A combined acceleration and velocity function would then appear like many of the DTN cell firing rate by AHV functions with two linear phases.
Asymmetric AHV cells
Figure 4 depicts three representative asymmetric AHV cells. To conduct comparisons across all asymmetric AHV cells, CW and CCW firing rate–AHV functions were recategorized according to which head turn direction exhibited a positive correlation (referred to as the preferred turn direction) and which head turn exhibited a negative or zero correlation (referred to as the nonpreferred turn direction). The firing rate of most asymmetric AHV cells increased from zero at the initiation of movement in either turn direction, but after reaching a low-threshold AHV in the nonpreferred turn direction, the firing rate either decreased linearly with increasing AHV (n = 4) (Fig. 4A) or had a flat slope at AHVs above this threshold (n = 4) (Fig. 4B). In contrast, a few asymmetric AHV cells (n = 3) had firing rates that increased linearly in the preferred turn direction but had similar firing rates at all AHVs in the nonpreferred turn direction. In addition to these 11 cells in which firing rate correlated positively with AHV in the preferred turn direction, there was one atypical asymmetric cell in which firing correlated negatively with AHV in one direction of head turn and was not related at all to AHV in the other direction (Fig. 4C). This asymmetric-negative AHV cell had a firing rate of 27.3 spikes/sec with head turns <6°/sec, and the firing rate decreased to ∼15 spikes/sec at high AHVs in the CCW direction. Firing rate was strongly correlated with AHV in this direction (r = −0.88).

Asymmetric AHV cells. Examples of different asymmetric AHV cells showing different variations of the firing rate by AHV functions. A, A frequently observed pattern of symmetric modulation at low AHVs around 0°/sec that changes to an asymmetric pattern at higher velocities. B, A linear increase in firing rate in the preferred turn direction but no modulation of firing rate in the nonpreferred turn direction.C, An atypical cell in which the firing rate was negatively correlated with AHV during CCW head turns but was not correlated at all with AHV during CW head turns. CW and CCW directions are as indicated in A for all graphs.
As with symmetric AHV cells, we determined a difference score for asymmetric AHV cells, consisting of the slope for the preferred turn direction function minus the slope of the nonpreferred turn direction function. Confirming our classification scheme, the mean difference score for asymmetric AHV cells was 0.0401 ± 0.0134, which was significantly different both from zero (t = 3.08; df = 10; p < 0.05) and from the difference score for symmetric AHV cells (t = 2.86; df = 11;p < 0.05).
The baseline and peak firing rates of the preferred functions of asymmetric AHV cells were similar to those of symmetric AHV cells. To determine the peak firing rate for asymmetric AHV cells, the preferred function was fit to a third-order polynomial (see procedure above). The mean baseline firing rate was 6.1 ± 1.1 spikes/sec (range, 1.2–12.8 spikes/sec), and the mean peak firing rate was 17.9 ± 3.6 spikes/sec (range, 6.6–43.7 spikes/sec). There was a small negative correlation between the r value and the peak firing rate for the preferred head turn direction (r = −0.281).
Asymmetric cells and recording site hemisphere
Asymmetric AHV cells were recorded in four rats. Two rats had electrodes implanted in the right hemisphere, and two rats had electrodes implanted in the left hemisphere. Five cells had CW preferred turn directions, and six cells had CCW preferred turn directions. With two exceptions, these 11 cells were recorded in the hemisphere contralateral to the preferred turn direction, suggesting that there was a trend for asymmetric cells to have a preferred turn direction toward the contralateral side from which it was recorded. The two exceptional cases were each recorded in different rats from which other asymmetric cells were recorded with the opposite preferred turn direction. The one asymmetric-negative AHV cell was recorded in the left hemisphere and had its modulated function in the CCW direction.
Regular versus irregular firing of AHV cells
Previous studies in vestibular nucleus neurons and vestibular nerve afferents have resulted in a number of classification schemes for cells with AHV-modulated firing. The above findings, for instance, suggest the influence of type II vestibular afferents, which increase their firing with stimulation of the contralateral vestibular nerve (Leigh and Zee, 1999). Another distinction that has been made is between regular and irregular tonic firing patterns when the head is stationary (Goldberg and Fernández, 1971). Regular neurons discharge in a regular, periodic pattern with a fixed interspike interval, whereas irregular neurons discharge more variably with no definitive peak in the interspike interval histogram. Because there may be some functional division between central vestibular pathways characterized primarily by regular or irregular afferent behavior, we conducted autocorrelation analyses on all DTN AHV cells to detect regular or irregular tonic firing modulation. Of the 33 symmetric and asymmetric AHV cells, we found none with a clearly regular discharge pattern. Figure 5 shows representative autocorrelograms for a symmetric and an asymmetric AHV cell. This finding is not surprising because of (1) the great degree of convergence of both irregular and regular afferents on vestibular nucleus neurons (Highstein et al., 1987), (2) the polysynaptic distance of DTN from any possible input originating in the vestibular periphery, and (3) the putative reliance of velocity storage circuits on primarily irregular afferents (Minor and Goldberg, 1991).

Autocorrelograms from symmetric (A) and asymmetric (B) AHV cells with irregular firing patterns. Both graphs were constructed from head turns of ≤6°/sec, reflecting the tonic resting rate of the cell. For both A and B, the 1 msec bin centered around 0 (−0.5 to +0.5 msec) contains zero spikes; the corresponding empty bins are obscured by the small time scale.
Modulation by head direction
Because of the reciprocal connections between DTN and LMN (Shibata, 1987; Allen and Hopkins, 1989) and the presence of HD cells in LMN (Stackman and Taube, 1998), it was of central interest to determine whether DTN cells were modulated by HD. We found that 5 of 44 cells (11%), 4 symmetric AHV cells and 1 asymmetric AHV cell, were modulated by HD. These five cells had elevated firing rates over a broad range of HDs of ∼200°. Because these HD cells were also strongly modulated by AHV, it was important to eliminate movement and sampling confounds that could create a spurious appearance of HD-related firing. Figure 6 depicts two firing rate by HD functions, one for a symmetric AHV cell that was modulated by HD and one for a symmetric AHV cell that was not modulated by HD. In both cases, each animal spent approximately equal amounts of time moving through all HD bins (dashed lines). In Figure6A, however, there is an increased firing rate from ∼0 to 200°. From this plot, it is evident that the appearance of HD modulation is not the result of the rat spending more or less time pointing its head in this range of HDs.

Firing rate and dwell time as a function of HD.A, B, Each solid line indicates the firing rate, and each dashed line indicates the time spent in each directional bin (in samples that are 1/60th of a second). In neither case is there any relationship between firing rate and dwell time, but in A, firing rate is elevated throughout a wide range of HDs centered on ∼100°.
It is also possible that HD modulation could be attributed to increased frequency of fast head turns in and around the preferred firing direction. However, Figure 7 shows that when firing rate by HD functions are plotted for a cell on the basis of AHV ranges, there is an elevated range of firing between 30 and 160° at both high and low ranges of AHV. Similar results were observed for the other four HD-modulated AHV cells. These results demonstrate that HD-related firing is not an artifact of high-AHV sampling time in the preferred firing direction. It is also noteworthy that the background firing rate outside the directional firing range is slightly higher for fast head turns, suggesting that HD modulation of these cells occurs secondary to AHV sensitivity. Thus, when firing rate versus AHV functions are plotted on the basis of the rat's HD, the curve corresponding to firing within the preferred direction is elevated at all AHVs (slow and fast) compared with the curve corresponding to firing outside the preferred direction (data not shown).

Firing rate as a function of HD in different AHV ranges. Firing rate by HD functions were determined separately for samples obtained during head turns of 0–90, 90–180, or 180–1000°/sec. The firing rate is elevated at high AHVs at all HDs, but by a greater margin in the directional firing range. The firing rate by HD function for head turns between 90 and 180°/sec is omitted for the sake of clarity, but this function was situated approximately between the other two functions.
Although these five cells were modulated by HD, it is important to note that their firing rate versus HD tuning curves are dissimilar in some ways to those recorded from HD cells in other brain areas, including the LMN. Each of the HD-modulated DTN AHV cells had wide directional firing ranges (mean, 241.8 ± 0.92°; range, 240–244°) and low peak firing rates (mean, 7.6 ± 0.62 spikes/sec; range, 6.3–9.2 spikes/sec). For comparison, the means for LMN HD cells are the following: directional firing range, 168.2°; and peak firing rate, 69.5 spikes/sec (Stackman and Taube, 1998).
Head pitch
Within the LMN a small population of cells discharge in relation to the pitch of the animal's head (Stackman and Taube, 1998). Because the DTN projects to the LMN, it was important to determine whether any of the DTN cells were sensitive to the animal's head pitch. Of the 44 cells recorded, the firing of four symmetric AHV cells and of three asymmetric AHV cells was clearly sensitive to head pitch; none of the non-AHV cells was sensitive to head pitch. This finding was consistent with the results in LMN, in which cells sensitive to pitch were often modulated by AHV as well. The left column of Figure8 shows the firing rate by head pitch plots for two DTN AHV cells that were modulated by head pitch. Theright column of Figure 8 shows the firing rate by AHV functions for these two cells. One of the cells (Fig.8B) that was sensitive to head pitch was also sensitive to the rat's directional heading. Because the range of head motion is limited when a rat's head is pitched upward, a rat cannot easily make rapid angular head movements in this position, and high head pitch bins therefore normally contain fewer episodes of high AHV-associated firing. For this reason, an AHV cell that is not modulated by head pitch might be expected to have a negative firing rate by head pitch slope. Thus, increased firing rates at high head pitches cannot be attributed to increased sampling of high AHVs at these head pitches.

Two examples of DTN AHV cells that were also modulated by the animal's head pitch. The left columnshows the firing rate versus head pitch plots. The plots in theright column show the firing rate versus AHV functions for the same cells. A, Symmetric AHV cell.B, Asymmetric AHV cell. Head pitch values >40° are considered free of contamination from negative head pitches. CW and CCW directions are as indicated in Figure 2 for all AHV graphs.
Modulation by linear velocity
Although modulation by AHV was the most prominent feature of AHV cells, they often appeared to be modulated by the animal's linear velocity. The mean correlations between firing rate and linear velocity for symmetric and asymmetric AHV cells were r = 0.28 ± 0.03 (range, 0.03–0.50) and r = 0.21 ± 0.04 (range, 0.05–0.42), respectively. There was a significant difference in the linear velocity correlations between symmetric and asymmetric AHV cells (t = 2.265; df = 20;p < 0.05). Indicative of the strong relationship between cell firing and linear velocity was the fact that 15 of 33 cells had correlations between 0.30 and 0.50. Comparing correlation values between linear velocity and AHV across all AHV cells, we found that there was not a good relationship (r = 0.19). There were no cases in which the correlation for linear velocity exceeded the correlation for AHV. The degree of modulation by linear velocity was moderately correlated with the peak firing rate for symmetric AHV cells (r = 0.49) but did not correlate well for asymmetric AHV cells (r = −0.16).
Comparisons with AHV cells in the LMN
A significant number of AHV cells have also been identified in the LMN (Stackman and Taube, 1998). Because of this finding and the fact that LMN receives extensive projections from the DTN, we compared the firing parameters of LMN and DTN AHV cells. Because the LMN AHV cells of the previous study were analyzed using AHV intervals of 90°, compared with intervals of 6° bins used here, we reanalyzed the LMN AHV cells with the same methods used in the current study. Our previous study in the LMN analyzed 38 AHV cells that were recorded for 8–16 min. By use of the same criteria for classifying these cells as the DTN AHV cells, eight LMN cells were excluded from further analyses because their firing rate–AHV functions were judged to be too weak to be classified as an AHV cell. One of these cells is depicted in Figure9C. Although these excluded cells were classified as AHV cells in our previous study, their weak correlations to AHV using the smaller 6° bin resolution indicate that factors other than AHV must be contributing a larger role to their discharge. Furthermore, there was a class of “slow” AHV cells for which firing rate was negatively correlated with AHV in either head turn direction; these cells were excluded from the present comparison because we found no such cells in the DTN.

LMN AHV cells. Firing rate versus AHV plots for different types of AHV cells in LMN are shown. A, Symmetric. B, Asymmetric. C, Example of a cell that was considered previously to be modulated by AHV (Stackman and Taube, 1998) but that was excluded from the present analysis because its modulation was considered too weak. CW and CCW directions are as indicated in A for all graphs.
The remaining 21 LMN cells were compared with our population of DTN AHV cells. Figure 9A–C depicts three representative LMN AHV cells plotted with 6° AHV bins. LMN cells referred to as “fast” AHV cells in our previous study could be reclassified as symmetric (n = 13) or asymmetric (n = 8) AHV cells. The baseline firing rate, the peak firing rate, the strength and slope of the firing rate–AHV relationship, and the correlation strength to linear velocity were analyzed for each LMN AHV cell, and Table 1 shows the results compared with DTN AHV cells. Because LMN AHV cells were recorded for 16 min at most, we used only the first 16 min of all DTN cell sessions for this comparison. In general, DTN and LMN AHV cells had similar values for most parameters (correlation and slope of the firing rate by AHV plot, firing rate vs linear velocity correlation, baseline firing rate, and peak firing rate), but there were some significant differences between symmetric AHV cells in the LMN and DTN; symmetric AHV cells in the DTN had significantly steeper slopes than did those in the LMN (t = −2.18; df = 29; p < 0.05) and were significantly more correlated with linear velocity (t = −2.20; df = 20; p < 0.05). In addition, LMN asymmetric cells had higher baseline firing rates than did those in the DTN (t = 2.31; df = 8;p < 0.05).
Firing parameters of DTN and LMN AHV cells
DISCUSSION
We found that the firing of the majority of cells in DTN was strongly modulated by AHV and in many cases was also modulated by linear velocity, HD, or head pitch. AHV cell firing could be either independent of the direction of head turn or direction dependent. We found no evidence of the presence of HD cells similar to those recorded in LMN and other limbic system areas. Although a few AHV cells were modulated by HD (Fig. 6), their properties were different from those reported for LMN HD cells. For example, the DTN tuning curves were broader (higher directional firing range) and had lower peak firing rates than did HD cell tuning curves from LMN (Stackman and Taube, 1998). This finding suggests that the processing that occurs between the DTN and LMN is critical for generating the HD signal in LMN.
The HD signal can only be useful if it is continually updated with respect to direction as the head is moved. However, the signal must be maintained in the absence of movement as well, and it is not clear whether separate steps or different mechanisms underlie these processes. Theoretically, starting with a known head position in the horizontal plane, a representation of HD can be continually updated over time from the second integral of angular head acceleration. After one integration at the level of the vestibular hair cells, the activity of neurons in the vestibular nucleus encodes AHV. Empirically, lesions of the vestibular labyrinth abolish the HD cell signal in the ADN (Stackman and Taube, 1997), indicating that the vestibular system is a critical source of information for the HD system. It is therefore important to establish how vestibular signals are conveyed to the HD system to enable generation of the directional signal. Although HD cells have been identified in a number of areas, previous experiments have indicated that the signal originates in the LMN and is projected in sequence to the ADN and postsubiculum (Goodridge and Taube, 1997;Tullman and Taube, 1998; Blair et al., 1999). The principal input to LMN originates in the DTN (Shibata, 1987; Allen and Hopkins, 1989), to which the medial vestibular nucleus projects indirectly via the nPH (Belknap and McCrea, 1988). Figure 10provides a summary of the principal connections involving the HD cell network and the vestibular system. Because of this anatomy, AHV information appears to be projected rostrally to the DTN.

Summary of the connections between different brain areas involved in the HD cell network and model of how DTN symmetric and asymmetric AHV cells may be connected to generate and update the LMN HD cell signal. The example shown is for the left hemisphere and a CW head turn. The connectivity in the right hemisphere would be similar, except that the right DTN would contain mostly CCW asymmetric AHV cells. Shaded areas process primarily AHV information; unshaded areas process primarily HD information. HD units depict directional “modules” of cell groups; each unit signals different directional headings. Tonic excitation of HD cells when the head is not moving may be the result of HD feedback from the postsubiculum, intrinsic membrane properties, or still undiscovered excitatory projections into LMN. Lateral inhibition of HD cells outside the current directional heading is accomplished via tonic firing from inhibitory DTN AHV cells that are modulated by HD (Fig. 6) and perhaps similarly via LMN AHV cells. An HD cell signaling the current heading could further enhance lateral inhibition by suppressing tonic inhibition of itself via inhibitory interneurons in the DTN (shown by the asterisk). During a CW head turn, excitatory projections from nPH outweigh feedback inhibition on AHV cells in the DTN. The burst of activity in CW asymmetric AHV cells in the DTN (which are more abundant in the left hemisphere) forces the HD activity hill CW. The HD cell on the CW side of the activity hill is disinhibited because of asymmetric, offset connectivity, in which an HD cell tuned to 0° is inhibited by a CW asymmetric AHV cell tuned to −10°. Projections from the contralateral DTN (data not shown) may play a role in offsetting this asymmetry, because LMN HD cells fire in both head turn directions. They may also augment or take the place of type I afferents from nPH. During CCW head turns, asymmetric AHV cells in the right hemisphere that have a CCW preferred turn direction (data not shown) initiate the shift of the activity hill.ASYM, Asymmetric; HD, head direction cell;SYMM, symmetric.
Exactly how the nervous system performs the mathematical operation of an integration is not clear. The best-studied example involves the VOR which keeps the retina focused on a target during a head turn. Investigators have postulated that the nPH is involved in the second integration (Baker, 1977). However, because our results demonstrate that DTN neurons encode AHV information, the second integration for the HD signal network must occur after the DTN. Within the LMN there are cells with several identified firing correlates, including HD cells, symmetric, asymmetric, and negative AHV cells, and head pitch cells (Stackman and Taube, 1998). Which cell types DTN AHV cells contact within the LMN is not known. However, because of the prominent reciprocal connections between the LMN and DTN (Hayakawa and Zyo, 1990) and between the DTN and nPH (Liu et al., 1984), it is possible that the neural integration of AHV to angular head displacement arises from the interaction between these three nuclei. The DTN is, in fact, characterized by reciprocal patterns of connections with the LMN, nPH, interpeduncular nucleus (Groenewegen et al., 1986), and medial habenular nucleus (Groenewegen and Wouterlood, 1988). Perhaps the connections from the vestibular nuclei→nPH→DTN→LMN, and possibly involving these other structures, form a series of leaky neural integrators that culminates in an accurate integration of AHV in the LMN. Such a process could account for the finding that vestibular lesions disrupt direction-specific firing in HD cells and that neither internal circuitry within the LMN nor external inputs from the postsubiculum (Allen and Hopkins, 1989) are solely sufficient for generating the signal.
Cells in the vestibular nuclei that signal AHV are categorized as type I cells, which respond with increased firing to stimulation from the ipsilateral vestibular nerve, or type II cells, which respond with increased firing to stimulation from the contralateral vestibular nerve (Leigh and Zee, 1999). This distinction is preserved in the nPH, although it contains a predominance of type II neurons (Lannou et al., 1984). If the nPH is a significant source of input to the DTN, then we might expect the activity of DTN neurons to be related to contralateral head turns, as predicted by Blair et al. (1998). The DTN→LMN projection is GABAergic and is thought to be inhibitory (Allen and Hopkins, 1989; Wirtshafter and Stratford, 1993). Thus, if the nPH→DTN projection is excitatory, the activity of type II neurons in the nPH contralateral to the head turn direction would lead to disinhibition of ipsilateral LMN cells during head turns to the ipsilateral side. There is evidence of both cholinergic (excitatory) (McElligot and Spencer, 1998) and GABAergic (inhibitory) (Ennis and Aston-Jones, 1989) neurons within the nPH. Thus, it will be important to determine whether the nPH→DTN pathway is inhibitory or excitatory.
Network models
Several neural models have been proposed that use continuous attractor networks to explain how the HD cell signal is generated and maintained (Skaggs et al., 1995; Blair, 1996; Redish et al., 1996;Zhang, 1996). A theme common to each is that a self-stabilized “hill” of activity representing HD arises via connectivity within the network (whether contained in one brain structure or distributed between several), which is then moved around by external inputs after a head turn. Vestibular lesions would be expected to affect primarily the mechanism for shifting the activity hill rather than the mechanism for producing or stabilizing it. A perturbation of the network that affects the shift mechanism but not the attractor connectivity would seem to predict one of two alternate scenarios. If the shift mechanism is disrupted such that the activity hill remains stationary and is unable to move, then some population of HD cells should remain tonically active and discharge continuously (those within the activity hill), whereas other HD cells should remain silent. Alternatively, if the shift mechanism becomes disrupted such that there is no mechanism to keep the activity hill stationary and it constantly moves around, then HD cells should show bursty activity, in which cells would burst as the activity hill passed through the network without corresponding to the rat's HD. Importantly, neither of these possibilities were observed in the vestibular-lesioned animals; none of the recorded HD cells remained tonically active, and although bursty activity was present in vestibular-lesioned animals, it did not appear to originate from HD cells (Stackman and Taube, 1997). These results appear to be more consistent with a scenario in which no activity hill persists at all after a labyrinthectomy, but it is not clear how previous attractor models would accommodate such an outcome without requiring some external source of input to generate and stabilize the activity hill. More recently, Blair et al. (1998) proposed a model in which the inhibitory input from DTN to LMN serves as a remote source of lateral inhibition among LMN HD cells, thereby placing the attractor connectivity across these two structures. It may be significant, then, that the vestibular lesion data were recorded from the ADN and thus not from neurons within the purported area of attractor connectivity. It is possible that one of the above predicted scenarios is exactly what occurs within the attractor network but is not reflected at the next step in processing in the ADN.
Network models of neural integration have typically used positive feedback mechanisms to accomplish the process. Because what needs to be integrated is the modulation of the signal and not the tonic background rate, most models use lateral inhibition whereby cells inhibit neighboring cells and are in turn inhibited by them, with the net effect being positive feedback (Cannon et al., 1983). Frequently, neural integration models require more than one circuit because individual circuits are leaky integrators. For example, in the horizontal VOR more than one integration occurs between vestibular afferents and the ocular motoneurons (Skavenski and Robinson, 1973). The continual presence and integration of the angular velocity signal in the VOR pathways are referred to as the velocity storage mechanism (Raphan et al., 1979), and evidence suggests that there are separate anatomical pathways for the velocity storage mechanism and the neural integrator (Leigh and Zee, 1999). The VOR pathways, then, may be analogous in some ways to the HD system, in which the presence of AHV cells in the nPH, DTN, and LMN and the reciprocal connections between these nuclei are evidence of a velocity storage mechanism. As mentioned above, perhaps these pathways form a series of leaky integrators that culminates in a head position signal in the LMN.
Any accurate network model for HD cells must be able to account for two properties observed with DTN AHV cells. First, there are both symmetric and asymmetric firing patterns. Previous models posit only turn direction-dependent inhibition during head turns. Therefore, a role must be found for turn direction-independent firing. Second, many AHV cells showed a high degree of modulation at relatively low AHVs that did not persist through high AHVs. Ultimately, any model must be able to account for the nonlinearity of DTN AHV cell-firing functions.
A proposal that may help account for both properties is that there is a functional difference between symmetric and asymmetric AHV cells. Figure 10 presents a hypothetical model for this separation of roles. In general, symmetric cells may serve to sustain the hill and aid in moving it within the attractor network, whereas asymmetric cells give direction to that movement. Because attractor networks feature self-stabilizing systems of feedforward inhibition, there is first the problem of overcoming the current stable state when updating is required. A burst of direction-independent inhibitory input from DTN AHV cells onto the HD cells encoding the currently faced direction at the beginning of a head turn could overcome the inertia of the network. The activity hill would be moved in the appropriate direction by asymmetric inhibition from DTN asymmetric AHV cells. These asymmetric AHV cells are also modulated by HD and are similar to the cells depicted in Figure 6. Note that these AHV cells are tuned to HDs that are offset in a CW direction from the LMN HD cells with which they connect. Series of offset connections have been used in other models to achieve an asymmetric pattern of activation (Blair, 1996; Redish et al., 1996; Goodridge and Touretzky, 2000). If asymmetric AHV cells in one hemisphere predominantly encode head turns to the contralateral direction, then this would also account for the finding that the firing rate for LMN HD cells is higher during head turns ipsilateral to the recording hemisphere (Stackman and Taube, 1998), because they would be subject to less inhibition from the asymmetric AHV cells contacting them. When a head movement is initiated, DTN AHV cells move quickly from their baseline firing rate to a point closer to their peak rate (Figs. 2B,C, 4A). This pattern of firing would enable a burst of inhibitory activity to dislodge the stable hill of network activity at the initiation of a head turn and allow for finer AHV coding as the head (and activity hill) slows down and comes to rest in a new position.
It is important to note, however, that many aspects of this hypothetical model have yet to be demonstrated. For instance, this model relies on HD modulation of AHV cell firing to prevent the system from freezing in a permanently stable state from a network-wide symmetry of inhibition. However, the majority of AHV cells that we recorded in the DTN were not sensitive to HD, suggesting that if the model is correct, a small minority of AHV cells are responsible for providing this critical asymmetry. Furthermore, HD cells may contribute to lateral inhibition via positive feedback on themselves via inhibitory interneurons in the DTN (indicated by an asteriskin Fig. 10). Such interneurons would presumably have the appearance of “standard” HD cells like those found in the LMN; yet in all cases in which we found cells to be modulated by HD in DTN, they were also modulated by AHV (cf. Sharp and Cho, 2000). In addition, there are both symmetric and asymmetric AHV cells within the LMN, but it is not known whether the projections from LMN back to DTN are from LMN HD cells or LMN AHV cells. Similarly, the spatial correlates of the cell type in the postsubiculum that projects to LMN are unknown, as well as the type of cell (HD or AHV) on which this projection terminates. If HD cells in the postsubiculum contact AHV cells in the LMN, we might speculate a parallel computational role for LMN HD cell projections onto DTN AHV cells. Finally, the origin of AHV activity in the DTN is unknown. nPH is believed to contain primarily type II cells, but symmetric AHV firing necessarily requires input from vestibular organs on both sides. It is possible that projections from the contralateral DTN satisfy this requirement (Liu et al., 1984). As with all the previously proposed attractor models, our network model is vulnerable to the problem presented by the vestibular lesion data. In accounting for this finding, it is possible that destruction of the vestibular apparatus changes the firing pattern of neurons in the vestibular nuclei and nPH, which in turn prevent the formation of an activity hill in the DTN↔LMN circuit. However, it is unlikely that nPH activity is abolished after bilateral labyrinthectomy because spontaneous activity recovers in central vestibular neurons after bilateral vestibular nerve transection (Waespe et al., 1992). Taken together, these findings suggest an important role for nPH in the generation of HD cell activity that may rely on its proposed capacity for velocity storage. As empirical findings continue to provide details of the HD cell circuitry, it will be important for quantitative simulations to evaluate the functional validity of the models, including whether removal of external inputs into the attractor network can replicate the labyrinthectomy findings.
Summary
In conclusion, the majority of DTN cells discharge in relation to AHV and are also modulated by linear velocity and, in a few cases, by HD or head pitch. In accounting for these complex correlates, the contribution of the nPH to DTN firing will be a significant consideration. Gaze maintenance and the vestibulo-ocular reflexes depend on the nPH, and both functions are affected by linear movement and fixation distance. HD cells were originally identified in the postsubiculum of the hippocampal formation (Ranck, 1984; Taube et al., 1990a), and as we have moved caudally in tracking the generation of the HD signal, shared circuitry between the HD cell system and those that control gaze stabilization has become more evident. Because visual spatial information concerning landmark cues has a demonstrable influence on HD cell signals (Taube et al., 1990b), it may be instructive to consider mechanisms involved in gaze stabilization in maintaining an updated HD signal.
Note added in proof. Sharp et al. (2001) have recently published results from single-unit recording in DTN. Their findings are comparable, although not identical, with those reported here. The major difference was that they reported only asymmetric AHV cells in the DTN, whereas we identified both asymmetric and symmetric AHV cells.
Footnotes
This work was supported by National Institute of Mental Health Grants MH48924 and MH01286 and by a grant from the National Aeronautics and Space Administration National Space Biomedical Research Institute to J.S.T. We thank Robert Stackman for contributing the data from LMN cells, Jeffrey Calton, Gary Muir, George Wolford, and Larry Young for helpful discussions concerning these experiments, and Jennifer Marcroft for technical assistance.
A preliminary report of this research was presented at the 30th Annual Society for Neuroscience meeting (New Orleans, LA; Nov. 4–9, 2000).
Correspondence should be addressed to Dr. Jeffrey S. Taube, Dartmouth College, Department of Psychological and Brain Sciences, 6207 Moore Hall, Hanover, NH 03755. E-mail: jeffrey.taube{at}dartmouth.edu.


