
Main menu

  • HOME
  • CONTENT
    • Early Release
    • Featured
    • Current Issue
    • Issue Archive
    • Collections
    • Podcast
  • ALERTS
  • FOR AUTHORS
    • Information for Authors
    • Fees
    • Journal Clubs
    • eLetters
    • Submit
  • EDITORIAL BOARD
  • ABOUT
    • Overview
    • Advertise
    • For the Media
    • Rights and Permissions
    • Privacy Policy
    • Feedback
  • SUBSCRIBE

User menu

  • Log in
  • My Cart

Search

  • Advanced search
Journal of Neuroscience
  • Log in
  • My Cart
Journal of Neuroscience

Advanced Search

Submit a Manuscript
  • HOME
  • CONTENT
    • Early Release
    • Featured
    • Current Issue
    • Issue Archive
    • Collections
    • Podcast
  • ALERTS
  • FOR AUTHORS
    • Information for Authors
    • Fees
    • Journal Clubs
    • eLetters
    • Submit
  • EDITORIAL BOARD
  • ABOUT
    • Overview
    • Advertise
    • For the Media
    • Rights and Permissions
    • Privacy Policy
    • Feedback
  • SUBSCRIBE
PreviousNext
ARTICLE, Behavioral/Systems

Action Spectrum for Melatonin Regulation in Humans: Evidence for a Novel Circadian Photoreceptor

George C. Brainard, John P. Hanifin, Jeffrey M. Greeson, Brenda Byrne, Gena Glickman, Edward Gerner and Mark D. Rollag
Journal of Neuroscience 15 August 2001, 21 (16) 6405-6412; DOI: https://doi.org/10.1523/JNEUROSCI.21-16-06405.2001
George C. Brainard
1Department of Neurology, Thomas Jefferson University, Philadelphia, Pennsylvania 19107, and
  • Find this author on Google Scholar
  • Find this author on PubMed
  • Search for this author on this site
John P. Hanifin
1Department of Neurology, Thomas Jefferson University, Philadelphia, Pennsylvania 19107, and
  • Find this author on Google Scholar
  • Find this author on PubMed
  • Search for this author on this site
Jeffrey M. Greeson
1Department of Neurology, Thomas Jefferson University, Philadelphia, Pennsylvania 19107, and
  • Find this author on Google Scholar
  • Find this author on PubMed
  • Search for this author on this site
Brenda Byrne
1Department of Neurology, Thomas Jefferson University, Philadelphia, Pennsylvania 19107, and
  • Find this author on Google Scholar
  • Find this author on PubMed
  • Search for this author on this site
Gena Glickman
1Department of Neurology, Thomas Jefferson University, Philadelphia, Pennsylvania 19107, and
  • Find this author on Google Scholar
  • Find this author on PubMed
  • Search for this author on this site
Edward Gerner
1Department of Neurology, Thomas Jefferson University, Philadelphia, Pennsylvania 19107, and
  • Find this author on Google Scholar
  • Find this author on PubMed
  • Search for this author on this site
Mark D. Rollag
2Department of Anatomy, Physiology and Genetics, Uniformed Services University of Health Sciences, Bethesda, Maryland 20814
  • Find this author on Google Scholar
  • Find this author on PubMed
  • Search for this author on this site
  • Article
  • Figures & Data
  • Info & Metrics
  • eLetters
  • PDF
Loading

Article Figures & Data

Figures

  • Fig. 1.
    • Download figure
    • Open in new tab
    • Download powerpoint
    Fig. 1.

    This diagram illustrates the experimental electronic, optic, and ganzfeld dome exposure array. This apparatus provides a uniform, patternless stimulus that encompasses the subject's entire visual field. For clarity, the subject's head is shown slightly withdrawn from the opening of the ganzfeld dome. During all light exposures, the subjects' bony orbits are completely enclosed in the dome walls, providing complete exposure of their visual fields.

  • Fig. 2.
    • Download figure
    • Open in new tab
    • Download powerpoint
    Fig. 2.

    In the top two graphs, thebars represent group mean + SEM values of plasma melatonin relative to 460 nm monochromatic light exposure at different irradiances in one group of eight healthy subjects. Thetop shows plasma melatonin values before and after light exposure. There were no significant differences (F= 0.70; p = 0.69) across preexposure mean melatonin values. Light irradiances at or above 3.1 μW/cm2elicited significant melatonin suppression. The middleillustrates the subjects' plasma melatonin percent control-adjusted change scores. Progressively higher irradiance exposures at 460 nm produce progressively greater plasma melatonin percent control-adjusted change scores (p < 0.0001). Thebottom demonstrates the best-fit fluence–response curve for 460 nm exposures and percent control-adjusted melatonin suppression (R2 = 0.97). Each data point represents one group mean ± SEM.
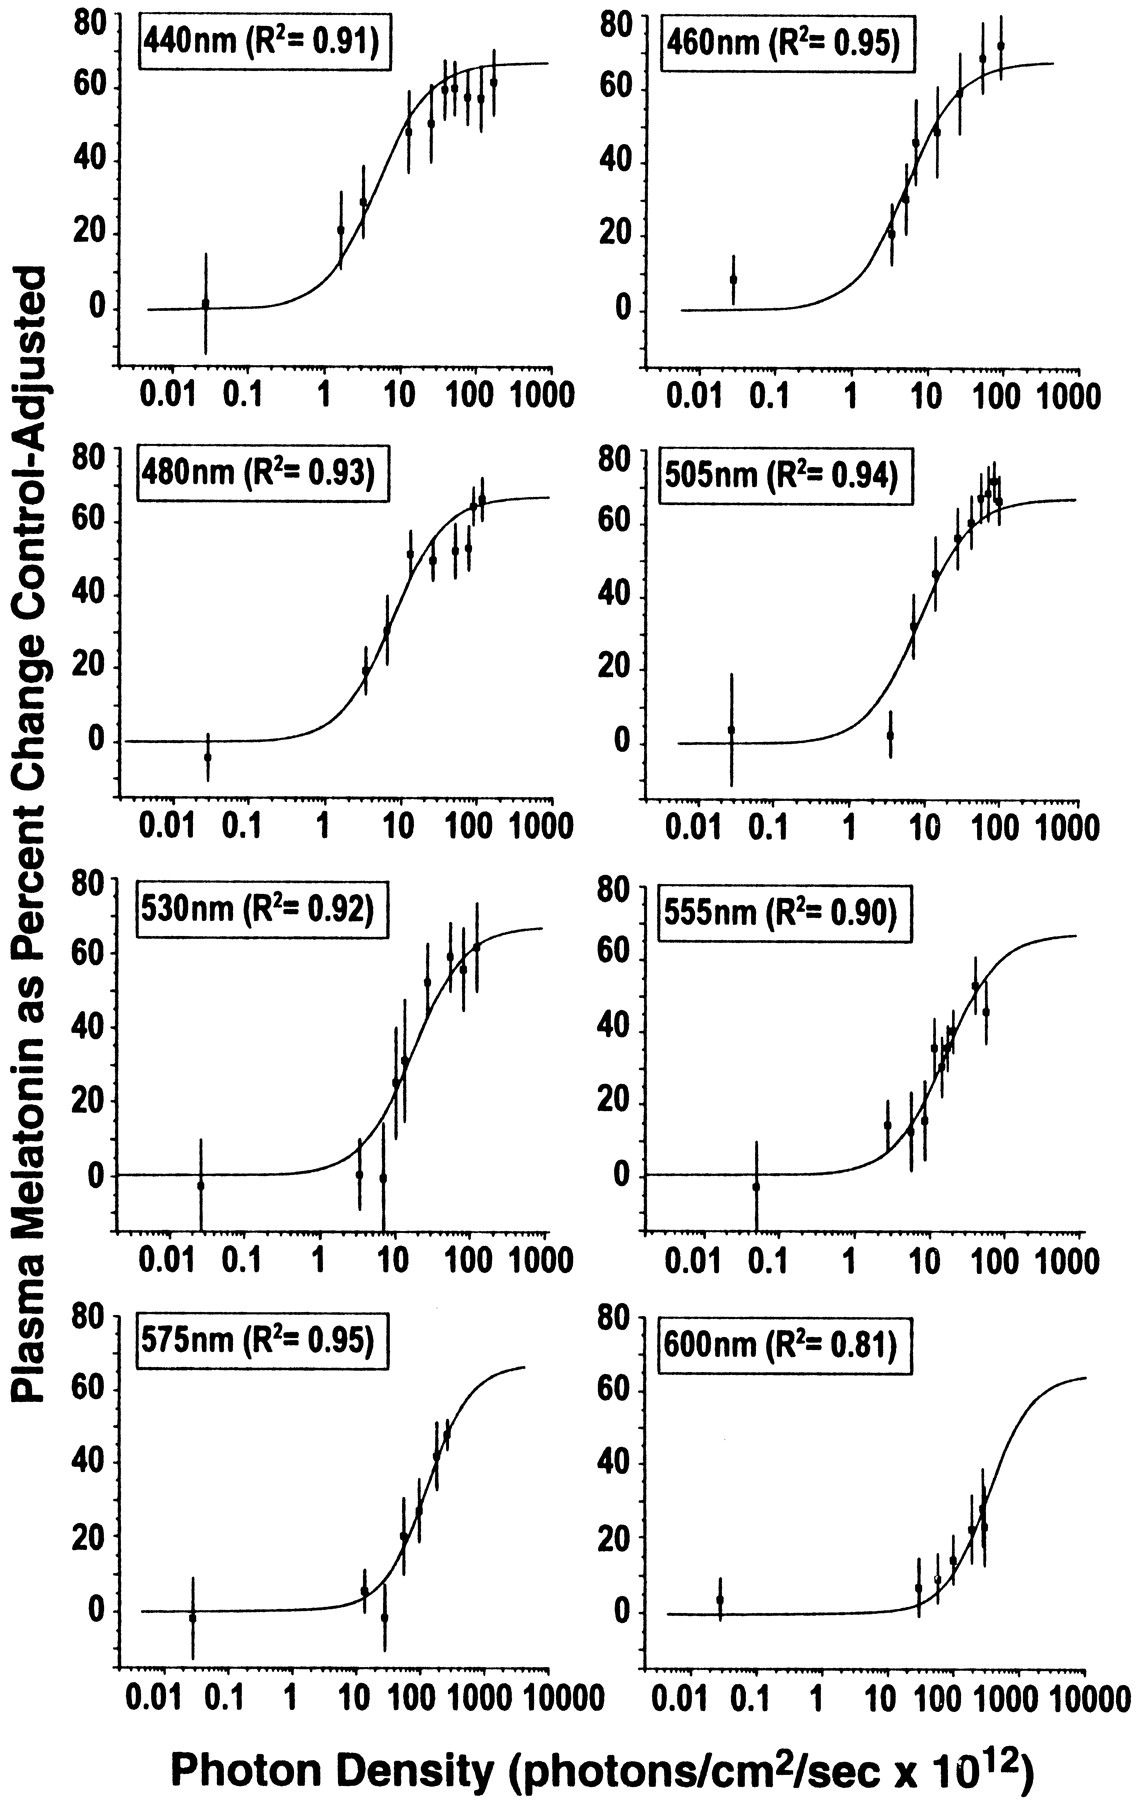
  • Fig. 3.
    • Download figure
    • Open in new tab
    • Download powerpoint
    Fig. 3.

    This figure illustrates the fitted univariant fluence–response curves for monochromatic light exposures and percent control-adjusted melatonin suppression for eight wavelengths of visible light. Each fluence–response curve is derived from eight healthy volunteers who participated in a complete, within-subjects experimental design. In each graph, the data points represent group means ± SEM. Each curve has a high coefficient of correlation (0.95–0.81).

  • Fig. 4.
    • Download figure
    • Open in new tab
    • Download powerpoint
    Fig. 4.

    In this graph, the bars represent group mean ± SEM plasma melatonin values before and after exposure to 31.8 μW/cm2 monochromatic light at 420 nm in eight healthy subjects. This light irradiance induced a significant melatonin suppression (p < 0.003).

  • Fig. 5.
    • Download figure
    • Open in new tab
    • Download powerpoint
    Fig. 5.

    This graph demonstrates the action spectrum for percent control-adjusted melatonin suppression in 72 healthy human subjects. The filled circles represent the half-saturation constants of eight wavelengths from 440 to 600 nm that were normalized to the maximum response and plotted as log relative sensitivity. The open circle represents the estimated half-saturation constant derived from the 420 nm data. The solid curve portrays the best-fit template for vitamin A1 retinaldehyde photopigments, which predicts a maximal spectral absorbance (λmax) of 464 nm (Partridge and De Grip, 1991). There is a high coefficient of correlation for fitting this opsin template to the melatonin suppression data (R2 = 0.91).

  • Fig. 6.
    • Download figure
    • Open in new tab
    • Download powerpoint
    Fig. 6.

    This figure illustrates a comparison of the melatonin suppression and visual action spectra. The maximal spectral response and long wavelength limb of the melatonin suppression template is plotted along with the maximal spectral response and long wavelength limbs of the human rods and cones that support vision (Stockman and Sharpe, 1999). The shaded area around the 464 nm template represents ±SD from the data presented above.

Back to top

In this issue

The Journal of Neuroscience: 21 (16)
Journal of Neuroscience
Vol. 21, Issue 16
15 Aug 2001
  • Table of Contents
  • Index by author
Email

Thank you for sharing this Journal of Neuroscience article.

NOTE: We request your email address only to inform the recipient that it was you who recommended this article, and that it is not junk mail. We do not retain these email addresses.

Enter multiple addresses on separate lines or separate them with commas.
Action Spectrum for Melatonin Regulation in Humans: Evidence for a Novel Circadian Photoreceptor
(Your Name) has forwarded a page to you from Journal of Neuroscience
(Your Name) thought you would be interested in this article in Journal of Neuroscience.
CAPTCHA
This question is for testing whether or not you are a human visitor and to prevent automated spam submissions.
Print
View Full Page PDF
Citation Tools
Action Spectrum for Melatonin Regulation in Humans: Evidence for a Novel Circadian Photoreceptor
George C. Brainard, John P. Hanifin, Jeffrey M. Greeson, Brenda Byrne, Gena Glickman, Edward Gerner, Mark D. Rollag
Journal of Neuroscience 15 August 2001, 21 (16) 6405-6412; DOI: 10.1523/JNEUROSCI.21-16-06405.2001

Citation Manager Formats

  • BibTeX
  • Bookends
  • EasyBib
  • EndNote (tagged)
  • EndNote 8 (xml)
  • Medlars
  • Mendeley
  • Papers
  • RefWorks Tagged
  • Ref Manager
  • RIS
  • Zotero
Respond to this article
Request Permissions
Share
Action Spectrum for Melatonin Regulation in Humans: Evidence for a Novel Circadian Photoreceptor
George C. Brainard, John P. Hanifin, Jeffrey M. Greeson, Brenda Byrne, Gena Glickman, Edward Gerner, Mark D. Rollag
Journal of Neuroscience 15 August 2001, 21 (16) 6405-6412; DOI: 10.1523/JNEUROSCI.21-16-06405.2001
del.icio.us logo Digg logo Reddit logo Twitter logo CiteULike logo Facebook logo Google logo Mendeley logo
  • Tweet Widget
  • Facebook Like
  • Google Plus One

Jump to section

  • Article
    • Abstract
    • MATERIALS AND METHODS
    • RESULTS
    • DISCUSSION
    • Footnotes
    • REFERENCES
  • Figures & Data
  • Info & Metrics
  • eLetters
  • PDF

Keywords

  • melatonin
  • action spectrum
  • circadian
  • wavelength
  • light
  • pineal gland
  • neuroendocrine
  • photoreception
  • photopigment
  • human

Responses to this article

Respond to this article

Jump to comment:

  • Developing the family of curves for the Human Melatonin Action Spectrum
    Alan C. Haungs
    Published on: 10 December 2015
  • Published on: (10 December 2015)
    Page navigation anchor for Developing the family of curves for the Human Melatonin Action Spectrum
    Developing the family of curves for the Human Melatonin Action Spectrum
    • Alan C. Haungs, Inventor Owner

    The original experiment for plotting the melatonin action spectrum involved instantaneous purified wavelengths.

    This is not typical light that enters the eye.

    I suggest superimposing white light on top of each purified wavelength and develop the family of curves as purified colors will likely have the left most peak action wavelength, but purified color + increasing amounts of white will move the peak ac...

    Show More

    The original experiment for plotting the melatonin action spectrum involved instantaneous purified wavelengths.

    This is not typical light that enters the eye.

    I suggest superimposing white light on top of each purified wavelength and develop the family of curves as purified colors will likely have the left most peak action wavelength, but purified color + increasing amounts of white will move the peak action wavelength to the right, due to how the L and M cones constructively enhance the ipRGC signal during day- light adaptation.

    I would also hope to see such a family of curves for values of intensity that fit under the night-adaptation category.

    Such a family of curves would have utility from a circadian driver point of view when incorporating white light into the human living space, to defeat morning/mid-day SAD issues or evening circadian disruption issues.

    Conflict of Interest:

    I am an electrical engineer working on solutions to circadian disruption

    Show Less
    Competing Interests: None declared.

Related Articles

Cited By...

More in this TOC Section

ARTICLE

  • Scaffolding of Fyn Kinase to the NMDA Receptor Determines Brain Region Sensitivity to Ethanol
  • Cytoskeletal and Morphological Alterations Underlying Axonal Sprouting after Localized Transection of Cortical Neuron AxonsIn Vitro
  • Aberrant Chloride Transport Contributes to Anoxic/Ischemic White Matter Injury
Show more ARTICLE

Behavioral/Systems

  • The Role of Rat Medial Frontal Cortex in Effort-Based Decision Making
  • Isolation of Relevant Visual Features from Random Stimuli for Cortical Complex Cells
  • Endogenous Activation of Serotonin-2A Receptors Is Required for Respiratory Rhythm Generation In Vitro
Show more Behavioral/Systems
  • Home
  • Alerts
  • Visit Society for Neuroscience on Facebook
  • Follow Society for Neuroscience on Twitter
  • Follow Society for Neuroscience on LinkedIn
  • Visit Society for Neuroscience on Youtube
  • Follow our RSS feeds

Content

  • Early Release
  • Current Issue
  • Issue Archive
  • Collections

Information

  • For Authors
  • For Advertisers
  • For the Media
  • For Subscribers

About

  • About the Journal
  • Editorial Board
  • Privacy Policy
  • Contact
(JNeurosci logo)
(SfN logo)

Copyright © 2023 by the Society for Neuroscience.
JNeurosci Online ISSN: 1529-2401

The ideas and opinions expressed in JNeurosci do not necessarily reflect those of SfN or the JNeurosci Editorial Board. Publication of an advertisement or other product mention in JNeurosci should not be construed as an endorsement of the manufacturer’s claims. SfN does not assume any responsibility for any injury and/or damage to persons or property arising from or related to any use of any material contained in JNeurosci.