

Article Figures & Data
Figures
- Fig. 1.
Data obtained from an E11 embryo illustrating the de-trending procedure. A, Graph of inter-episode interval; C, episode duration for each episode. The smoothed intervals and durations are superimposed. In this particular experiment, episode durations and inter-episode intervals increased and then decreased together, which would create a positive correlation between interval and duration. B, De-trended data, that is, subtraction of the smoothed data from the raw data (plus addition of the mean of the raw data) for the inter-episode intervals;D, episode durations.
- Fig. 2.
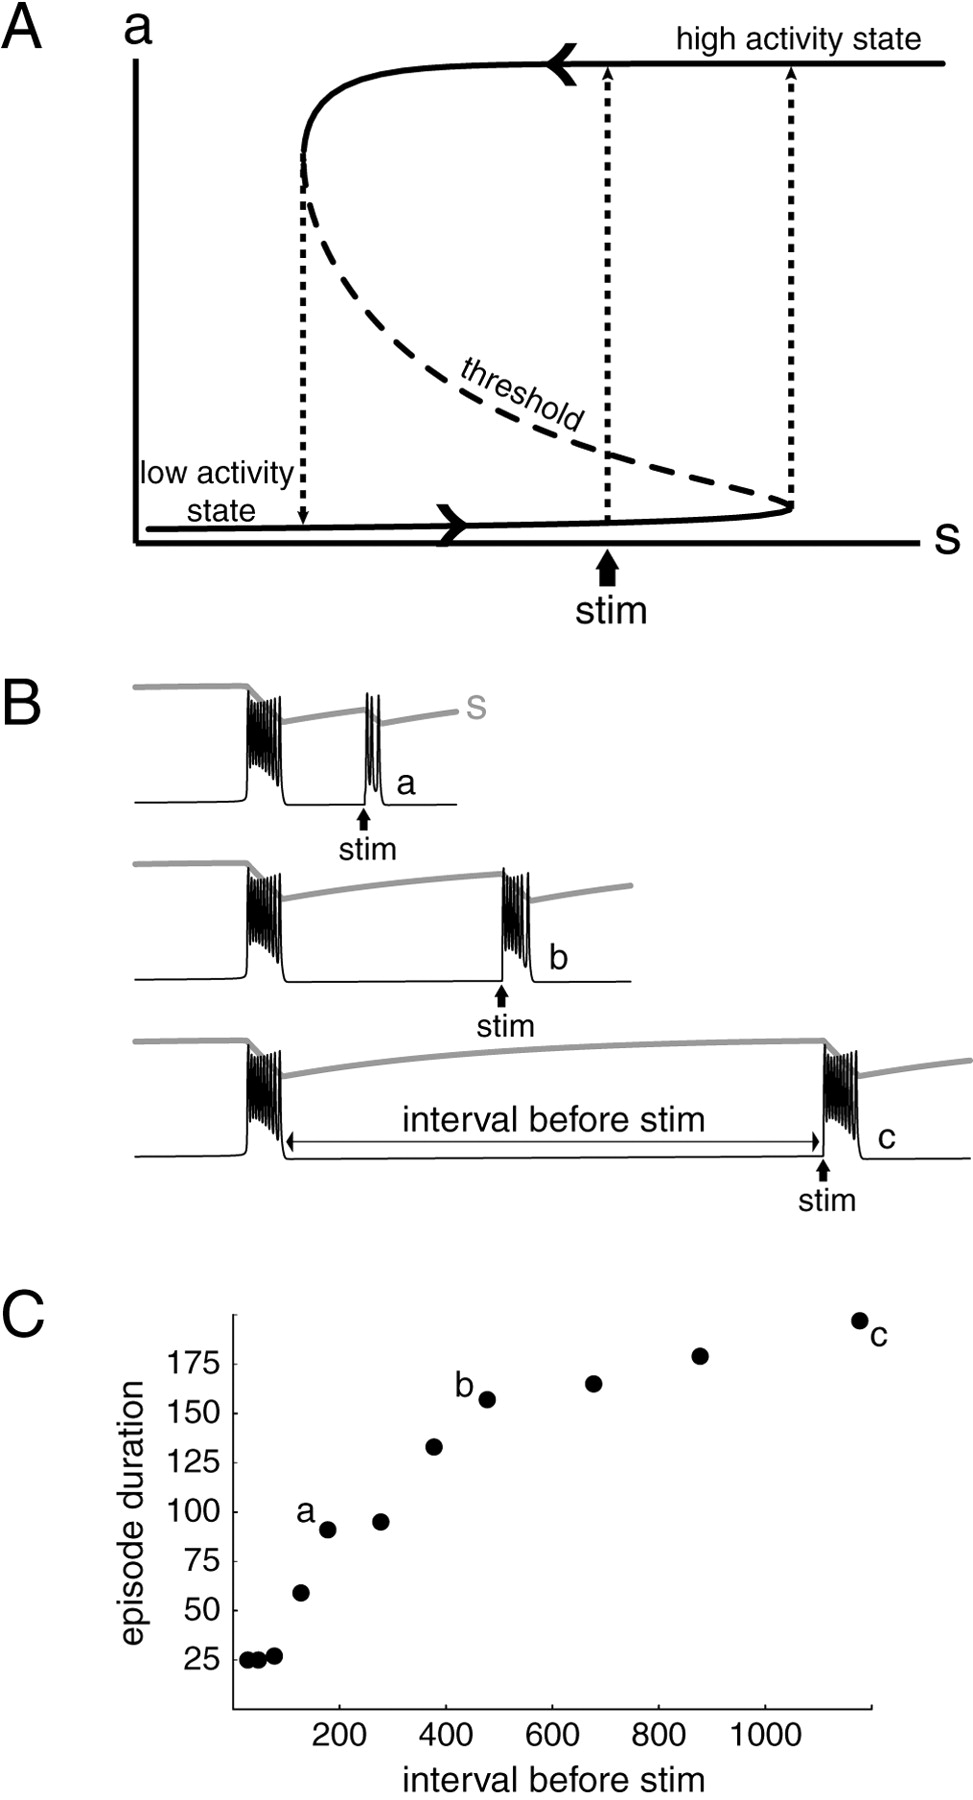
Conceptual framework underlying the design of experiments. A, Phase plane, or state diagram for a recurrent excitatory network, showing the possible values of activity (a) as the relative measure of network excitability (s) varies. For a range ofs values (marked by the dotted vertical lines on the inflection points), the system can be in either of two states, active (high activity state) or silent (low activity state); the middle curve,dashed, is a third but unstable state that represents a functional threshold between the two stable states. When the system is in the high activity state, s decreases (left-pointing arrowhead) until it is too low for the high activity state to be sustained. It then falls down to the low activity state and recovers (right-pointing arrowhead). When s reaches the value for which the low activity state coincides with threshold, a new episode begins. Before this value is reached, a stimulus (stim) or transient that brings the activity above threshold can trigger an episode. For simplicity, the oscillatory cycles that take place during an episode are not represented. B, Time course of activity (black) and network excitability (gray) corresponding to the phase plane trajectory shown in A, for different time intervals between an episode and an externally applied stimulus (stim). In this example we illustrate the cyclic oscillations during an episode. C, Episode duration is plotted as a function of the time interval between the preceding episode and the time of stimulation; a–crepresent the traces shown in B. Note that for the smallest intervals, episode duration does not increase with interval, because the evoked episodes have only one cycle.
- Fig. 3.
A, Spontaneous episodes followed by episodes evoked by an external stimulus applied at different times. The arrows mark the time of the stimulus. B, Episode duration is plotted against the preceding interval (time between the stimulus and an end of the spontaneous episode) for an E10 embryo. Black dotsindicate evoked episodes; gray dots indicate spontaneously occurring episodes. The black curve is an exponential fit with time constant τ = 81 ± 16 sec. All points (evoked and spontaneous) were used for the fit. Points markeda–c are from the episodes shown inA. C, In the same preparation as shown inB, the VLF was stimulated once per minute during the inter-episode interval, and the evoked ventral root potentials were recorded. The plot illustrates the amplitude of the normalized ventral root potentials (mean ± SEM; averaged using 7 inter-episode intervals) during the time elapsed after an episode. The black curve is an exponential fit of the data asymptotically reaching 1 with time constant τ = 107 ± 45 sec. This is comparable with the time constant obtained from episode durations shown inB. D, Comparison between episode duration and median cycle frequency for another E10 embryo. Median cycle frequency is plotted against episode duration for stimulated (black dots) and spontaneous (gray dots) episodes. One episode comprised a single cycle, and therefore its “cycle frequency” is zero. Coefficient of correlation between frequency and duration was 0.94. E, The episodes marked d–f in D are shown (high-pass filtered at 0.01 Hz). Note how cycling frequency increases with episode duration.
- Fig. 4.
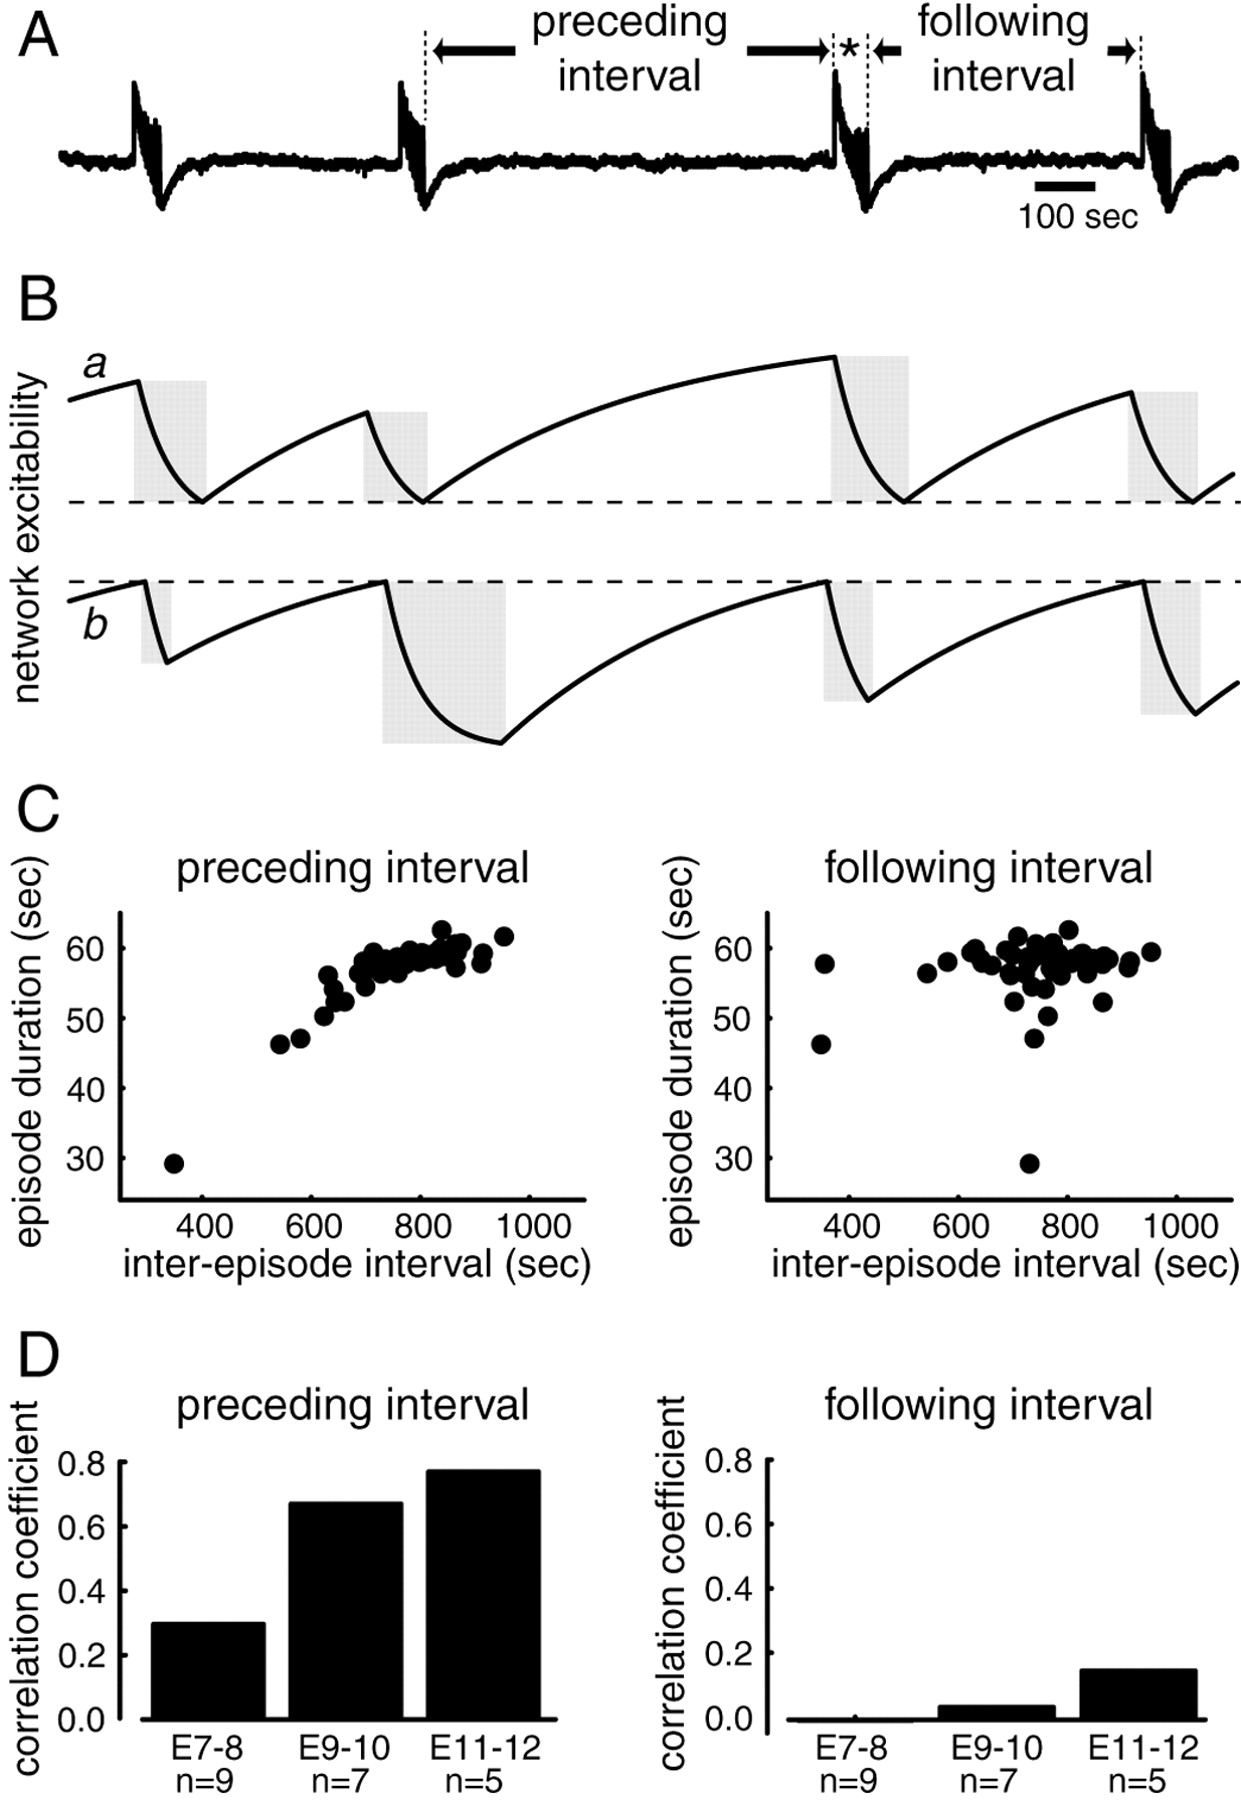
Analysis of spontaneous activity.A, Activity recorded from a ventral root of an E10 chick spinal cord (high-pass filtered at 0.01 Hz to remove DC drift). The inter-episode interval is defined by the period of time between the last cycle of an episode and the onset of the following episode. Episode duration (∗) is defined from the onset of the first cycle to the end of the last cycle. B, Schematics showing the behavior of two models in which network excitability declines during the episode (light gray rectangles) and then recovers during the inter-episode interval. In the first model (a) all episodes end at the same level of network excitability (defined by the dotted line) but can begin at different levels of excitability. As a result, the duration of the recovery period determines the length of the next episode. In an alternative model (b), all episodes start once a threshold of network excitability is reached (dotted line) but can end at various levels of excitability. Therefore, the duration of the episode determines the duration of the next inter-episode interval. C, Data obtained from an E11 embryo illustrating the relationship between the preceding or the following inter-episode intervals (de-trended; see Materials and Methods) and episode duration. D, Summary of the median correlation coefficients obtained from linear regression of the episode duration versus inter-episode interval at several different embryonic ages (E7–12). The number of preparations (n) used for each age range is indicated under each bar.
- Fig. 5.
A, Example of spontaneous activity recorded from an E7 embryo spinal cord illustrating the dissociation between episode duration and cycling frequency. B, Scatterplot showing an inverse relationship between episode duration and cycling frequency in an E7 embryo. C, Scatterplot showing the absence of a relationship between episode duration and cycling frequency in an E8 embryo. D, Scatterplots showing the positive correlation between cycling frequency and preceding inter-episode interval (left) and the absence of correlation between cycling frequency and following inter-episode interval in an E8 embryo (right).
- Fig. 6.
Time course of the model activity (black trace), connectivity (n, dashed line in bottom panel), average synaptic strength (s, dark gray solid line), and effective connectivity (n.s,dotted line). To mimic glutamatergic blockade,n was suddenly decreased (by 25% from 1.2 to 0.9 at thevertical dotted line; see bottom panel), which in turn decreasedn.s. Becausen.s, which represents the gain of the positive feedback in the circuit, is too small, activity stops. In the absence of activity, s recovers and reaches a higher level than in control (in other words, the level of depression in the network, 1 − s, has decreased). Whens is high enough to compensate for the decrease ofn, the product n.s reaches the control value, and the network becomes active again. Once the activity has recovered, the inter-episode intervals are longer, and the episode durations are slightly shorter than under control conditions.
- Fig. 7.
Recovery of the VR-VR response in control conditions and during glutamatergic blockade. A, Schematic representation of the experimental protocol, showing the amplitude of the VR-VR response (height of vertical lines) during the interval between episodes (rectangles), under control conditions (blue traces), during the interval when glutamatergic antagonists APV (50 μm) and CNQX (5 μm) were applied (green traces), and after recovery of the spontaneous activity (red traces; drugs still in bath). Ventral root stimuli were delivered every 2 min, and the evoked response was monitored in an adjacent ventral root. B, Plot of the normalized amplitude of the VR-VR response with time after an episode. Immediately after drug application (arrow ongreen trace), the amplitude of the VR-VR response declines and then recovers progressively to reach a level above the maximal control value (which was used for normalization). Once the activity resumed, the size of the VR-VR response varied over a range that was shifted upward from the control range. Thedouble-arrowed vertical dashed line indicates the net difference in size between the response after recovery in APV/CNQX and before recovery (just after APV/CNQX application). Theinset in B shows examples of the potentials evoked at the times indicated by the letters. The responses were recorded from lumbosacral root (LS)5, and the stimuli were delivered to the adjacent LS4 (10 μA for 0.4 msec). The records in a and c were obtained ∼2 min after an episode, and those in b and dwere obtained <2 min before the next episode. C, Comparison of control values of the VR-VR response with the values obtained in the interval immediately after drug application. Data were averaged from three experiments. Time was normalized with respect to longest control interval in each preparation, and points were binned in 10% increments. D, Comparison of the inter-episode interval under control conditions and once the activity has recovered in the presence of blockade, excluding the first interval after drug application. Data are as in C. Results are from an E10 embryo.
- Fig. 8.
Relationship between episode duration and inter-episode interval under glutamatergic blockade. A, Scatterplot for the preceding interval (r = 0.68).B, Scatterplot for the following interval (r = −0.10); same preparation as A(E10). C, Summary of the median correlations generated from linear regression between the interval and the episode duration for four experiments (all E10).
- Fig. 9.
Effect of GABAergic/glycinergic blockade on VLF-evoked VR response. A, Traces showing ventral root (LS5) responses evoked by stimulation of the caudal (LS8) VLF in an E11 preparation. The responses were evoked at the times indicated by theletters in B. Records were obtained under control conditions (blue traces) and in the presence of bicuculline (50 μm) and strychnine (5 μm) (Bic/Str, red traces). Although the blockade initially decreased the amplitude of the response (comparea and c, b andd), the response could recover to levels comparable with control levels (e), suggesting that the remaining (glutamatergic and/or cholinergic) synapses have increased in strength.B, Plot of the normalized amplitude of the evoked responses during several inter-episode intervals under control conditions (blue), in the interval when bicuculline (50 μm) and strychnine (5 μm) were added (green trace), and subsequently once activity recovered in the presence of the drugs (red). Note the increased variability of the intervals and the presence of intervals shorter than controls.
- Fig. 10.
The long-latency component of the dorsal to ventral root response was modulated by activity after GABA/glycinergic blockade, whereas the amplitude of the short-latency component remained approximately constant. Traces show the response from an LS2 root in control (A, blue) and in the presence of the drugs (B, 50 μm bicuculline and 5 μm strychnine; red). The left-hand traces were obtained ∼1 min after an episode, and theright-hand traces were obtained just before the next episode. The short-latency component was not modulated by activity and was not affected by the application of the drugs. C, Normalized amplitude of the short-latency component of the evoked responses during inter-episode intervals before (blue) and after (red) drug application. Note the longer inter-episode intervals after the drugs and the relatively constant amplitude of the short-latency component during the inter-episode interval, although the long-latency component did increase (as shown in the right-hand traces of B) during the long intervals induced by the drugs.
- Fig. 11.
Relationship between episode duration and inter-episode interval during blockade of GABA/glycinergic synapses.A, Scatterplot for the preceding interval (r = 0.81). B, Following interval (r = −0.09) for the same E11 preparation.C, Summary of the median correlations generated from linear regression between the interval and the episode duration for three experiments (E9–11).
- Fig. 12.
Qualitative model for spontaneous activity in hyperexcitable systems. We assume that such a system can be described by only two variables, the average activity (a) and the relative network excitability (s), and therefore any state of the system corresponds to a point in thea–s plane [for simplicity, we have not included a faster modulation of the positive feedback that is responsible for oscillations seen during an episode (Tabak et al., 2000b)]. The black S-shaped curve represents the possible activity states for each value of the positive feedback gain. There is a range of s values for which the system has several possible states, one being unstable (dashed) and representing a threshold value between the two stable states. For a given value ofs, any system with activity that is above threshold will reach the high activity state (equivalent to an episode), whereas a system with activity that is below threshold will fall to the low activity state (equivalent to the inter-episode interval). During an episode, because activity is high, network excitability declines; that is, the amount of positive feedback in the network decreases, moving the state of the system to the left as indicated by thearrowhead. For a critical value of s, only the low activity state persists, and the network falls back to low activity: this is the end of the episode. Network excitability can then recover, so the system state moves toward the right (arrowhead on low activity state). In the actual spinal network there are transient depolarizations in motoneurons and interneurons that may arise from the random coincidence of interneuronal spiking (Wenner and O'Donovan, 2001). Such events are represented in the diagram by the small vertical lineslabeled activity transients on the low activity state. When the maximum amplitude of such events becomes above threshold after sufficient recovery of the network, some of these events can trigger an episode. Because of the random nature of these events, there is no unique value of s for which episodes will occur, but rather a range of values. In the diagram, this range spans the point at which the maximum transient amplitude line crosses the threshold curve to the point at which the low activity state and the threshold curves coincide (gray segment ofabscissa). When the low activity state reaches threshold, even the slightest amount of noise will trigger an episode. Because episodes stop at a unique value of s, episodes that start after a longer inter-episode interval will have a longer duration. That is, the length of the episode is determined by the value of s at which an episode starts, and it does not affect the terminating value of s. As a result, episode length is correlated with the previous inter-episode duration and not the following one.


