

Article Figures & Data
Figures
- Fig. 1.
Stimulus generation. A, Electrodes E1 and E2 near the animal's head and tail measured the normal electric organ discharge waveform,H-T EOD, and a sinusoidal Stimulus waveform was synchronized to the zero crossings of theH-T EOD (dotted lines). The stimulus waveform was presented to the animal with two different geometries. With global geometry the stimuli were applied via electrodesG1 and G2, resulting in relatively homogeneous stimulation of the body surface. With local geometry a stimulus dipole applied the stimulus to localized regions of the body surface. B, C, Period histograms of the responses of a p-receptor afferent to sinusoidal amplitude-modulated stimuli showing that, with correct calibration, global and local stimuli result in similar electroreceptor afferent responses.
- Fig. 2.
Basilar pyramidal cell (E cell) receptive field center mapped by defining the RF center boundaries. A, Period histogram of the responses of the cell to sinusoidal AM (200 cycles) presented locally near the RF center. Thez-values are Rayleigh statistics, and values ≥ 4.5 indicate significant phase modulation (papproximately ≤ 0.01). B, Period histogram typical of responses at the RF center boundary. Open circlesindicate sites defining the best-fit elliptical area (176 mm2) estimating the RF center. C, Period histogram typical of responses 2 mm beyond the RF center boundary (filled circles). D–K, Responses at sites within the antagonistic surround. L, M, Responses at sites outside the antagonistic surround.
- Fig. 3.
Summary of pyramidal cell RF center areas determined by mapping center–surround boundaries. A, Mean spontaneous firing frequencies of bursty E cells (E), bursty I cells (I), and nonbursty (NB) E and I pyramidal cells. B, Mean burst indices (percentage of bursts unexpected, given a Poisson spike train) of E and I cells; by definition, NB cells have burst indices of zero. C, Mean RF areas for E, I, and nonbursty cells. Error bars = ±1 SEM.D, Scatter plot illustrating the correlations among pyramidal cell RF center area, spontaneous firing rate, and burst indices. Filled circles and squaresindicate E and I cells; open circles andsquares indicate nonbursty E and I cells, respectively.
- Fig. 4.
Pyramidal cell receptive field maps based on responses to sinusoidal AMs presented over an array of grid points.A, An E cell (18.8 sp/sec spontaneous rate; RF center area, 629 mm2; surround area, 3295 mm2). Whiteellipseshows RF center area (138 mm2) mapped as the best-fit ellipse to boundary points shown as black circles. B, An RF map for an 18.6 sp/sec I cell recorded from the same animal; center and surround areas, 296 and 3416 mm2, respectively. RF center areas determined from boundary points, 124.8 mm2. C, D, RF maps for a 27 sp/sec nonbursty E cell mapped with the standard stimulus intensity and with a 6 dB (∼2×) increase in amplitude, respectively. RF center and surround areas, 560 and 17 mm2, respectively, for the standard dipole stimulus; areas were increased to 591 and 227 mm2, respectively, with the stronger stimulus. Color maps were set to saturate at z-values of ±10. The gray circle indicates the spatial extent of the above-threshold stimulus attributable to the standard stimulus intensity determined from p-receptor afferent recordings.
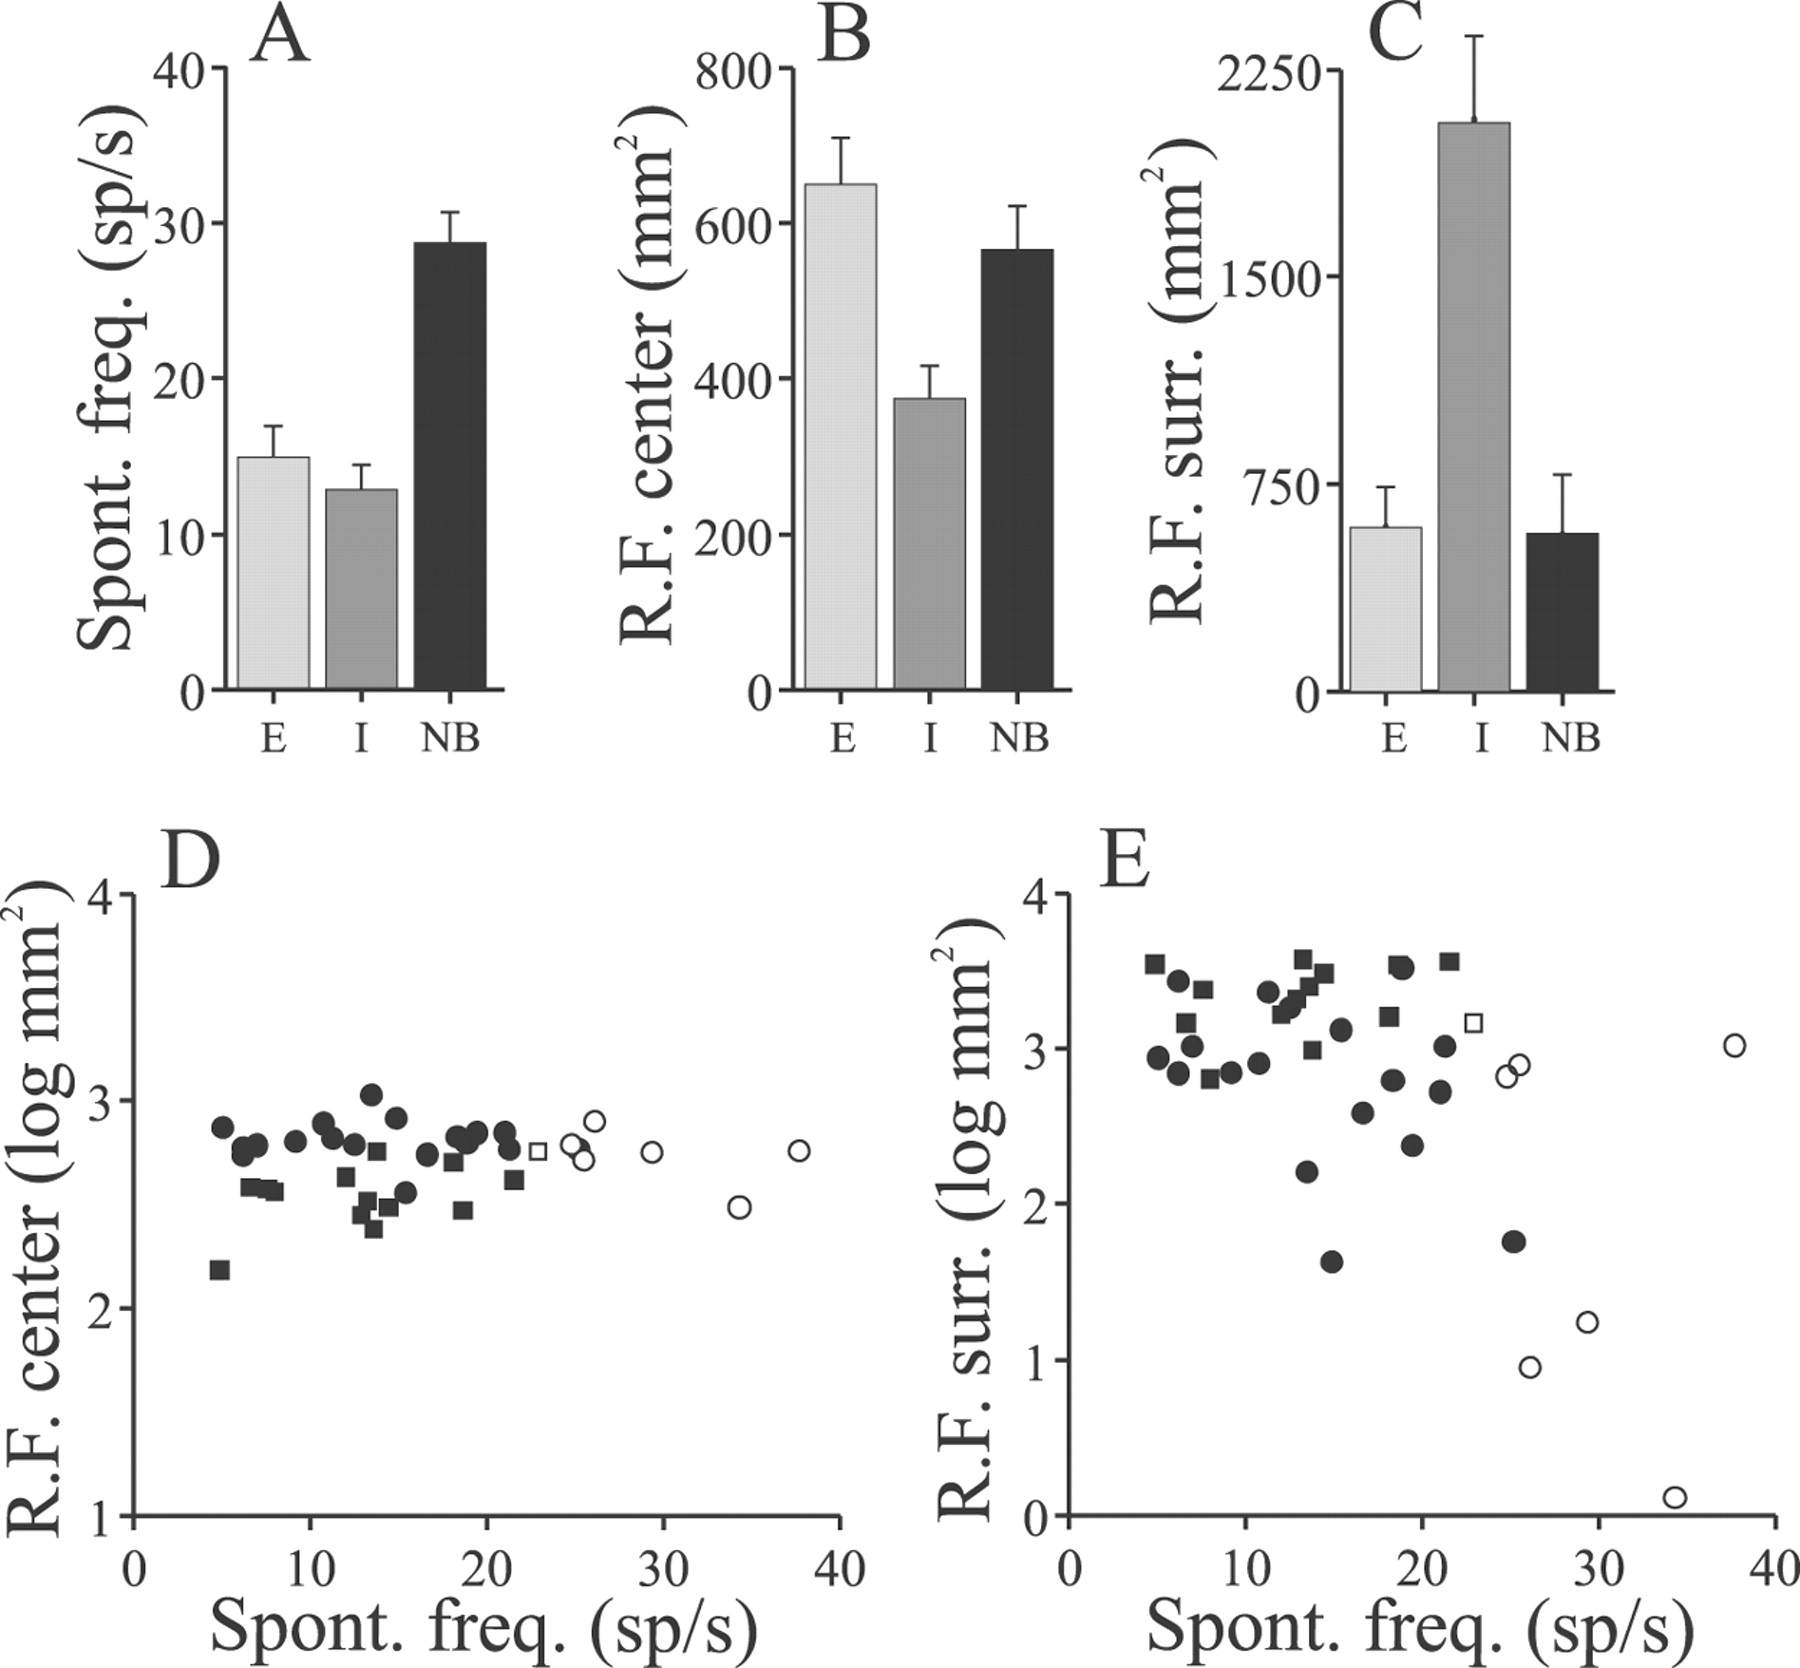
- Fig. 5.
Summary of RF dimensions mapped with dipole stimulus positioned over an array of grid points.A, Mean spontaneous firing rates of the sample of E cells (E), I cells (I), and nonbursty (NB) E and I cells selected for similar local EOD modulation.B, Mean RF center areas; E cell and NB cell RF center areas > mean I cell center area; p < 0.02; one-way ANOVA and Tukey–Kramer multiple comparison tests.C, Mean RF surround areas; I cell RF surround area > E and NB cell RF surrounds; p < 0.02; one-way ANOVA and Tukey–Kramer multiple comparisons. Error bars = ±1 SEM.D, E, Summaries of RF center and surround areas, respectively, of cells having different spontaneous firing rates (correlation coefficients: D, r = 0.143, p = 0.39; E,r = −0.51, p = 0.001).Filled circles and squares indicate E and I cells, respectively; open circles andsquares indicate nonbursty E and I cells.
- Fig. 6.
Responses of pyramidal cells to stepwise electric organ discharge (EOD) AMs. A, B, Responses of a high- and low-frequency E cell to −12 dB stepwise increases in EOD AM presented with local geometry. C, D, Responses of the cells of A and B to global presentation of stepwise AMs. E, Responses of the cells ofA and B to local and global EOD AMs of various amplitudes.
- Fig. 7.
Scatter plot relating differences in responses to local versus global stepwise AMs to the spontaneous firing frequencies of the cells. Filled circles and squaresindicate E and I cells, respectively; open circles andsquares indicate nonbursty E and I cells, respectively.
- Fig. 8.
Responses of high- and low-frequency pyramidal cells to 4 Hz sinusoidal EOD AMs. A, B, Period histograms of a high-frequency E cell and low-frequency I cell responses to local stimulation (stimulus amplitude, −12 dB). C, D, Responses of the cells of A andB to −12 dB sinusoidal AMs presented globally.E, Responses of the cells of A andB to sinusoidal AMs of various amplitudes presented with global and local geometries.
- Fig. 9.
Scatter plot relating differences in responses (mean vector differences) to local versus global sinusoidal AMs to spontaneous firing frequencies of the cells. Filled circles and squares indicate E and I cells, respectively; open circles and squaresindicate nonbursty E and I cells.
- Fig. 10.
Examples of reconstructions of random EOD amplitude modulations presented with either global or local stimulus geometry. Gray lines, Stimulus waveforms; variations in p-p EOD amplitude were measured within the RF center of the cell.Black lines, Reconstruction waveforms. Vertical lines, Times of spike occurrence. Bottom insets, Optimal filters; alignment to individual spike times is indicated by the vertical dotted line. A1, A2, Global and local stimulation, respectively, of a low-frequency E cell.B1, B2, Global and local stimulation, respectively, of a medium-frequency I cell. C1, C2, Global and local stimulation, respectively, of a high-frequency NB E cell.
- Fig. 11.
Summary of comparisons of coding fraction and mutual information determined from reconstructions of random AM stimuli presented with global (G) or local (L) geometry. A, Mean coding fractions of both E and I cells are significantly greater for stimuli presented with local geometry (p values ≤ 0.001; t tests), but not different for NB cells (p = 0.76). B, Mean mutual information rates of both E and I cells are significantly greater for stimuli presented with local versus global geometry (p values ≤ 0.004; t tests), but not different for NB cells (p = 0.65). Neither mean spike rates during stimulation (C) nor mean stimulus contrasts (D) varied significantly contingent on stimulus geometry for E, I, or NB cells. Error bars = ±1 SEM.
- Fig. 12.
Variations of coding fraction and mutual information rates with spontaneous firing rates of the cells. Increases in coding fraction (A) and mutual information rates (B) seen with local versus global stimulation are correlated negatively with the spontaneous firing rates of the cells (A, r = −0.67,p < 0.001; B, r= −0.82, p < 0.001). C, Coding fractions determined from local RF center stimulation are not correlated significantly with spontaneous rate (r = 0.33; p = 0.10). D, Mutual information rates in bits per spike are significantly lower for higher-frequency pyramidal cells (r = −0.55;p = 0.003). E, F, Both coding fraction and mutual information rates increase significantly with increasing pyramidal cell spontaneous rate (E,r = 0.83, p < 0.001;F, r = 0.73, p< 0.001). Filled circles and squaresindicate E and I cells, respectively; open circles andsquares indicate nonbursty E and I cells, respectively.


