

Article Figures & Data
Figures
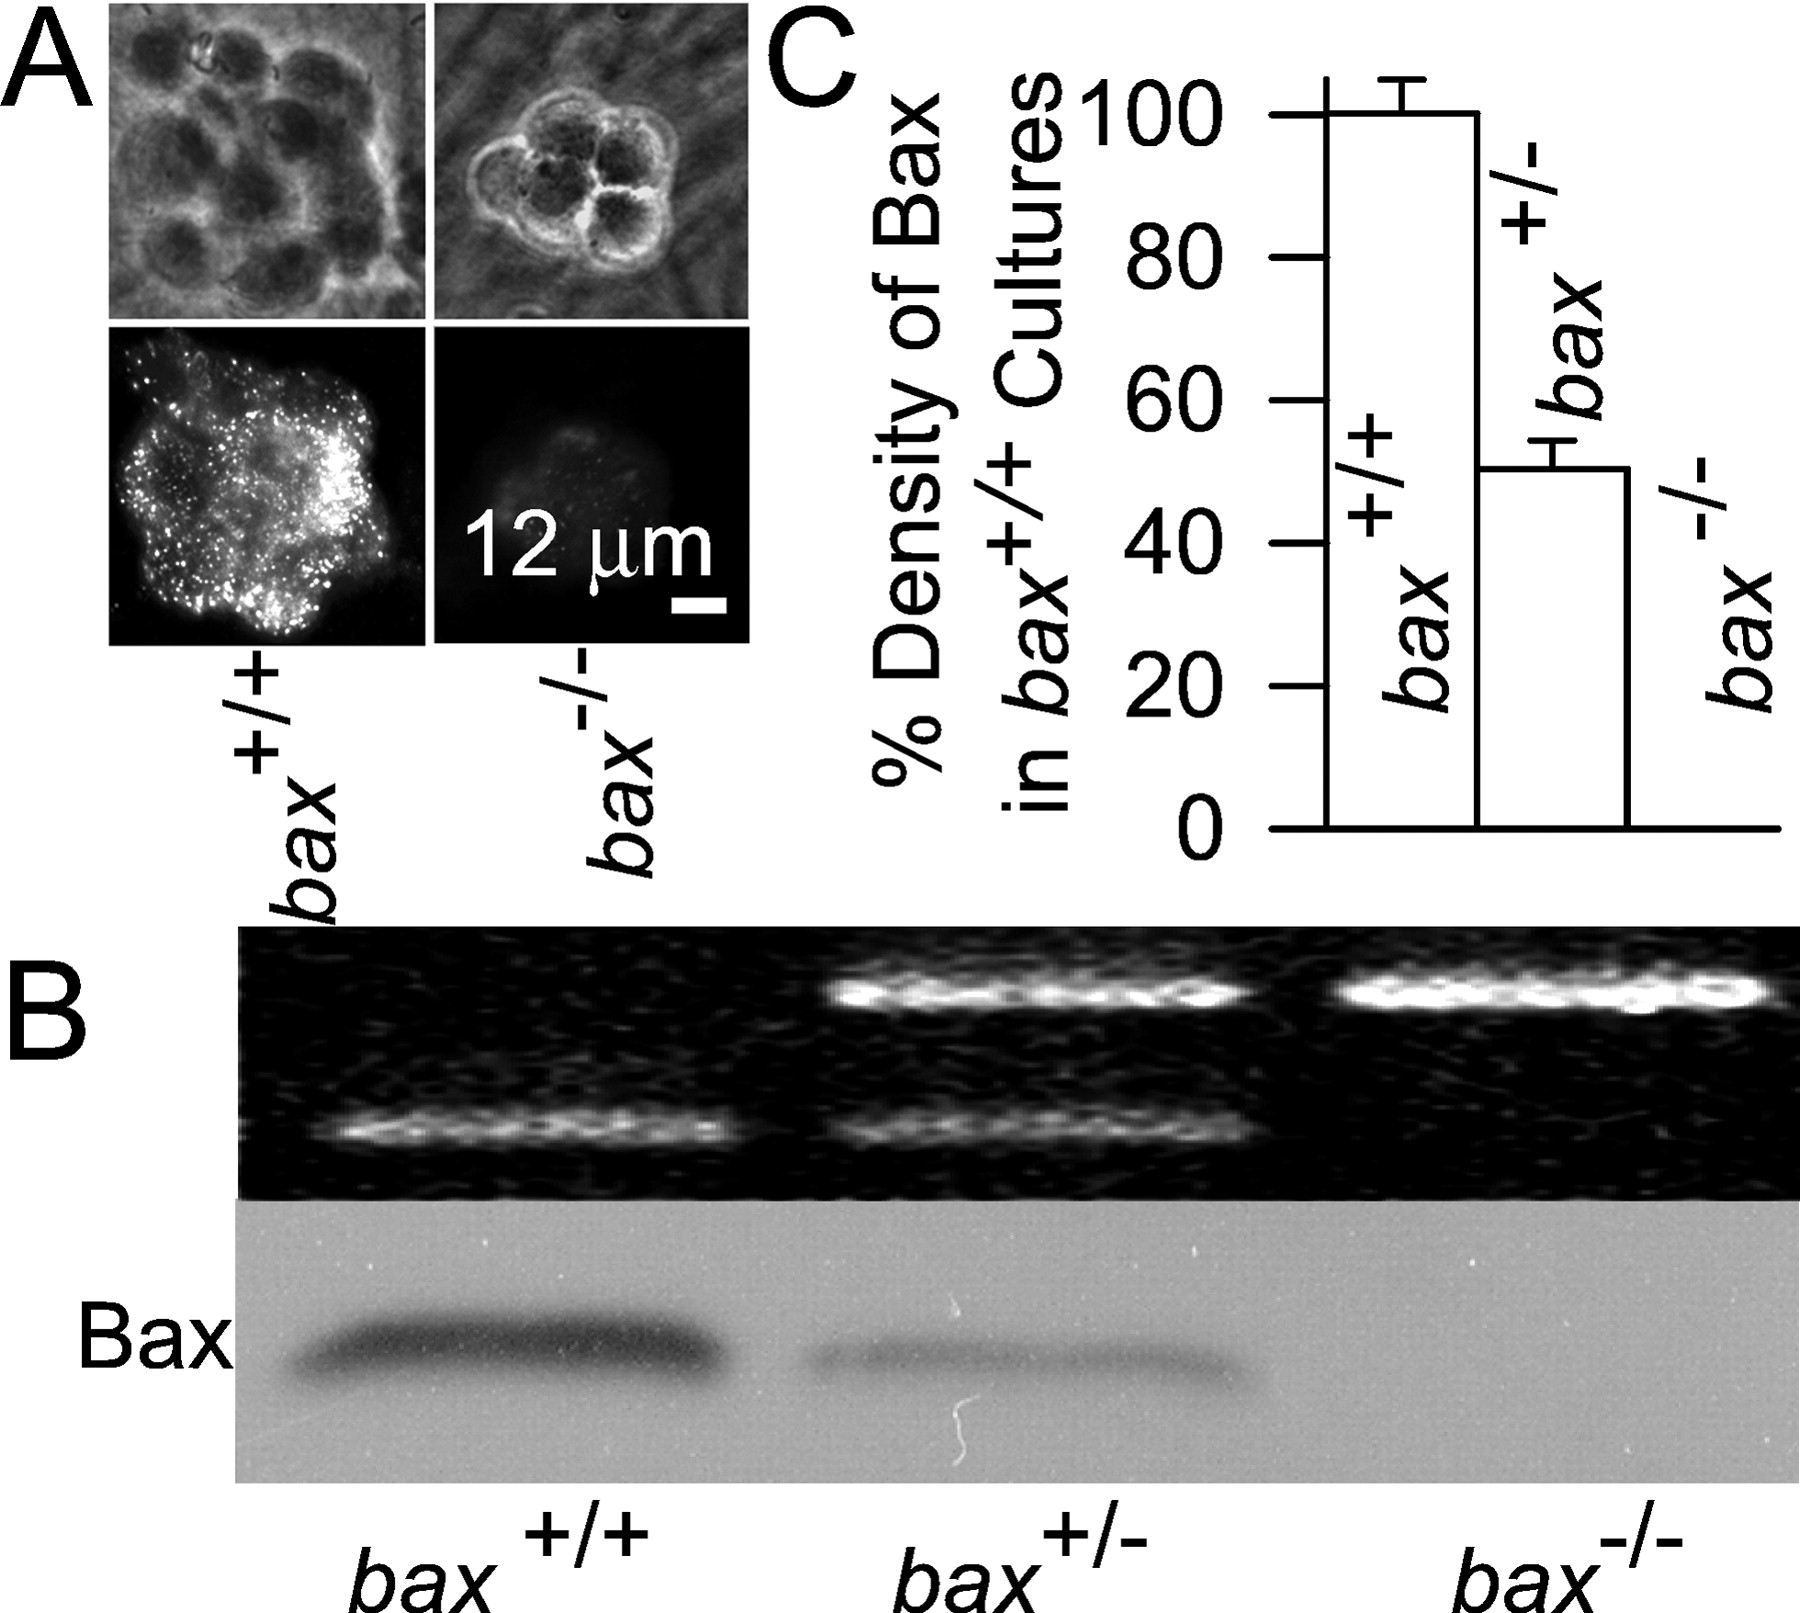
- Fig. 1.
Effect of gene dosage on expression of Bax protein in mouse sympathetic neurons in cell culture. A, Expression of Bax in neurons frombax+/+ andbax−/− mice. Top andbottom micrographs, Paired phase contrast and fluorescent micrographs of clusters of neurons maintained in the presence of NGF. B,bax+/+ gene dosage determined the level of expression of Bax protein. Western blot analysis (bottom) shows an absence of Bax in a culture taken from a bax−/− mouse and an intermediate level of Bax in a culture taken from abax+/− animal. Top, PCR banding pattern used to determine the bax genotype (see Materials and Methods). C, Quantification of Bax levels. The densities of Bax bands on Western blots were determined for each culture with SigmaGel software. Similar loading was verified by comparable tubulin densities (data not shown). n = 5–7 cultures.
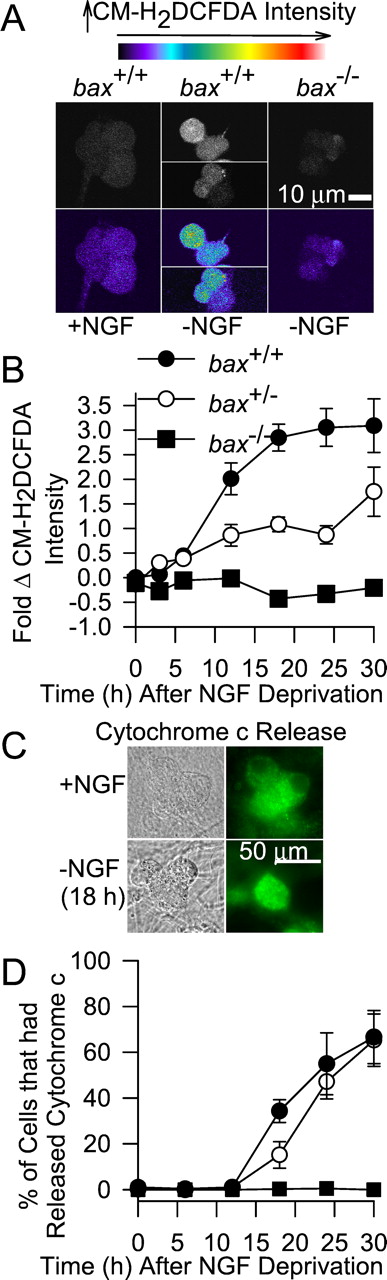
- Fig. 2.
Bax lies upstream of increased ROS levels induced by NGF deprivation. A, Withdrawal of NGF caused increased ROS in sympathetic neurons taken frombax+/+ animals. Confocal micrographs show neuronal somas loaded with the redox-sensitive dye CM-H2DCFDA. Top micrographs, Raw, gray-scaled images of neurons taken frombax+/+ or bax−/− mice and maintained in culture medium containing NGF or deprived of NGF for 18 hr. Bottom micrographs, Same cells that have been pseudocolor-coded to indicate dye intensity. The barshows the relative intensities of the different colors. The more intense the dye, the higher the ROS levels. Note that only cells taken from bax+/+ animals exhibited increased CM-H2DCFDA intensity after NGF deprivation. The scale is the same for all micrographs. B, Quantification of changes in ROS (CM-H2DCFDA intensity) levels in NGF-deprived neurons. For each cell, CM-H2DCFDA intensity was normalized to the average CM-H2DCFDA intensity of NGF-maintained bax+/+ cultures that had been plated at the same time. ROS levels are shown as fold change from these values. This normalization method was used in all subsequent figures. n = 70–233 neurons. C, Micrographs illustrating release of cytochrome c after NGF deprivation. Left micrographs, Differential interference contrast (DIC) images. Right fluorescent micrographs, Same cells immunostained for cytochromec. Note the intense staining in cells that had been maintained in medium containing NGF and the faint, homogeneous staining in two of the three cells that were deprived of NGF for 18 hr. The remaining cell had not yet released cytochrome c into the cytoplasm. D, Time course of cytochromec redistribution in NGF-deprived neurons frombax+/+ andbax+/− animals. Cells frombax−/− mice did not release cytochrome c. Symbols indicate the same genotypes as in B. n = 3–6 cultures.
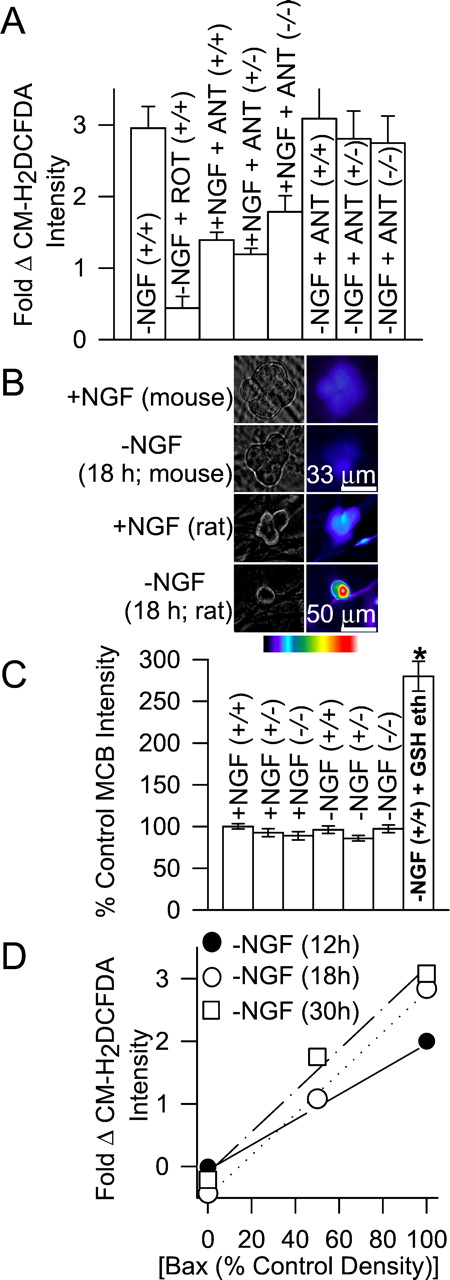
- Fig. 3.
Increased ROS derives from the mitochondrial electron transport chain. A, Effects of mitochondrial agents on ROS levels. Cells were either maintained in NGF-containing medium before treatment (+NGF) with the compounds or were deprived of NGF for 18 hr before treatment (−NGF). ROT, Rotenone (10 μm); ANT, antimycin A (1 μm). There were no significant differences between the CM-H2DCFDA intensities in the ANT-exposed, NGF-maintained cells of the three genotypes (p > 0.27). However, the intensities of all three were significantly higher than in NGF-maintained neurons not exposed to ANT (p < 0.001). There were no significant differences between the CM-H2DCFDA intensities in NGF-deprived, ANT-exposed cells of the three genotypes and in NGF-deprived bax+/+ cells not exposed to ANT (p > 0.14). NGF-deprived cells exposed to ROT had much lower CM-H2DCFDA intensities than NGF-deprived neurons not exposed to ROT (p< 0.001). Compounds were added to the culture medium during the period of CM-H2DCFDA loading. After loading, the dye was washed out, and cultures were bathed in L-15 medium containing the same treatments for confocal microscopy. n = 58–233 neurons. B, Paired phase contrast (left) and fluorescent pseudocolored micrographs (right) of cells stained with the GSH-sensitive dye MCB. Unlike NGF-deprived rat sympathetic neurons (bottom), NGF-deprived mouse neurons (bax+/+) did not exhibit increased MCB staining after NGF withdrawal. The bar indicates relative pseudocolor values for MCB intensity (red,white are most intense and indicate higher GSH concentrations). The top and bottom scale bars are for mouse and rat neurons, respectively. C, GSH levels in the three mouse genotypes (as indicated by MCB staining) were similar and changed little after NGF withdrawal (18 hr). GSH ethyl ester (GSH eth; 10 mm for 18 hr) is a membrane-permeant form of GSH that was used as a positive control for MCB detection of GSH. n = 81–181 neurons.D, ROS levels were linearly related to Bax concentrations (Bax densities on Western blots). Bax data are taken from Figure 1C, and ROS data are from Figure2B. R = 0.99 for each deprivation time.
- Fig. 4.
Increasing cellular GSH concentration inhibits death of NGF-deprived neurons frombax+/+ andbax+/− mice. A, Cells from bax+/− mice were saved from death by lower GSH ethyl ester concentrations than were cells frombax+/+ animals. Thebar shows survival ofbax−/− neurons deprived of NGF for the same period without GSH ethyl ester. n = 5–11 cultures for each time point. B, Effects of different concentrations of GSH ethyl ester on ROS levels (CM-H2DCFDA intensity measured 18 hr after NGF deprivation). Lower concentrations of GSH ethyl ester inhibited the ROS burst in neurons frombax+/− animals than in neurons frombax+/+ animals. Cells were exposed to the GSH ethyl ester from the time of NGF withdrawal. They were then washed and loaded with CM-H2DCFA for 20 min in medium lacking NGF and GSH ethyl ester. After washing, cultures were exposed to L-15 medium containing the appropriate concentrations of GSH ethyl ester (Kirkland and Franklin, 2001). n = 33–60 neurons for each time point. C, Time courses for rescue of NGF-deprived bax+/+ neurons by NGF and GSH ethyl ester (10 mm). Cells were deprived of NGF, and, at various times after withdrawal, medium containing either NGF or GSH ethyl ester (10 mm) was added. Forty-eight hours after withdrawal, the medium of all cultures was replaced with NGF-containing medium. Cultures were then allowed to recover 3–5 d, and survival was determined. The dotted line shows the GSH-mediated survival data scaled to 100% (at time 0) to allow easy comparison of the two rescue time courses. n = 9–12 cultures for the GSH time course. The time course for rescue by NGF was repeated only once (n = 7–12 cultures).
- Fig. 5.
Increasing ROS with H2O2causes cytochrome c release independent of Bax.A, Effect of different concentrations of H2O2 on ROS levels (CM-H2DCFDA intensity) in NGF-maintained neurons from the three baxgenotypes and on ROS levels inbax−/− neurons deprived of NGF for 18 hr. After cells were loaded with CM-H2DCFDA, the dye was washed out, and cultures were exposed to H2O2 in the incubator for 20 min. They were then washed three times with L-15 medium and left in the second wash for confocal microscopy. The line shows a linear regression of all the data (R > 0.99).n = 45–128 neurons. B, Cytochromec was lost frombax−/− neurons after H2O2 exposure. Top panels, Paired DIC and fluorescent micrographs of a control (+NGF)bax−/− cell immunostained for cytochrome c. Bottom panels, Similar cells after treatment with H2O2 (2 mm). Cultures for were exposed to H2O2 in NGF-containing medium for 30 min. They were then washed twice with NGF-containing medium without H2O2 and returned to the incubator for 30 min before processing for immunocytochemistry. Western blots of total cytochrome c (mitochondrial and cytoplasmic) and tubulin in cultures exposed to H2O2 confirmed loss of cytochrome c without tubulin loss (data not shown).C, Effect of different concentrations of H2O2 on cytochrome c release in NGF-maintained neurons of the three bax genotypes and onbax−/− neurons deprived of NGF for 18 hr. Cells were exposed to the indicated H2O2concentrations for 30 min, washed two times with culture medium containing or lacking NGF, as appropriate, and returned to the incubator for another 30 min to assure degradation of released cytochrome c (Deshmukh et al., 1998; Neame et al., 1998; Kirkland and Franklin, 2001). Release was determined as in Figure 2. Symbols have the same meaning as inA. Data are from 3–11 cultures. D, Time-dependent effect of H2O2 on cytochromec release. Concentrations of H2O2 that had little effect on cytochromec redistribution after 30 min of exposure caused release when neurons (bax+/+) were treated with these concentrations for longer periods. H2O2 was replenished every 30 min. Data are from three to five cultures. The cytochrome c status of 50–100 neurons was determined for each culture in C andD.
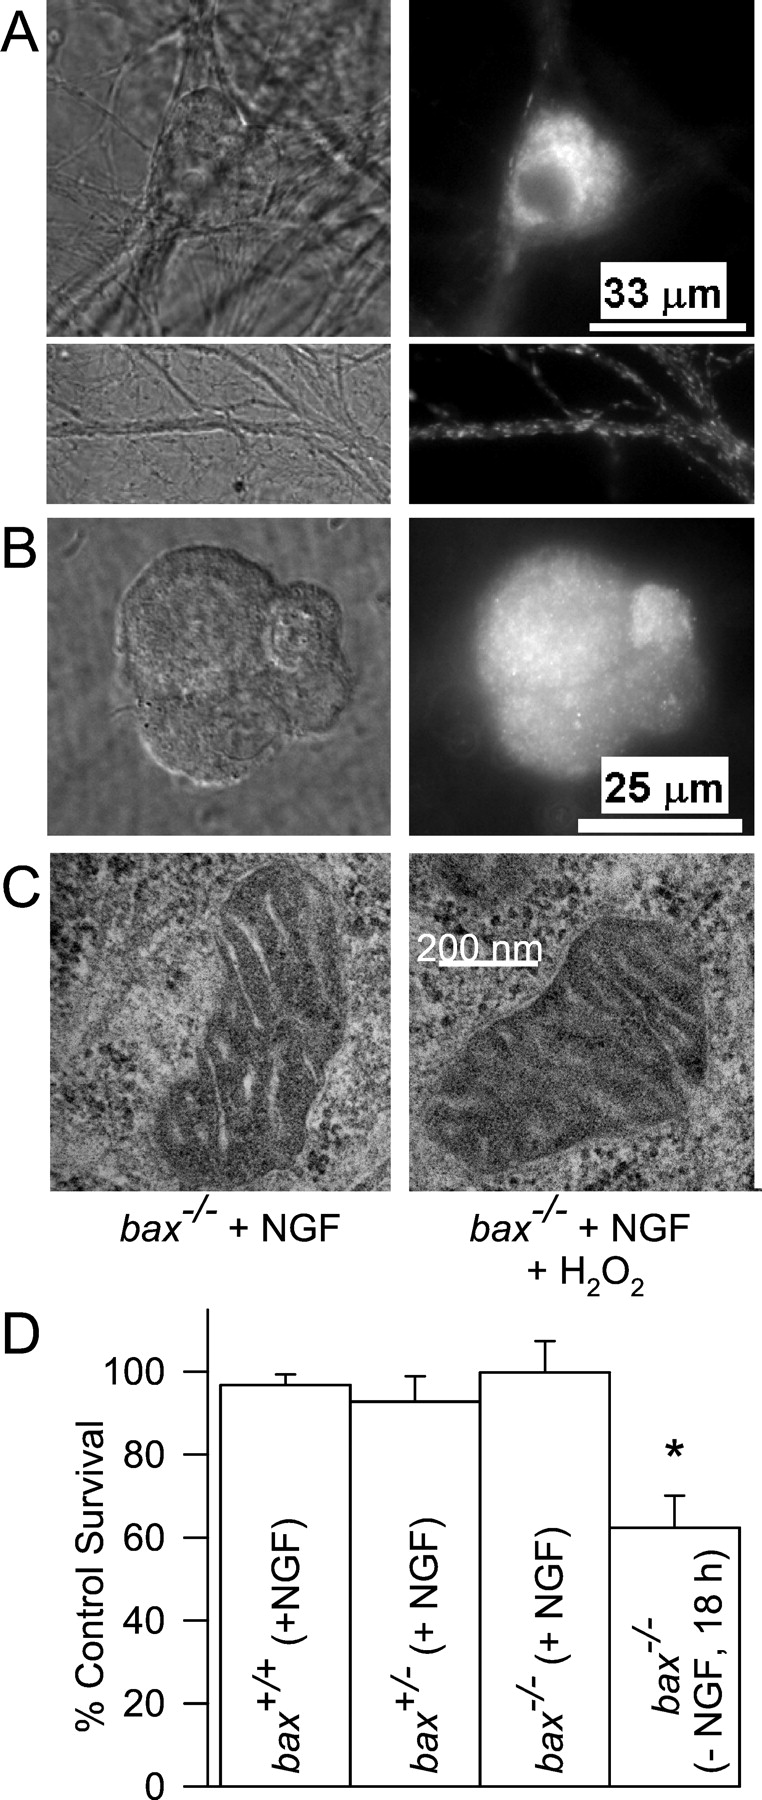
- Fig. 6.
H2O2 treatment does not damage mitochondria. A, Treatment with H2O2 did not cause loss of Δψm. Shown are paired DIC and fluorescent micrographs of NGF-maintained cells (bax−/−) exposed to the Δψm-sensitive dye Mitotracker Red CMXRos (5 μm for 20 min in NGF-containing medium) after 30 min of H2O2 (2 mm) treatment followed by two washes. The intense punctate staining in the soma and neurites indicates retention of Δψm. B, Mitochondria in neurons depleted of cytochrome c by H2O2 treatment (2 mm for 30 min) became reconstituted with cytochrome c several days after NGF readdition. Shown are paired DIC and fluorescent micrographs of bax+/+ cells exposed for 30 min to H2O2 (2 mm), washed twice, and then maintained for 5 d in NGF-containing medium without H2O2. Immunocytochemical staining is for cytochrome c. bax−/−neurons treated in the same manner were visually indistinguishable from the bax+/+ cells shown.C, Electron micrographs of mitochondria in NGF-maintained neurons (bax−/−) and in NGF-maintained neurons (bax−/−) that had been treated for 30 min with H2O2 (2 mm). No morphological differences were noted.D, H2O2 induced death only inbax−/− neurons that had been deprived of NGF. NGF-maintained or -deprived neurons of the indicated genotypes were exposed to H2O2 (2 mm for 30 min). Cultures were then returned to NGF-containing medium without H2O2 for 3–5 d. Only the survival of NGF-deprived, bax−/− neurons was significantly lower than that of NGF-maintained cells (p< 0.001). Survival was normalized to that of untreated sibling cultures of NGF-maintained cells from the same mouse pup.n = 6–13 cultures.
- Fig. 7.
Bax deletion prevents increased ROS (CM-H2DCFDA intensity) during the PCD of cerebellar granule neurons. Apoptosis was induced by repolarization of membrane potential and serum withdrawal. Potential was repolarized by switching from a culture medium containing 25 mm KCl to one with 5 mm KCl. The method of CM-H2DCFDA loading and measurement was the same as for sympathetic neurons.n = 83–273 cells. Cells were from three platings, except for the bax−/− 6 and 12 hr time points, which were from two platings.


Tables
Condition Fold change in dye intensity after 30 min of H2O2 2 mmH2O2 bax+/+ + NGF +2.82 ± 0.27 bax+/−+ NGF +2.31 ± 0.22 bax−/− + NGF +2.03 ± 0.23 bax+/+ − NGF +2.75 ± 0.26 bax+/− − NGF +2.37 ± 0.15 bax−/− − NGF +2.68 ± 0.38 10 mmH2O2 bax+/+ ROT − NGF 62 ± 9.02 bax+/+ ANT A − NGF 59 ± 2.58 All cells were loaded for 20 min with 10 μmCM-H2DCFDA. They were then transferred to L-15 medium and exposed to H2O2. Intensity is shown as fold change from CM-H2DCFDA intensity measured in NGF-maintainedbax+/+ cells that were plated at the same time.n = 26-112 cells from two or three separate platings. There were no significant differences in dye intensities of cells treated with the same concentrations of H2O2(p > 0.05). These data demonstrate that the different Bax levels (±NGF) in the three genotypes did not interfere with the concentration of CM-H2DCFDA loaded into cells or with the ability of CM-H2DCFDA to be oxidized, and the compounds tested did not interfere with dye loading or ability of the dye to be oxidized. All NGF deprivation (−NGF) was for 18 hr.


