

Article Figures & Data
Figures
- Fig. 1.
Schematic overview of tectofugal projections.a, Parasagittal schematic view of three axon pathways connecting the tectum opticum (Tect) of the dorsal mesencephalon (Mes) with other areas of the brain. Shown in red is the tectothalamic tract (tt) projecting to several nuclei in the diencephalon (Di), in blue is the tectobulbar tract (tb) projecting to nuclei in the hindbrain (Hb), and inyellow is the tectoisthmic tract (ti) projecting to the nuclei of the isthmic region (Ist). Rostral (r) is to the right, and dorsal (d) is to the top.b, Nissl-stained frontal section through the right half of the dorsal chicken midbrain with a schematic overlay of the tectofugal neurons. Incoming fibers from the retina form the most superficial tectal layer, the stratum opticum (SO), and terminate in the retinorecipient layers of the stratum griseum et fibrosum superficiale (SGFS), establishing a retinotopic projection on the entire tectal hemisphere. Different combinations of cadherins (shown in color) mark different classes of tectoefferent neurons in the stratum griseum centrale (SGC). These neurons project via the stratum album centrale (SAC) toward the brachium of the superior colliculus (BCS), in which they segregate into different fascicles according to their cadherin expression and leave the tectum. Cadherins thereby label specific subfascicles of the axon tracts depicted in the scheme above. These tracts eventually separate to innervate different nuclei and subnuclei. Medial (med) is to the left, and dorsal (d) is to the top. (Note that the use of similar colors ina and b should not implicate a simple 100% match of one tract system with only one cadherin. It is rather the combination of cadherins, which specify certain tracts.)c, Schematic illustration of cadherin-specific fascicles found in the BCS. In the tectothalamic tract, the Ncad-positive fibers (in red) project to pretectal nuclei (Sp/IPS/PT in a) and to the nucleus rotundus (R in a) of the thalamus (Redies et al., 1993). The cad7-positive fibers (pink) can be followed to the nucleus ovoidalis complex (Ov ina) and to a subregion of the nucleus rotundus (Wöhrn et al., 1999). cad6B-positive neurons give rise to a small but distinct fiber fascicle (in blue) projecting alongside the tectothalamic tract to the anterior nucleus of the ventral supraoptic commissure (not depicted in a) (Wöhrn et al., 1999). In the tectobulbar tract, three cadherins (Ncad, cad7, and cad6B) label different but partially overlapping subsets of fiber fascicles projecting to hindbrain targets that cannot be determined with certainty (question marks ina). The tectoisthmic tract divides into two subtracts: one is characterized by Rcad expression (inyellow) and has the isthmic nucleus as its target (e.g.,Ipc in a and b orImc in b), and one expresses Rcad and cad6B (blue with yellow stripes) and seems to terminate in the nucleus semilunaris (Slu). Not all subfascicles are present at all levels of the BCS. Some leave more rostrally than others. They also show overlap with each other at their margins. The area boxed in b is shown at higher magnification in c. c, Caudal;Cb, cerebellum; Imc, nucleus isthmi, pars magnocellularis; Ipc, nucleus isthmi, pars parvocellularis; lat, lateral; Sp/IPS/PT, nuclei of the pretectal area, nucleus subpretectalis/nucleus interstitio-pretecto-subpretectalis/nucleus pretectalis;Tel, telencephalon; v, ventral.
- Fig. 2.
Axonal tracing of the Ncad-positive portion of tectothalamic tract at E17. a, Overview of tectal hemisphere (Tect) with traced fibers (green) and Ncad immunostaining (red). Yellow indicates costaining.Imc, Nucleus isthmi, pars magnocellularis;vt, tectal ventricle. Scale bar, 200 μm.b–e, Traced fibers of the tectothalamic tract (tt) in the stratum album centrale (SAC) and the brachium of the superior colliculus (BCS) stained for different cadherins (Ncad in b; cad7 inc; cad6B in d; and Rcad ine). Note that the tectobulbar tract (tbin d) and the tectoisthmic tract (ti ine) are not traced. Scale bar (in b):b–e, 100 μm. f–i, Representative details (see box in a) of stratum griseum centrale (SGC) neurons stained for different cadherins showing that the majority of traced SGC neurons is Ncad positive (f) but only a small percentage of cells show immunoreactivity for cad7 (g), cad6B (h), and Rcad (i). Scale bar (in f): f–i, 100 μm.
- Fig. 3.
In vivo electroporation of embryonic chicken midbrain. a, Epifluorescence photography of a chicken embryo at E7, i.e., at 24 hr after electroporation with an expression plasmid for GFP showing expression in the dorsocaudal region of the tectum. Arrows point to the transgenic GFP expression domain; note that the yellowish dots are merely reflections of light, and two examples of these artifacts are marked by open arrowheads.b, Confocal laser scanning image of double transgenic tectal neurons showing cytoplasmic localization of GFP in their cell somata and transgenic R-cadherin labeling on their surface. Scale bar, 10 μm. c, Laser scanning image of an immunostained frontal section of a transgenic tectal hemisphere at 5 d after electroporation (E11). Transgenic neurons are identified by their expression of GFP. Axonal projections of labeled stratum griseum centrale (SGC) neurons can be followed (arrows) via the stratum album centrale (SAC) to the brachium of the superior colliculus (BCS), in which the tectoefferent fascicles segregate into the tectothalamic tract (tt), tectobulbar tract (tb), and tectoisthmic tract (ti). Tectal layering is revealed by nuclear staining (in blue). Cadherin staining (Rcad, in red) marks the tectoisthmic projection to the nuclus isthmi, pars parvocellularis (IPC). SO, Stratum opticum;SGFS, stratum griseum et fibrosum superficiale. Scale bar, 100 μm. d–p, Coelectroporation of different expression plasmids for GFP and a cadherin leads to respective overexpression of GFP (d, f,g, i, k, m,n, p) and the cadherin (Ncad ind and e, cad7 in g andh, cad6B in k and l, and Rcad in n and o) by tectal neurons (d, g, k,n; yellow indicates costaining) and their axonal growth cones (e, f,h, i, l, m,o, p; red andgreen scans are shown separately). Arrowsin e and f point to matching areas of the red and the green scan. Scale bars: (in d)d, g, k, n, 20 μm ; (in e) e, d,l, m and (in h)h, i, o, p, 5 μm.
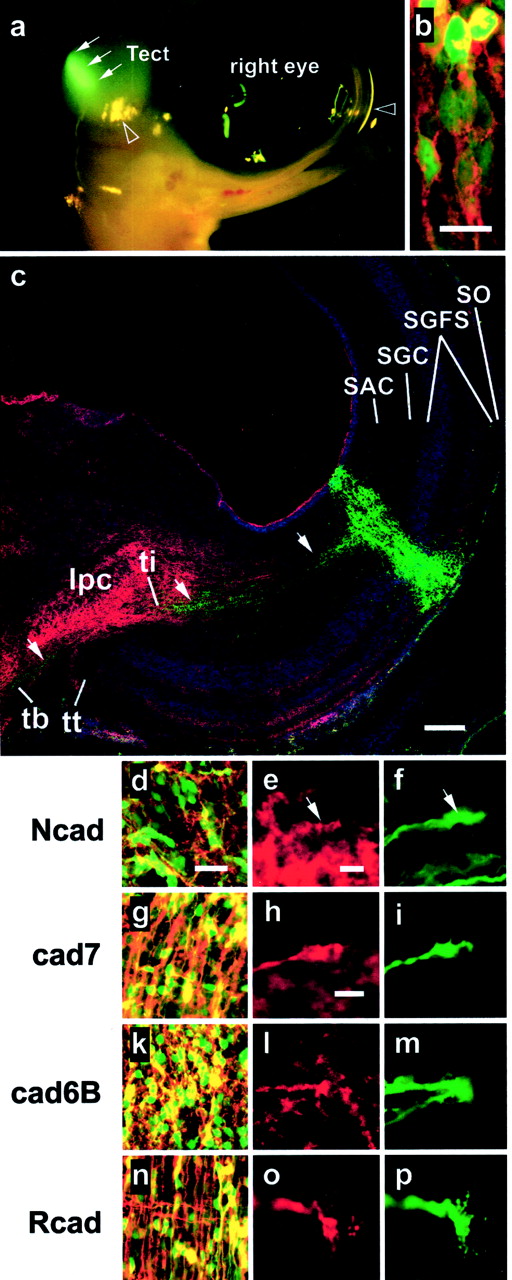
- Fig. 4.
Pathway selection of transgenic stratum griseum centrale (SGC) axons at the brachium of the superior colliculus (BCS). GFP-labeled axons (green) are assayed for their tract selection based on cadherin immunostaining (red; Ncad infirst column from the left; cad7 in thesecond column; cad6B in the third column; Rcad in the fourth column). Dashed linesrepresent the borders of the BCS. a–d, Control axons transgenic for GFP alone can be detected in all tracts.e, Schematic summary depicting the result shown ina–d: fibers are found to follow the Rcad-positive (yellow) and cad6B/Rcad-positive (yellow–blue) axons constituting the tectoisthmic tract (ti), the cad6B-positive (blue), and cad7-positive (pink) portion of the tectobulbar tract (tb) and also the cad7-/Ncad-positive tectothalamic tract (tt).f–i, Axons overexpressing Ncad choose an Ncad-positive portion of the tt that overlaps with the cad7-positive portion. In the tb, transgenic axons are detected in the Ncad-positive portion of the tb (f) that partially overlaps with the cad7-positive portion (g) and very little with the cad6B-positive portion (h). No transgenic axons are found in the Rcad-positive tectoisthmic tract (i). k, Summary: the majority of axons select the Ncad-positive portion of the tb and tt (red). l–o, cad7-transgenic fibers show a similarly selective distribution but choose the cad7-positive portion of the tb instead of the Ncad-positive portion (comparel with m). As can be seen also ing and h, this cad7-positive portion has some overlap with the cad6B-positive portion of the tb.p, Summary: fibers prefer cad7-positive tracts (pink) and overlap with other cadherins only where there is endogenous overlap. q–t, Cad6B-overexpressing axons choose the respective cad6B-positive portion of the tb and show only overlap with Ncad (q) and cad7 (r) where there is endogenous overlap. Some fibers can be seen also in the ti (t). u, Summary: most axons are found in cad6B-positive fascicles of the tb (blue) and ti (yellow–blue). v–y, The majority of Rcad transgenic axons projects through the Rcad-positive isthmic tract (ti) to the isthmic nucleus, pars parvocellularis (IPC, y) or together with cad6B toward the nucleus semilunaris (Slu). Only a minority of axons follows a pathway in tb that is devoid of Rcad but characterized by cad6B (x) and cad7 coexpression (w). z, Summary: most fibers follow tracts labeled by Rcad (yellow andyellow–blue). Scale bar (in a):a–d, f–i, l–o,q–t, v–y, 100 μm.
- Fig. 5.
Outline of the quantitative image analysis procedure. a, Laser scanning image of cad7/GFP double transgenic axons reaching the BCS (cad7 staining in red, GFP in green, and nuclear staining inblue). The dashed lines mark the boundaries of the BCS used to electronically cut out the region of interest. Scale bar, 200 μm. b, Enlargement ofregion boxed in a to visualize single pixels. Scale bar (in b): b–h, 10 μm.c, Binarized image of the cadherin immunostaining.d, Binarized image of the GFP labeling.e, GFP labeling after one round of dilation to generate pixels covering the immediate neighborhood of the transgenic axons.f, Subtraction of the original binarized GFP image (d) from e generates pixels (blue) that represent the close vicinity of the transgenic fibers. g, Overlay of the vicinity pixels with the binarized pixels of the cadherin immunostaining (in red) to reveal those of the vicinity pixels, which match with the cadherin immunostaining.h, Yellow and pink pixels represent matching and nonmatching pixels, respectively. Note that cad7-overexpressing fibers outside the cad7-positive portion of the tectobulbar tract are correctly revealed as nonmatching. The quantification analysis was performed on scans of the whole BCS region like that outlined in a, and counting of pixels was performed by the computer.
- Fig. 6.
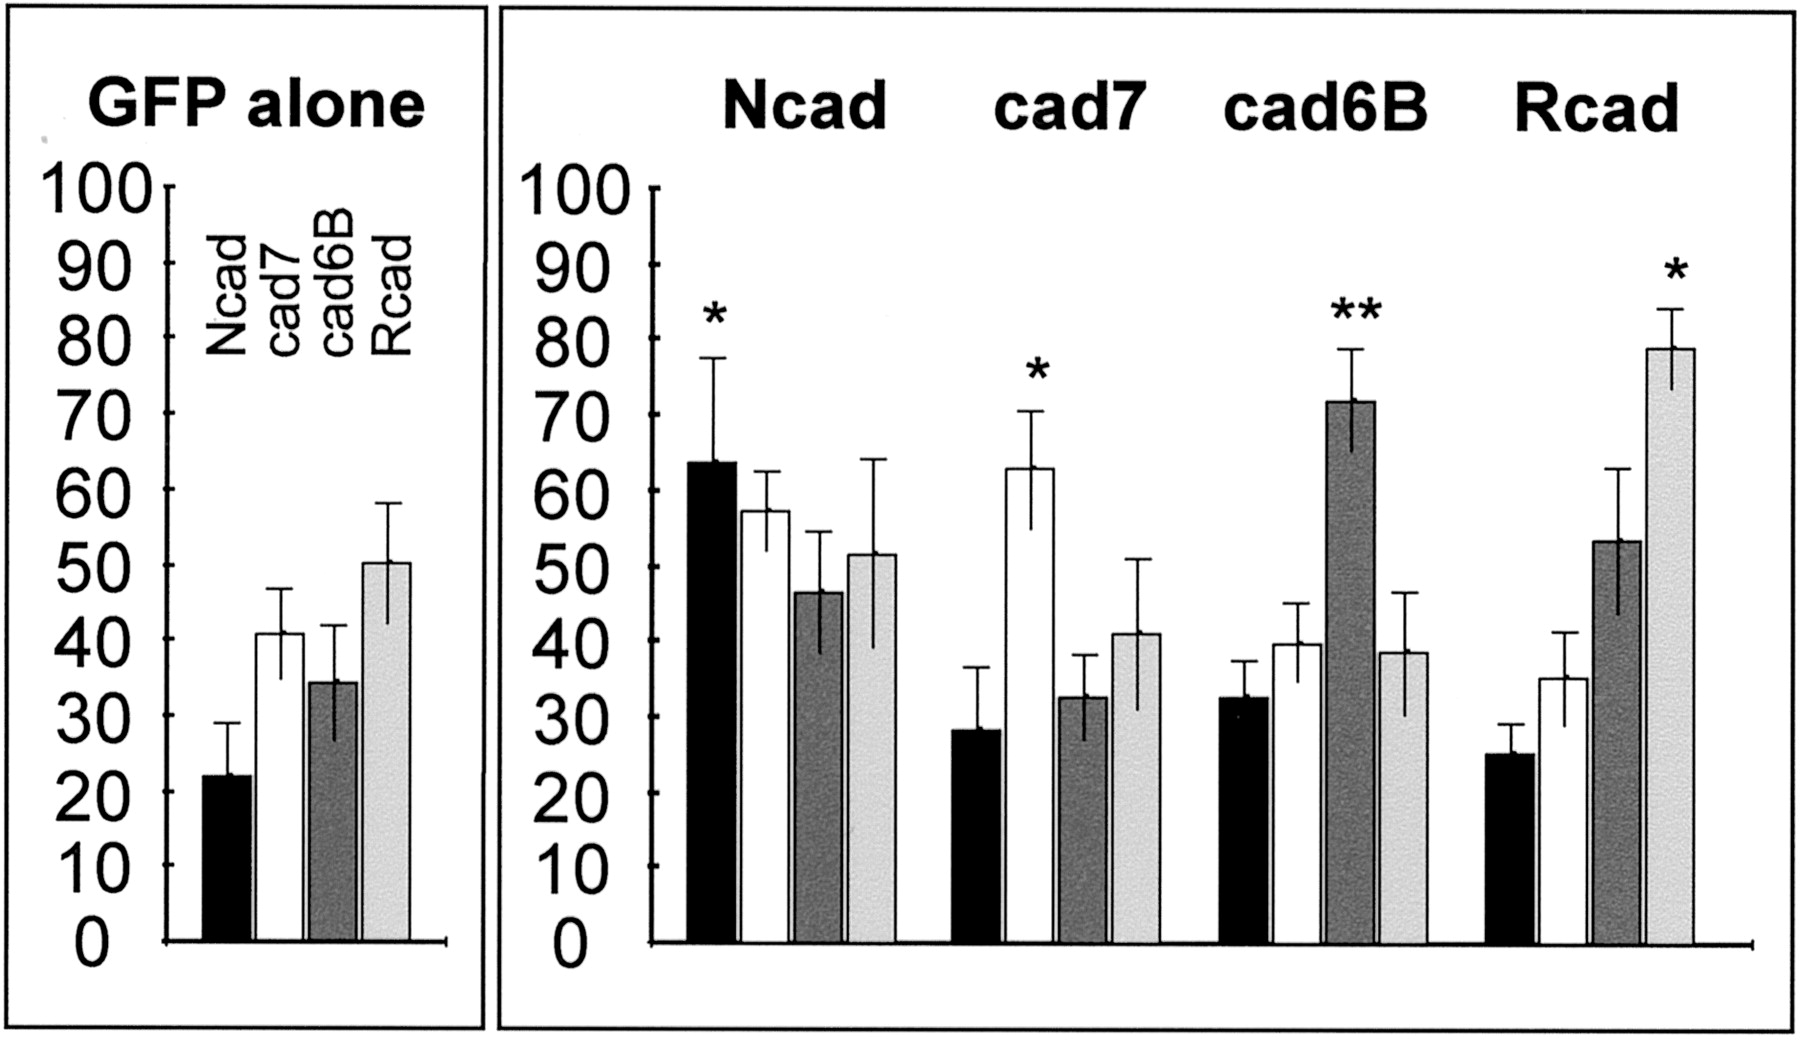
Quantification of cadherin-dependent tract selection. Results are based on image analysis performed on four different cadherin immunostainings in five different experimental series (±SEM). Bars represent the average percentage of vicinity pixels of GFP-labeled transgenic axons that colocalize with cadherin immunostaining (black for Ncad,white for cad7, dark gray for cad6B, andlight gray for Rcad). The left(small box) shows results for control embryos (GFP alone, n = 7). The right(large box) summarizes results for the experimental embryos overexpressing one particular cadherin (Ncad,n = 5; cad7, n = 5; cad6B,n = 7; and Rcad, n = 5). *p < 0.05; **p < 0.005; two-tailed unpaired Student's t test comparing average of experimental with control conditions (GFP alone).


