

Article Figures & Data
Figures
- Fig. 1.
Determination of the maximal IPSCs in layer II/III cells. A, Stimulus recording configuration. Scale bar, 200 μm. B, C, Examples of IPSCs and EPSCs evoked by a stimulus series of increasing intensity. Both the IPSCs and the IPSC/EPSC reached saturation at a stimulus intensity of 40 μA.D, Saturation of the IPSCs does not depend on the stimulation site. Top, Stimulus recording configuration.Bottom, Maximal IPSCs evoked by the indicated stimulating electrode. WM, White matter.
- Fig. 2.
Developmental changes in the balance of excitation and inhibition. A, B, Examples of responses evoked by a stimulus series of increasing intensity in a cell from a 3-week-old rat (A) and a 5-week-old rat (B). The input–output relationship for the IPSC (solid symbols) and EPSC (open symbols) is shown in C for 3-week-old rats and inD for 5-week-old rats. E, Developmental changes in the maximal IPSC (solid symbols) and in the IPSC/EPSC ratio (open symbols). The number of cells included in each data point is given inparentheses.
- Fig. 3.
Visual experience triggers the developmental increase in the maximal IPSC. A, Traces are examples of responses evoked by stimulus series of increasing intensity in cells from rats reared in the indicated conditions.B, Average magnitude of the maximal IPSC, EPSC, and IPSC/EPSC ratio from rats reared in the indicated conditions.Asterisks denote values significantly different (p < 0.005) from controls.NR, Normally reared; DR, dark reared;DR+48, dark reared plus 2 d normally reared;NR→DR/NRDR, normally reared–dark reared.
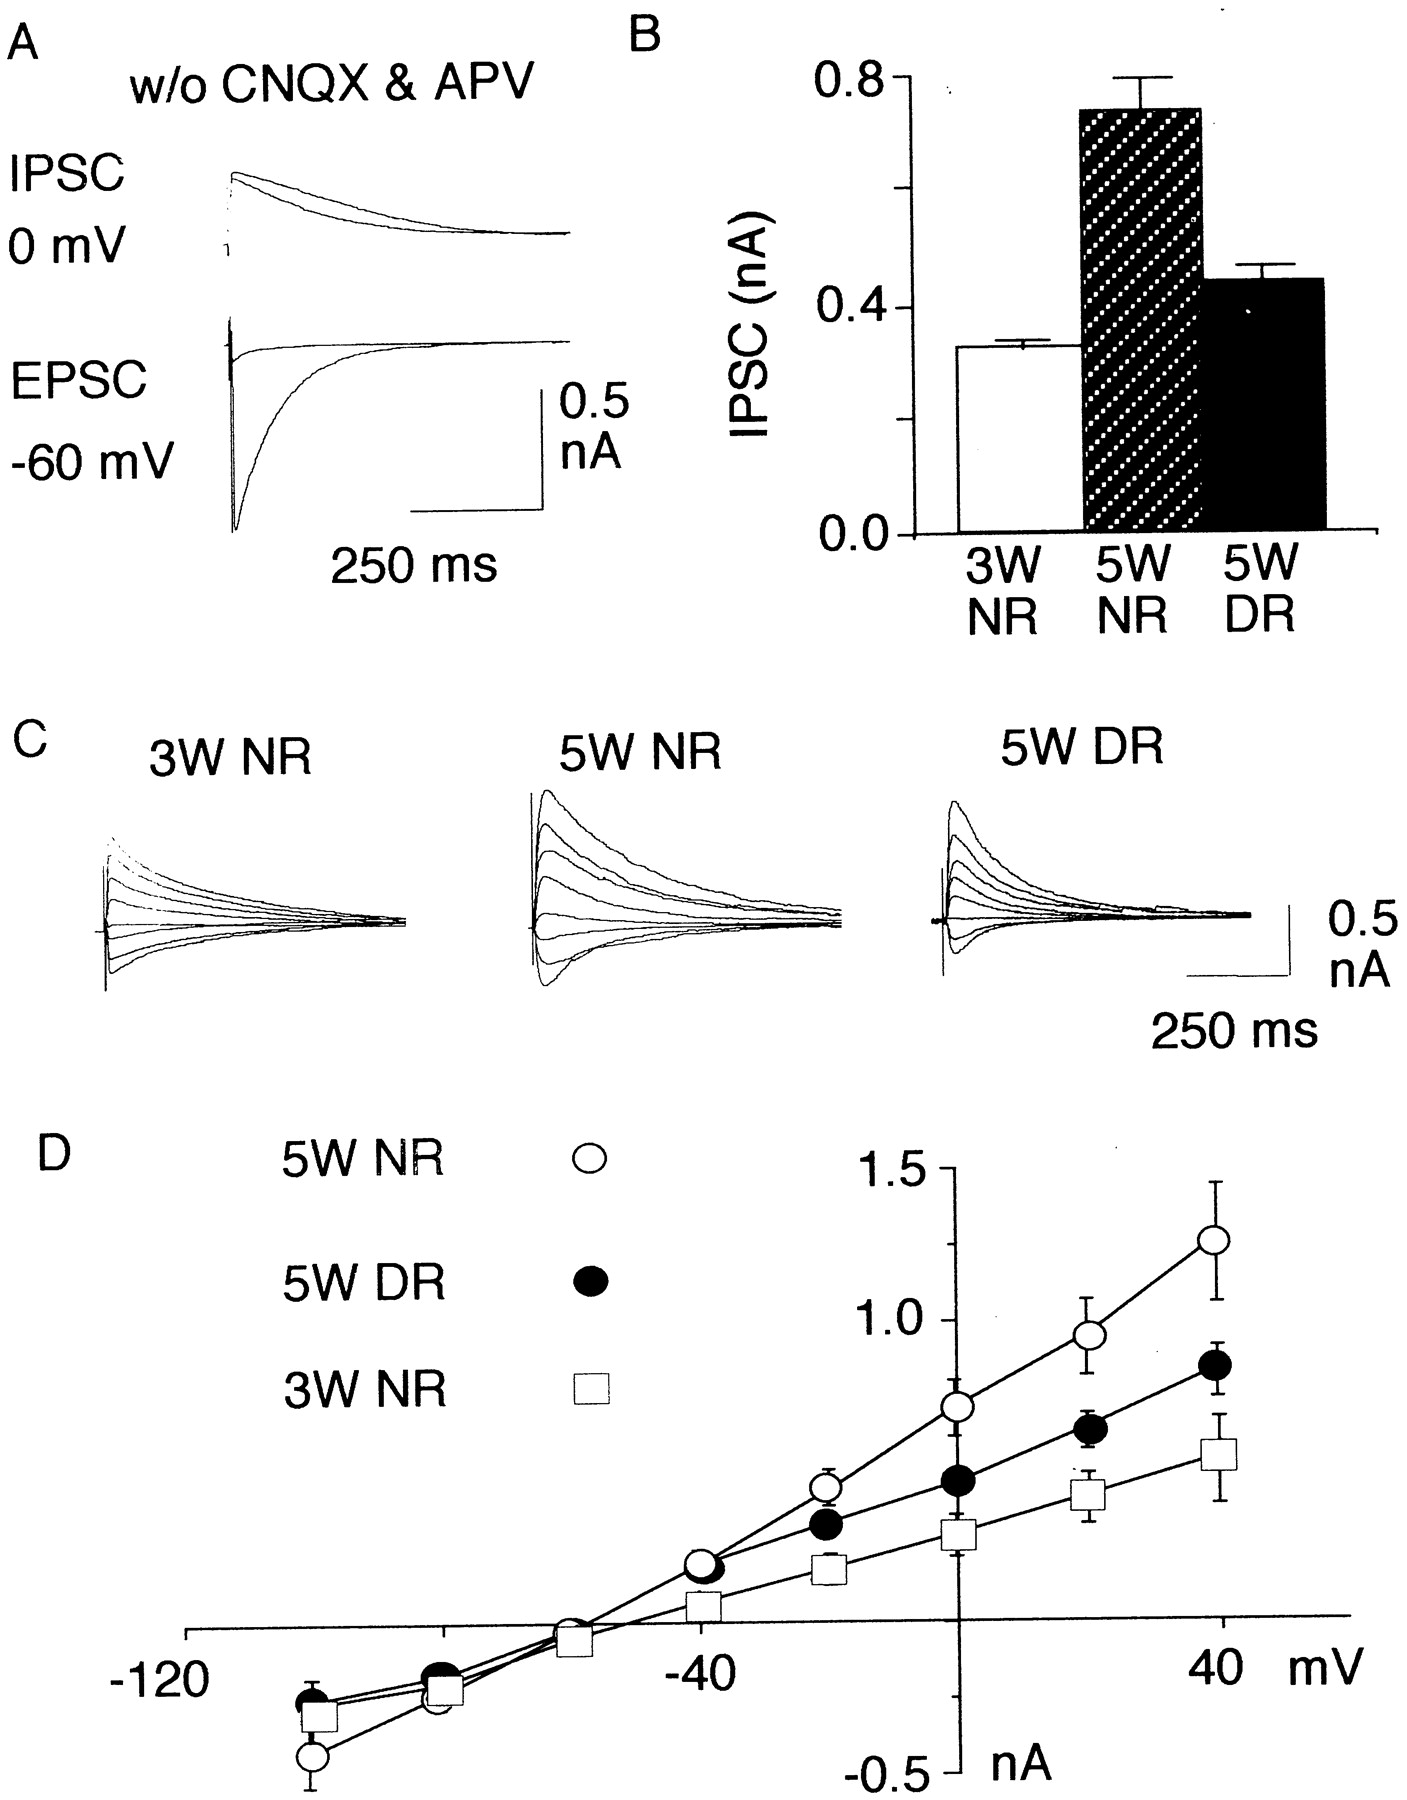
- Fig. 4.
Effects of age and experience on the maximal monosynaptic IPSC. A, A 20 μmconcentration of CNQX and a 100 μm concentration of APV abolish the responses recorded at −60 mV but barely affect the responses recorded at 0 mV. B, Average amplitude of monosynaptic maximal IPSCs recorded in 3-week-old (3W) cells, 5-week-old (5W) cells, and dark-reared (DR) cells. C, D,I–V relationship for the maximal IPSCs.C, Examples of IPSC recorded at different membrane potentials in 3-week-old cells, 5-week-old cells, and dark-reared cells. D, I–V plot of the peak amplitude of the maximal IPSCs. NR, Normally reared.
- Fig. 5.
Miniature IPSCs recorded in 20 μmCNQX, 100 μm APV, and 1 μm TTX in layer II/III cells. A, Reversal potential of mIPSCs. The current traces were recorded at the indicated holding potential.B, A 1.0 μm concentration of BMI reversibly eliminates mIPSCs. C, D, Examples showing the relationship between the 10–90% rise time and the amplitude (C) and the decay (D) for all of the mIPSCs recorded in a 5-week-old cell. The solid lines indicate the best linear fit of the data.
- Fig. 6.
Effects of age and sensory deprivation on layer II/III mIPSCs. A, Examples of current traces recorded in a 3-week-old (3W) cell, a 5-week-old (5W) cell, and a dark-reared (DR) cell. NR, Normally reared. B, Superimposed normalized averages of the mIPSCs recorded in all 3-week-old cells (thin line), 5-week-old cells (black thick line), and dark-reared cells (gray thick line). For each cell, the average mIPSC was computed using the first 100 isolated events aligned by their rise time and normalized by their amplitude. Subsequently, these averages were further averaged across ages and rearing conditions.C, Cumulative probability distribution of the mIPSC amplitude for 3-week-old cells (thin line), 5-week-old cells (black thick line), and dark-reared cells (gray thick line). The first 300 events from each cell were used in this computation. Inset, Histograms of the amplitude distribution for all events recorded in all cells. The bin size was 5 pA. D, Cumulative probability distribution of the mIPSC interval. Conventions and calculations are as in C. Inset, Histograms of the interval distribution for all events recorded in all cells. The bin size was 10 msec.
- Fig. 7.
Effects of age and sensory deprivation on the responses evoked with minimal stimulation. All responses were recorded at −80 mV in the presence of 20 μm CNQX and 100 μm APV. A, Examples of responses evoked with minimal stimulation. The superimposed traces are 20 consecutive responses evoked with two stimulation intensities, 2.8 μA (left) and 3.0 μA (right). In each case, the thick traces correspond to the average of the successful responses. The amplitude histogram of the responses is displayed on the right. The noise level, calculated from the prestimulus baseline, is also plotted (in gray), but at a different scale (2×). B, Examples of responses evoked with minimal stimulation in a 3-week-old cell (3W, left), a 5-week-old cell (5W, center), and a 5-week-old dark-reared cell (5W DR, right). In each case, 20 consecutive responses are superimposed.C, Probability distribution of the average amplitude responses (excluding failures) evoked in 3-week-old cells (thin line), 5-week-old cells (thick line), and dark-reared cells (thick gray line). D, Relationship between the 10–90% rise time and the decay constant (top graph) and amplitude (bottom graph) for the responses evoked in 3-week-old cells (×), 5-week-old cells (○), and dark-reared cells (●). Solid linescorrespond to the best linear fit of the data. E, Normalized averaged responses recorded in all 3-week-old cells (thin line), 5-week-old cells (black thick line), and dark-reared cells (gray thick line). Each of the superimposed traces represents the average of all different cell responses normalized by their amplitude and aligned by their rise time.


