

Article Figures & Data
Figures
- Fig. 1.
Schematic depiction of neuronal activation profiles in cortical area MT. A, A patch of cortex illustrating the topographic representation of preferred direction (arrows) across MT. The bell-shaped curverepresents a hypothetical activation profile in response to a directional visual stimulus. The height of the curve indicates the level of discharge. Because MT neurons are broadly tuned for direction, neurons with a range of preferred directions become active. Theshaded region indicates the most active neurons in the population. B, In addition to the visually induced activity, a second, electrically evoked profile of activity has been added. Note that the shape and extent of this profile is hypothetical. The dashed curves represent the hypothetical profiles of activation elicited by the visual stimulus or microstimulation alone, whereas the solid curve represents the sum of the two.
- Fig. 2.
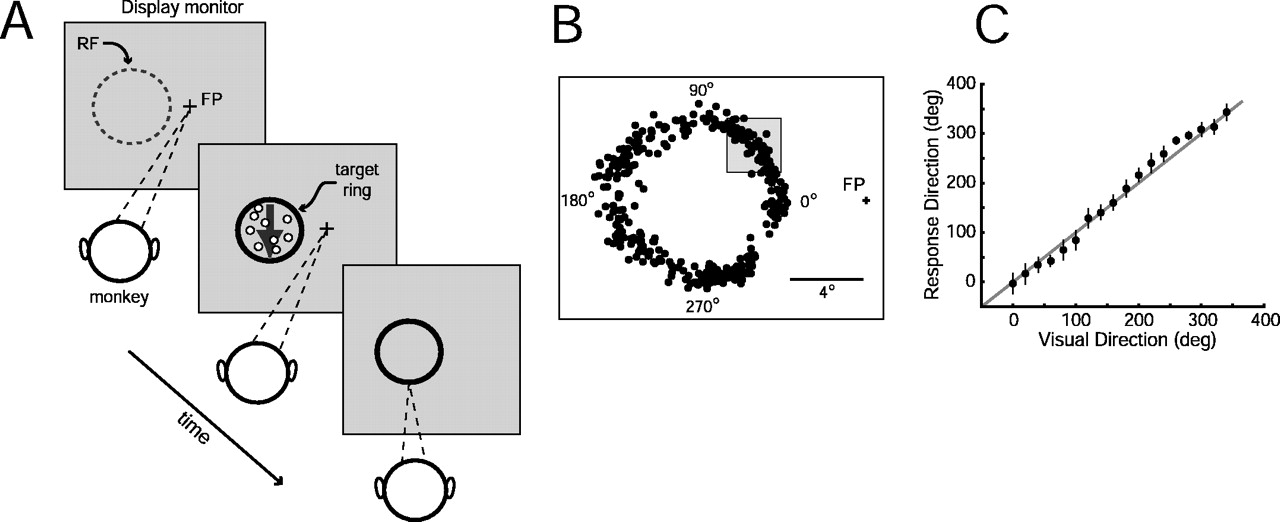
Psychophysical task and behavioral performance.A, Schematic illustration of the direction identification task. The three panels depict three key epochs in each trial. A trial begins when the monkey looks at a fixation point (FP) on the display monitor (left panel). Converging dashed lines indicate the monkey's direction of gaze. The dashed circlerepresents the receptive field (RF) of the MT column under study (not visible to the monkey). After a variable delay, a random dot motion stimulus appears moving in one of 8 or 18 possible directions (middle panel). The dot stimulus appears inside an annulus, or target ring. The motion stimulus is presented for 1 sec while the animal maintains fixation. The motion stimulus and the fixation point are then extinguished, and the animal makes a saccadic eye movement to the location on the target ring toward which the dots had moved (right panel).B, Saccade endpoints for one block of trials. Each black point represents the endpoint of a saccade. In this block, 18 different directions were presented spanning 360° in equal intervals. The directions were randomly interleaved, and each was presented 20 times. The coherence of the visual stimulus was 80%. No microstimulation was applied on these trials. The gray square represents the dimensions of the electronically defined reward window (not visible to the monkey) in this block of trials for one direction of visual motion.C, Mean and circular SD of the monkey's direction estimates plotted as a function of the direction of the visual stimulus. The diagonal represents perfect performance of the task.
- Fig. 3.
The effect of microstimulation on direction estimates. A, Polar plot of multiunit responses at one MT site to eight different directions of motion. The polar angle represents the direction of visual motion; the radius represents discharge rate. The dashed circle indicates the spontaneous discharge rate in the absence of a motion stimulus. Thearrow indicates the preferred direction of multiunit activity based on a Gaussian fit to the data. B, Effect of microstimulation on the monkey's direction estimates. Eachblack point represents the mean direction estimate for one visual direction of motion at 80% coherence (same data as in Fig.2C). Points are staggered radially for visualization purposes. Magenta arrows indicate the shift in the mean direction estimate on microstimulation trials. The black radial arrow indicates the preferred direction for this stimulation site (same as in A). Centers-of-mass for nonstimulated direction estimates (black point) and stimulated direction estimates (magenta point) are displayed relative to the center of the ring. The magenta arrowlinking the two center-of-mass points indicates the magnitude and direction of the microstimulation effect. C, Effect of microstimulation in 0% coherence block. Black pointsaround circumference represent individual direction estimates on nonstimulated, 0% coherence trials. Cyan pointsrepresent direction estimates on stimulated, 0% coherence trials. Theblack point inside the ring represents the center-of-mass for nonstimulated direction estimates; the cyan point inside the ring represents the center-of-mass for stimulated direction estimates. The cyan vectorbetween the two indicates the magnitude and direction of the microstimulation effect. For an explanation of the asterisk, see Results.
- Fig. 4.
A, Direction of the microstimulation effect in the direction identification block as a function of multiunit preferred direction for 30 experiments with significant microstimulation effects (black points). Theopen circles represent data from four experiments in the manual response task discussed in Results. The diagonalis the unity-slope line. The circular correlation coefficient,r, of the two data sets is 0.8. Data points represented by open symbols were not included in calculating the correlation coefficient. B, Direction of microstimulation effect in the direction identification block as a function of direction of microstimulation effect in the 0% coherence block in 19 experiments with significant effects in both blocks. The circular correlation coefficient, r, is 0.94.
- Fig. 5.
Illustration of response distributions and hypothesis test. A, Predicted distributions of direction estimates under the vector-averaging hypothesis (left panel) and the winner-take-all hypothesis (right panel). The gray panel represents the display monitor; the black circle represents the target ring; magenta points represent individual saccade endpoints; converging dashed lines represent the monkey's direction of gaze. The black downward arrowindicates the direction of visual motion, and the cyan rightward arrow indicates the microstimulated direction.B–E, Distributions of individual direction estimates for four of the visual directions (0, 80, 100, 180°) from Figure 3(ra051b). R values are given where relevant.Black points represent direction estimates for the visual stimulus without microstimulation (visual stimulus coherence was 80%); magenta points represent direction estimates for trials when microstimulation was applied in combination with high coherence visual stimulus; cyan points represent direction estimates on trials when microstimulation was applied during a 0% coherent stimulus. Dashed radius represents the direction of visual motion. Solid black and cyan radiirepresent the median direction estimates for the visual and 0% coherence trials, respectively. The median direction estimate for 0% coherence trials was 17° in this experiment, and the median direction estimates for visual trials, from top to bottom, were 2, 62, 85, and 193°. F–I, Distributions of direction estimates for four visual directions from an additional experiment in another monkey (gr026j). R values are given where relevant. Median direction estimate for 0% coherence trials was 263° in this experiment, and the median direction estimates on visual trials, fromtop to bottom, were 248, 152, 149, and 75°. Visual stimulus coherence was 100%.
- Fig. 6.
Quantitative test of hypotheses for 19 experiments. The abscissa is the angular difference between the electrically evoked direction (based on 0% coherence trials) and visual direction. The ordinate is the proportion of direction estimates on interaction trials (magenta points inB) that lie between the two median angles shown inB, divided by the proportion predicted by the winner-take-all hypothesis. R values were averaged within 20° bins and plotted at the angle corresponding to the center of each bin. The plot shows mean and SE of R for differences in visual and microstimulated direction of 20–160°. Thedashed horizontal line indicates the value ofR expected for a pure winner-take-all model.Asterisks indicate mean values that are significantly greater than unity (t test; p < 0.05).
- Fig. 7.
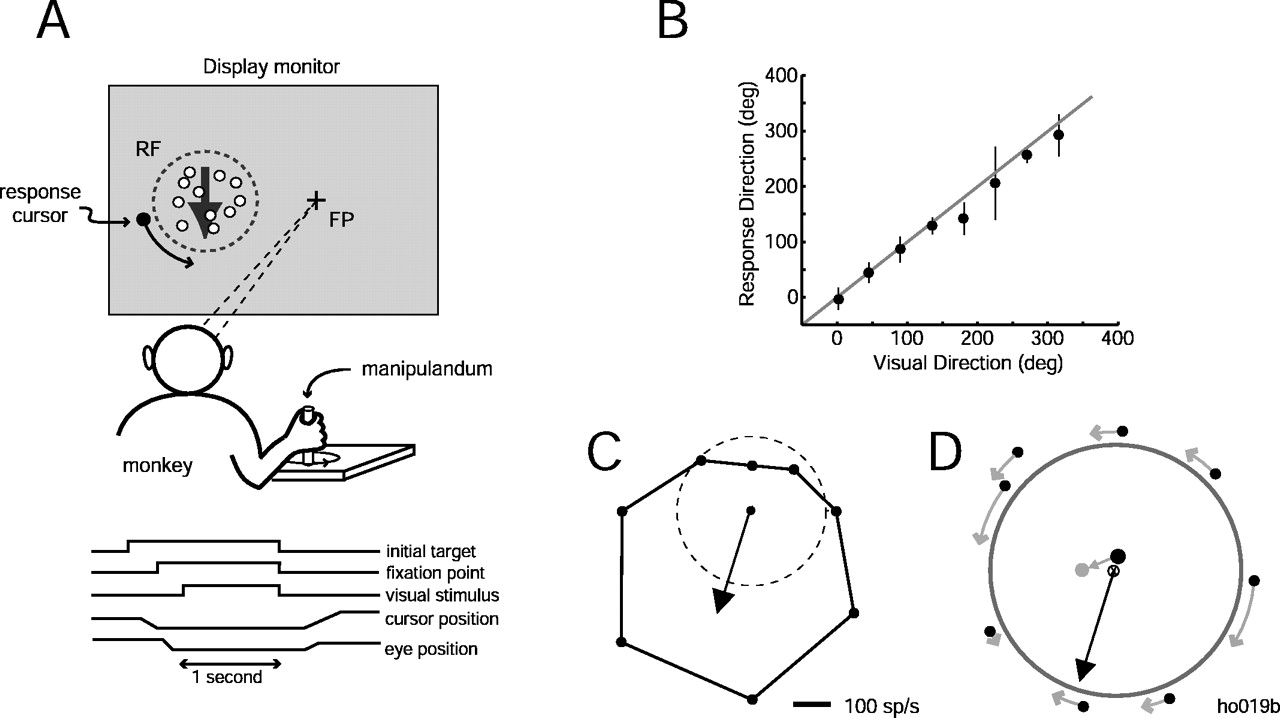
The effect of microstimulation on direction estimates in a manual response task. A, Schematized illustration of the task. A monkey is seen from behind viewing a display monitor. He directs his gaze (converging dashed lines) at the fixation point (cross) while a random dot motion stimulus is presented inside the receptive field (dashed circle) of the neurons under study. After the fixation point and the motion stimulus are extinguished, the monkey moves a manipulandum to position the response cursor (black disk) in the direction of motion of the stimulus. B, Mean and circular SD of the monkey's direction estimates as a function of the direction of the visual stimulus in the absence of microstimulation.C, Multiunit direction tuning curve for this stimulation site. The arrow indicates the preferred direction based on a Gaussian fit to the data. D, Effect of microstimulation on manually reported direction estimates. Eachblack point around the circumference of the circle represents the mean direction estimate for one of eight possible directions of motion on nonstimulated trials in this experiment.Light gray arrows indicate the direction and amplitude of the effect of microstimulation on those mean direction estimates. The black point and the gray point in themiddle of the circle indicate the center-of-mass of the directional judgments on nonstimulated and stimulated trials, respectively (as in Fig. 3). The radial black arrowindicates the multiunit preferred direction.


