

Article Figures & Data
Figures
- Fig. 1.
Extracellularly recorded activity of NRT neurons during SWDs. A1, The very occasional single spike firing of this unit (bottom trace), recorded in the rostral pole of the NRT (filled circle inA2, schematic horizontal plane drawing), becomes a high-frequency burst pattern concomitantly with the appearance of the first spike–wave complex in the EEG (top trace). The burst firing continues for the entire duration of the SWD, matching all but one spike–wave complex. A marked single spike and burst are enlarged in C and D, below.A3, A power spectrum shows the dominant frequency (indicated) of the SWD in A1. B, The background firing of this unit (a mixture of single spikes and short bursts) is transformed to high-frequency bursts after four spike–wave complexes are visible in the EEG (top trace). Marked firing before and during the SWD is enlarged in E andF, below. Time calibration in B andF also applies to A1 andC–E, respectively. AM, Anteromedial thalamic nucleus; AV, anteroventral thalamic nucleus;nRT, thalamic reticular nucleus; PT, parathenial thalamic nucleus; Re, reunions thalamic nucleus; sm, stria medullaris. Anteriority relative to the interaural line is indicated (Paxinos and Watson, 1986). In this and all following figures, the top trace in each pair is the EEG, and the bottom trace is the simultaneously recorded extracellular or intracellular voltage (unless stated otherwise).
- Fig. 2.
Properties of extracellularly recorded high-frequency burst firing in single NRT neurons during SWDs.A1, Latency of five bursts (from the same SWD) to the peak negativity of the spike component in the EEG (superimposed records in top trace). A2 andA3, Histogram (gray bars) and Gaussian–Laplace distribution (black line) show the latency (Δt) of the first and all action potentials, respectively, in a burst to the peak negativity of the EEG spike (taken as time 0, see A1) (n = 450 bursts from 9 U; bin size, 5 msec). The vast majority (98%) of bursts start before the EEG spike (A2), and >73% of all action potentials occur before the EEG spike (A3).B1, Instantaneous frequency plot shows the accelerating–decelerating pattern for 50 bursts from the unit shown inA1. B2, Average instantaneous frequency plot for the same 50 bursts as shown in B1.
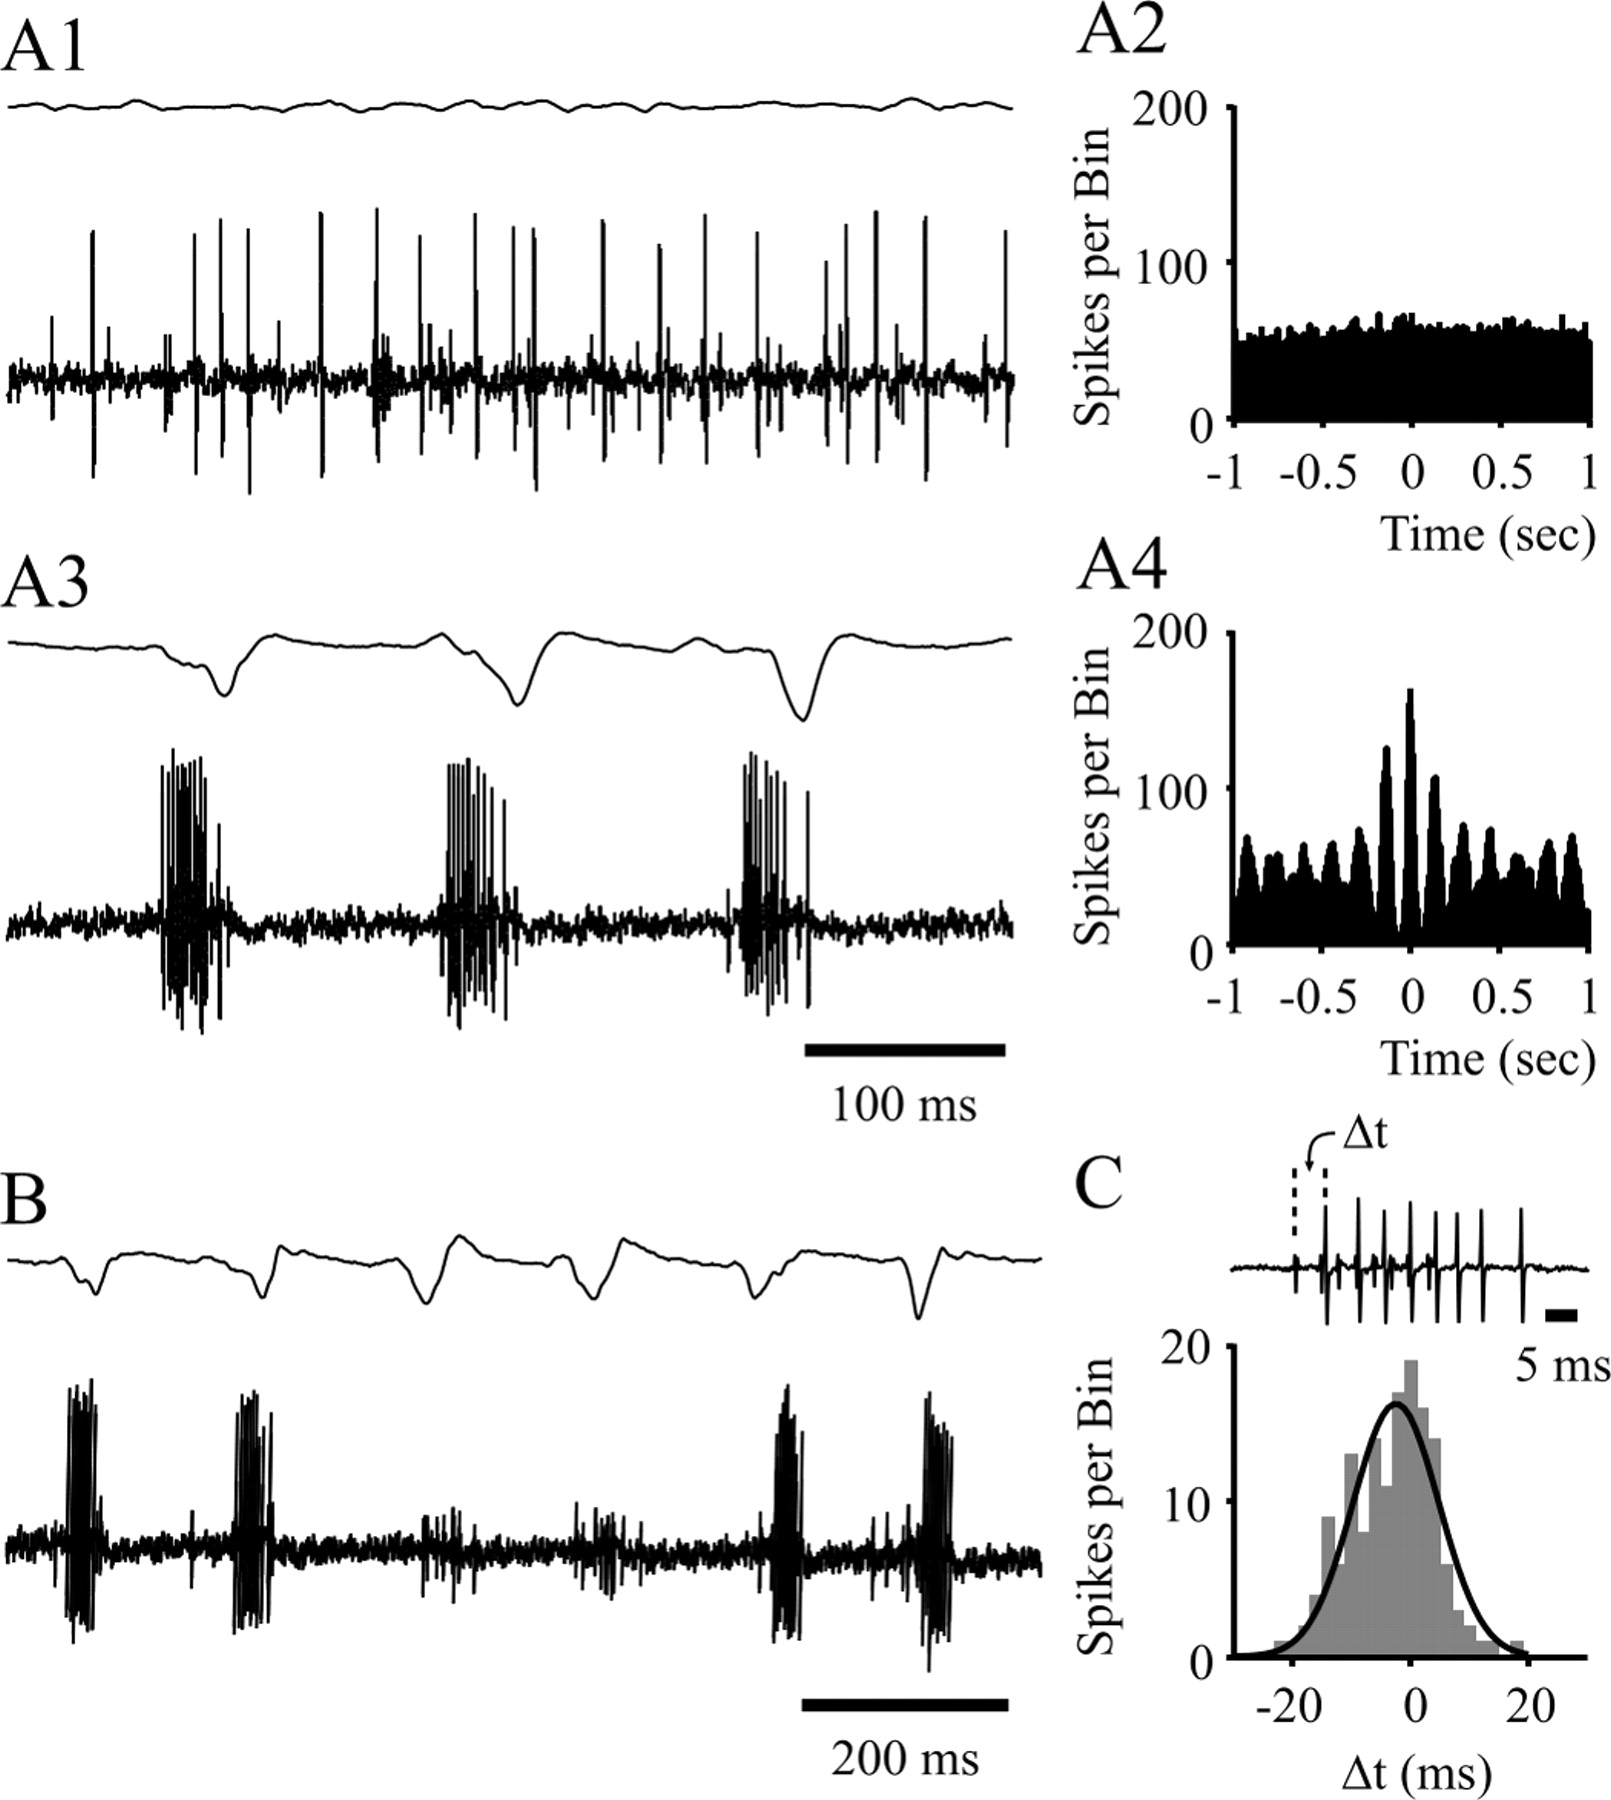
- Fig. 3.
Firing properties in extracellular double-unit recordings during SWDs. The randomly occurring single or double action potentials in the two units (A1) become a high-frequency burst pattern, tightly correlated with the spike component of the spike–wave complexes during a SWD (A3). The synchronized firing of the two units during SWDs is evident from the comparison of the cross-correlation plots before (A2) and during (A4) SWDs (bin size, 5 msec; 10 sec sample). B, Absence of burst firing in one unit during two consecutive spike–wave complexes, whereas the other unit continues unabated to show the prolonged burst firing in correspondence to the spike–wave complexes. C, Histogram (gray bars) and Gaussian–Laplace distribution (black line) show the relative timing (Δt) between the first action potentials of concomitantly occurring bursts (see inset) in two units (n = 150 bursts from 3 double units; bin size, 2 msec). Time calibration in A3 also applies to A1. A and B are from the same double-unit recording.
- Fig. 4.
Intracellularly recorded activity of NRT neurons during SWDs. A, The occasional firing (single or double action potentials, enlarged in B) of this neuron becomes a high-frequency burst pattern (enlarged in C) during a SWD. D, The background firing of this neuron (a mixture of single action potentials and short, relatively low-frequency bursts) also changed to high-frequency bursts during the illustrated SWD. Marked firing before and during the SWD is enlarged in Eand F. Dashed lines in B,C, E, and F correspond to the indicated membrane potentials. Calibrations in A andF also apply to D and B,C, E, respectively.
- Fig. 5.
The start of a SWD. A1, A typical example of the start of a SWD shows a clear hyperpolarization (filled arrowhead) leading to a small-amplitude LTCP. Subsequent LTCPs quickly grow in amplitude, and prolonged bursts are evident at the same time that the first clear spike–wave complex appears in the EEG. Note that the most hyperpolarized potential during the SWD is already achieved by the trough that follows the first LTCP. Steady hyperpolarization of the neuron to −82 mV by DC injection almost abolishes this hyperpolarization (A2), whereas additional steady hyperpolarization (A3) does not produce any additional change. B1, Another example of the hyperpolarization (filled arrowhead) that is present at the start of a SWD, where strong and prolonged burst firing is reached by the second LTCP. B2, B3, In the absence of any SWD in the EEG, hyperpolarization (open arrowhead) with properties similar to the one present at the start of the SWDs is often recorded at resting membrane potential, after either a period of electrical silence (B2) or a short low-frequency burst (B3). Superimposition of the traces inB1 (black) and B2(gray) (B1+2) and superimposition of the traces in B1(black) and B3(gray) (B1+3) highlight the similarities between the hyperpolarization that is present at the start of a SWD and the one that does not lead to any paroxysmal activity.Arrows in B1–B3 indicate −60 mV. Action potential height in B1+2 and B1+3 has been truncated for clarity. Calibration in A1 also applies to A2, A3, andB1–B3.
- Fig. 6.
Interruption of high-frequency burst firing during SWDs. Intracellular (A1) and extracellular (B1, single unit; C1, double unit) recordings during the early part of SWDs indicate that the characteristic high-frequency burst firing is replaced by periods of single/double action potentials or short bursts. The EEG before and during this interruption generally has a higher frequency and smaller amplitude spike–wave complexes than the fully developed paroxysm. The intracellular records (A1 and A2) show that these periods of tonic/short burst firing are generated by a slowly decaying depolarization similar to the one observed at the end of a SWD (compare Fig. 7A,B). The multiunit recording inC shows both units to simultaneously stop and later restart their high-frequency burst firing. A2,B2, and C2 are enlargements of a portion (arrows) of A1, B1, andC1, respectively. Dashed lines inA1 and A2 correspond to the indicated membrane potentials. Voltage calibration in A2 also applies toA1; time calibration in C1 andC2 also applies to A1, B1 and A2, B2, respectively.
- Fig. 7.
End of a SWD and short intracellular paroxysms in the absence of SWDs. A, B, Two SWDs from two neurons that had different resting membrane potentials (indicated) show that the slowly decaying depolarization is more clearly visible at more negative potentials. Note the higher firing rate of single action potentials at the end of the SWD shown in A.Dashed lines in A, B, andC1 correspond to the indicated membrane potentials.C1, A short intracellular paroxysm is depicted, whereas the EEG shows no SWDs. The evolution of the voltage waveform carries the same characteristics as those present during a SWD [i.e., the hyperpolarization (arrowhead) present at the start, the quick instatement of high-frequency bursts, and the higher-frequency, single action potential firing (between arrows) at the end]. The slowly decaying depolarization becomes visible when the neuron is hyperpolarized (C2), before becoming smaller with additional steady hyperpolarization (C3).Dashed lines in C2–C3 indicate the membrane potential before the intracellular paroxysm. Calibrations inB also apply to A andC1–C3.
- Fig. 8.
Properties of LTCPs during SWDs. A, LTCPs and associated high-frequency bursts of action potentials recorded during SWDs at resting membrane potential (A1) and at two hyperpolarized levels achieved by the injection of DC (A2, −0.5 nA; A3, −1 nA) (membrane potential before the SWDs is indicated by an arrow). Note the decreased duration and increased amplitude of the LTCPs for more negative values of membrane potential (LTCPs marked byasterisks are enlarged in B1).B1, A sequence of high-frequency SDPs leads to the activation of each LTCP during SWDs. (Action potentials have been truncated for clarity.) B2, Similar groups of SDPs that do not lead, however, to the activation of LTCPs, are also observed when no SWD is present in the EEG. C1, Two successive LTCPs during a SWD recorded at resting membrane potential (arrow). C2–C4, Eachpanel shows three superimposed voltage responses to current steps of −0.3 nA (C2), −0.5 nA (C3), and −0.8 nA (C4) in the absence of SWDs (same NRT neuron as in C1). Voltage excursions similar to (C2) or larger than (C3) the hyperpolarization achieved between two LTCPs during SWDs (C1) do not evoke any LTCP (number of trials indicated at the top), whereas much larger voltage responses (C4) evoke a LTCP in only 14 of 95 trials. Action potential height in C1–C4 has been truncated for clarity. Dashed lines in A1–A3,B1–B2, and C1–C4 correspond to the indicated membrane potentials. Calibrations in A3,B2, and C4 also apply toA1–A2, B1, and C1–C3, respectively.
- Fig. 9.
Activity of NRT neurons recorded intracellularly with KCl-filled electrodes. A1, Compared with the recordings with KAc electrodes (Fig. 5), NRT neurons recorded with KCl electrodes had a more depolarized resting membrane potential (arrow) and a much stronger background firing (B). During SWDs, the bursts of action potentials (C) had a lower frequency than those observed with KAc electrodes. Marked periods are enlarged in B,C, D1, and E1 below.A2, Schematic horizontal plane drawing showing the position (filled circle) of the NRT neuron from which the activity in A1 was recorded.AM, Anteromedial thalamic nucleus; AV, anteroventral thalamic nucleus; nRT, thalamic reticular nucleus; VL, ventrolateral thalamic nucleus;VM, ventromedial thalamic nucleus (anteriority relative to the interaural line is indicated). A3, Photomicrograph of the neurobiotin-injected NRT neuron inA2. Note the typical fusiform perikaryon and numerous varicose dendrites. D1, D2, Hyperpolarization (arrowheads) could be detected at the start of a SWD during recordings with KCl electrodes, both at resting (D1) and hyperpolarized (D2) (−1.3 nA) membrane potentials. The smaller size of the hyperpolarization at potentials greater than −60 mV was not peculiar to KCl recordings.E1–E3, LTCPs and associated bursts of action potentials recorded during SWD at resting membrane potential (E1) and at two hyperpolarized levels achieved by injection of −0.5 nA (E2) and −1.3 nA (E3) (membrane potential before the SWDs is indicated by an arrow). As in KAc recordings (Fig. 8), the LTCPs become larger in amplitude with steady hyperpolarization. The resting membrane potential indicated in B (arrow) also applies toC and D1. Dashed lines inE1–E3 correspond to the indicated membrane potentials. Voltage calibration in D2 also applies toB, C, and D1. Time calibration in C and D2 also applies toB and D1, respectively. Calibrations inE3 also apply to E1 andE2.
- Fig. 10.
Comparison of NRT neuron firing recorded extracellularly and intracellularly with KAc- and KCl-filled electrodes. A–D, Properties (as indicated) of burst firing during SWDs (extracellular, n = 450 bursts from 9 U; KAc, n = 234 bursts from 8 U; KCl,n = 107 bursts from 3 U). E, The instantaneous burst firing frequency (plotted by aligning the peak frequency of each burst to spike interval zero) is lower in bursts from KCl recordings (gray triangles) than KAc recordings (open squares) and extracellular recordings (filled stars) (number of observations as inA–D). Note the greater rate of change in frequency for the intervals just before and after the peak value, in particular for the KAc and extracellular recordings. F, Single action potential firing in the absence of SWDs (extracellular,n = 9; KAc, n = 7; KCl,n = 3). G, Resting membrane potential measured in the absence of SWDs (KAc, n = 12; KCl, n = 4). *p < 0.05; **p < 0.01.


