

Article Figures & Data
Figures
- Figure 2.
Vibrissae resonate. The average amplitude of vibrissa motion in response to a periodic ex vivo PZ stimulation of a C3 vibrissa from the left side of the rat face at 5 Hz intervals, 5-600 Hz. C3 displays an 11-fold amplification when driven at its FRF of 385 Hz (gray bar). The vibrissa motion and the PZ motion, when driven by a periodic input at 320, 385, and 450 Hz, are shown in the insets. Note the increase in the amplitude and the 90° phase shift at the FRF. A similar phase shift (≥25°) was observed within 10 Hz of the FRF in the majority of cases (n = 17 of 20 measurements of 10 vibrissae, in vivo and ex vivo). Gray, Stimulus wave form. Black, Vibrissa motion.
- Figure 7.
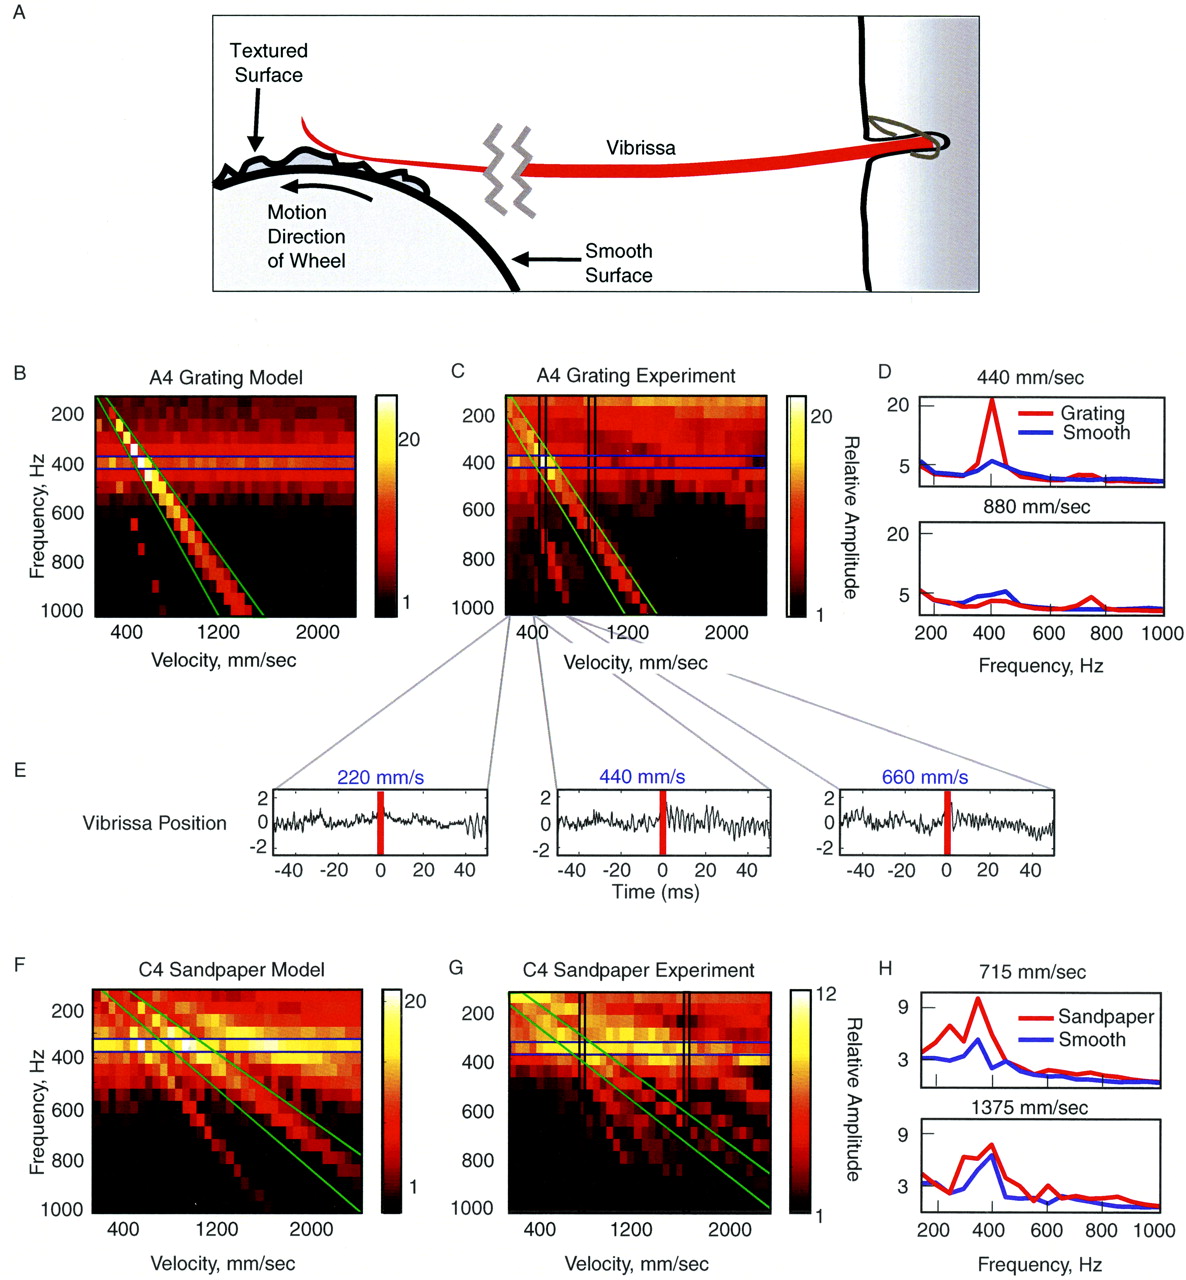
Complex textures evoke resonance in vibrissae. A, Experimental setup of the texture wheel driving vibrissa motion. Under natural conditions, rats may contact the stimulus at the tip, in the middle, or close to the base of the vibrissa (Brecht et al., 1997; Hartmann, 2001) and frequently sample textures with the vibrissae pressed against the sensory surface (one study observed typical contact points at ∼15 mm from the face) (Carvell and Simons, 1990, 1995). This stimulation emulates features of this configuration, because the vibrissae were pinned against the complex surface with a contact point on the wheel at ∼15 mm from face. B, C, The model (B) and experimental (C) measurements of the rms temporal spectra of the motion of an A4 vibrissa driven by a periodic grating at different velocities. The texture was presented at velocities from 155 to 2200 mm/sec. The brightness of the color scale represents the predicted amplitude of the motion of the vibrissa, given the texture presented at a specific velocity. C, Corresponding measurements were made with a grating mounted on a wheel and spun past an in vivo A4 vibrissa. The velocities ranged from 200 to 2000 mm/sec. Note the presence of a horizontal band (resonant motion) and diagonal bands (prominent driving frequencies of sandpaper texture) (see Materials and Methods for details). D, Amplitude temporal spectrum of the A4 vibrissa in response to the periodic grating (same as in C) and in response to a smooth texture presented by the wheel at 440 and 880 mm/sec (the measured regions are marked with vertical bands in C). E, Trace of vibrissa motion when presented with the periodic grating at 220, 440, and 660 mm/msec. Note the prominent increase in vibrissa motion at the FRF during contact with the textured stimulus (red line marks texture onset) at 440 mm/msec, at which the velocity of the grating applied the FRF to the vibrissa. F, G, The model and experimental measurements of the temporal spectra of the motion of the C4 vibrissa when presented with sandpaper (40 grit) at different velocities. Same axes as in B and C. H, Power spectra of the C4 vibrissa in response to the sandpaper and in response to a smooth texture presented (similar to D) at 715 and 1375 mm/sec (vertical bands in G).
- Figure 1.
A diagram of a TEB expressing resonance and the vibrissa sweeping past a surface. A, Left, When stimulated at frequencies lower than the FRF, TEB motion reflects the amplitude of displacement. Right, When driven at its FRF, a TEB demonstrates a significantly larger amplitude motion at its resonance mode. The increase in motion amplitude at this mode is accompanied by a 90° phase shift. Insets: gray, stimulus wave form; black, TEB motion. B, As the vibrissa sweeps past a surface, spatial frequency components in the surface exert a time-varying force on the vibrissa, causing it to deflect at specific temporal frequencies. As with the TEB motion in A, this action should induce resonance in the vibrissa. The vibrissa base is secured in the FSC. C, A diagram of the axes and directions of motion used in the model.
- Figure 3.
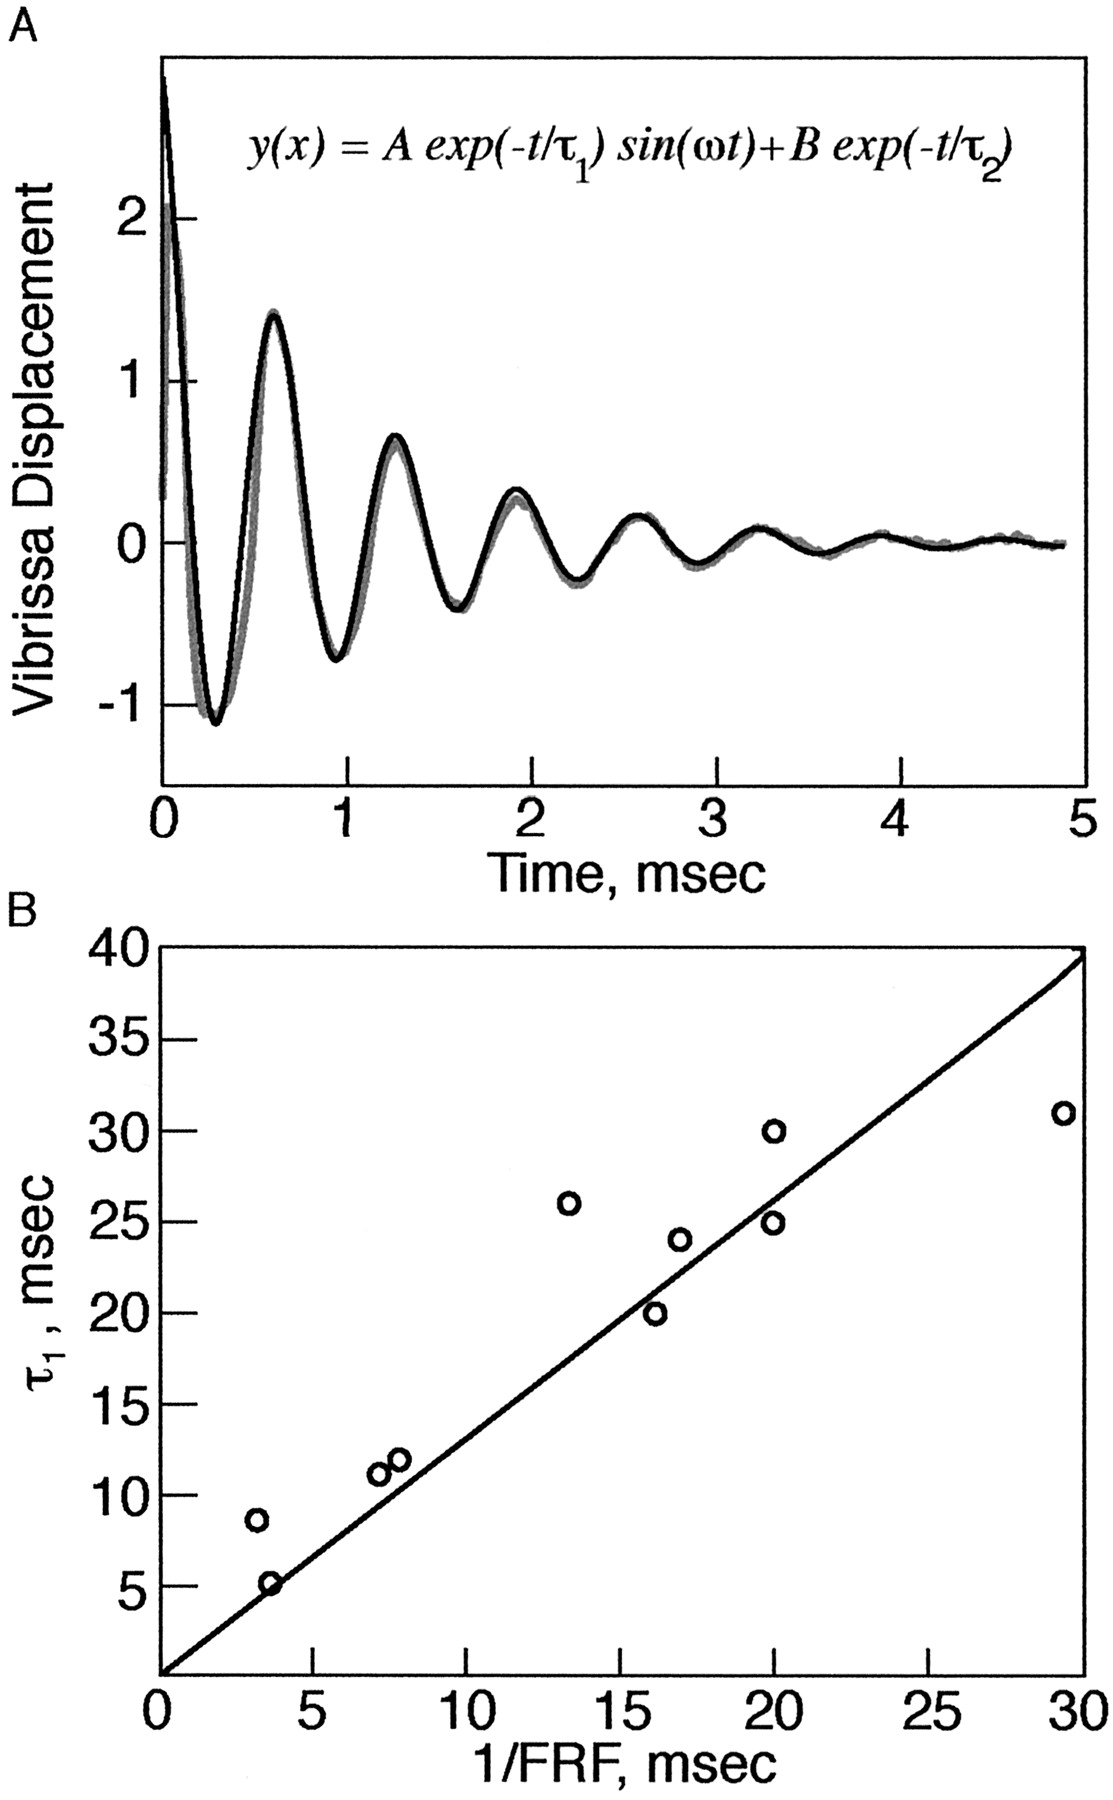
Vibrissae are underdamped. A, Motion trace of a C3 vibrissae from the right side of the face after a pulse deflection ex vivo. The vibrissa undergoes several oscillations before relaxing to the original position. Gray, Vibrissa. Black, Fit to model. Inset, Equation to fit (see Materials and Methods). B, A plot of the damping coefficients versus 1/FRF of vibrissae as measured in pulse mode, in vivo and ex vivo. Circles, Experimental results. Line, Least-squares fit. Slope of line (C) = 1.3; R2 = 0.93.
- Figure 6.
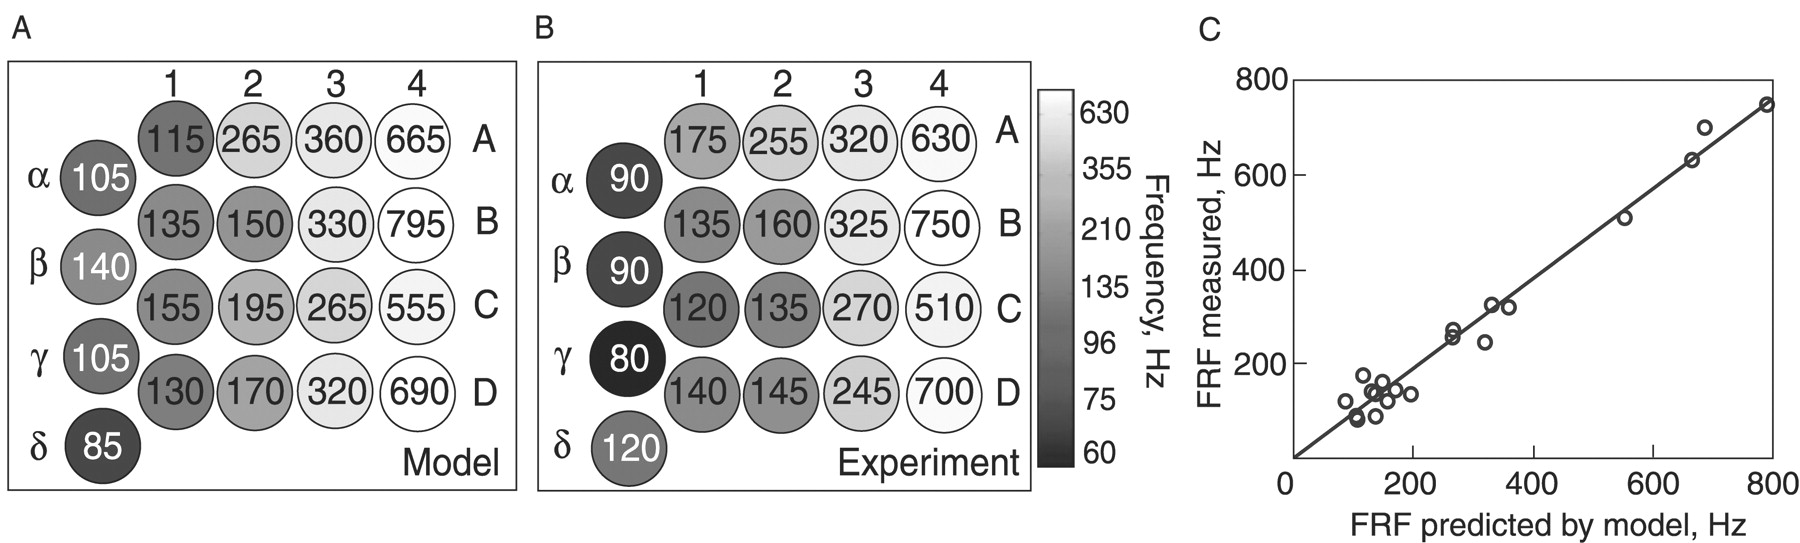
The biomechanical model of the vibrissae reliably predicts their FRF across animals. A, Color map of the PZ-mode FRFs predicted by the model for vibrissae from one rat mystacial pad, using the measurements of their rbase and L. The FRFs (in Hz) are displayed in gray scale and in inset text. Each circle represents a single vibrissa. Arcs are denoted by numerals and rows by letters. Values used for κ1 and E were extrapolated from measurements presented in Figure 5 in a different animal. B, A gray-scale map of the measured FRFs corresponding to the predictions in A (responses for in vivo PZ mode). C, Plot of the predicted versus measured FRFs from A and B (C = 0.95; R2 = 0.98).
- Figure 4.
A systematic anterior-posterior gradient of FRFs on the rat face. A, The average amplitude of vibrissa motion in response to bursts of PZ stimulation of the ex vivo β and C1-C4 vibrissae from the left side of a rat face (Table 1). B, Mean vibrissa FRFs plotted as a function of arc location (sampled from n = 8 rats, n = 61 vibrissae). Number of vibrissae per arc is shown in parentheses. Gray bars in A mark the FRF of each vibrissa. Error bars indicate SD.
- Figure 5.
Vibrissa FRF scales linearly as a function of its radius and length in PZ and pulse mode, in vivo and ex vivo. A, Plot of the FRFs measured in PZ mode from 10 C-row vibrissae in vivo (black circumference lines, open circles) and ex vivo (gray circumference lines, closed circles) versus the ratio of rbase/L2, as measured for the same vibrissae. Circles, Experimental values. Lines, Least-square fit. In vivo, C = 3.2 × 10 6 Hz · mm; R2 = 0.96. Ex vivo, C = 3.5 × 10 6 Hz · mm; R2 = 0.93. B, Plot of the FRFs measured in pulse mode from the same 10 vibrissae versus the ratio of rbase /L2. In vivo, C = 1.7 × 10 6 Hz · mm; R2 = 0.97. Ex vivo, C = 1.7 × 10 6 Hz · mm; R2 = 0.94. C, Plot of the FRFs measured in PZ mode from 10 vibrissae versus FRFs measured in pulse mode (data from parts A and B combined). In vivo, C = 1.9, R2 = 0.98. Ex vivo, C = 1.9; R2 = 0.87.
- Figure 8.
Models of vibrissae resonance in detection and discrimination. A, An idealized diagram of the spectra of vibrissae within a single row. As an ensemble, vibrissae should amplify all of the high-frequency stimuli from 50 to 700 Hz. As such, they may improve the detection of small-amplitude, high-frequency stimuli that otherwise would not drive sufficient vibrissa motion to recruit significant changes in neural activity. B, A diagram of the response of a single versus a pair of vibrissae with overlapping frequency spectra to two sinusoidal stimuli. The two stimuli are presented at frequencies f1 and f2, which are equidistant from the FRF (ω1) of vibrissa 1. The two stimuli will evoke similar responses in vibrissa 1. However, when compared across two vibrissae, the two stimuli will evoke different responses. Relatively greater neural activity should be evoked in the neural representation of both vibrissae when presented with the higher frequency (f2), whereas relatively greater neural activity should be evoked in the neural representation of vibrissae 1 in response to the lower frequency input (f1). The prediction from this schema that multiple vibrissae within the same row are required for high-frequency discrimination is well met in the psychophysical literature (Carvell and Simons, 1990) and supported by neural recordings in the periphery and barrel cortex of the vibrissae-to-barrel pathways (Andermann et al., 2002; Andermann, Neimark, and Moore, et al., unpublished observations). Gray bars mark the input frequencies f1 and f2, and filled circles indicate the evoked response amplitude for each vibrissa at these frequencies. Thin black vertical lines indicate the FRF.


Tables
Whisker L (mm) Diameter base (mm) Diameter tip (mm) Volume (mm3) Mass (mg) Density (mg/mm3) Slope of radius α 39 0.12 0.015 0.168 0.166 0.99 0.0013 β 29 0.09 0.001 0.062 0.102 1.64 0.0015 δ 58 0.17 0.005 0.452 0.623 1.38 0.0014 γ 42 0.15 0.03 0.31 0.166 0.54 0.0014 A1 47 0.12 0.012 0.20 0.29 1.48 0.0011 B1 34 0.145 0.03 0.23 0.292 1.25 0.0017 C1 26 0.09 0.025 0.075 0.118 1.58 0.0013 D1 35 0.145 0.035 0.25 0.356 1.42 0.0015 E1 36 0.155 0.025 0.27 0.358 1.33 0.0018 A2 34 0.13 0.006 0.16 0.197 1.25 0.0018 B2 24 0.085 0.035 0.071 0.118 1.64 0.0010 C2 37 0.14 0.001 0.19 0.291 1.52 0.0019 E2 38 0.18 0.005 0.33 0.411 1.24 0.0023 A3 24 0.098 0.002 0.062 0.0875 1.42 0.0020 B3 26 0.115 0.005 0.094 0.135 1.44 0.0021 C3 28 0.125 0.005 0.12 0.201 1.69 0.0021 D3 28 0.14 0.005 0.15 0.26 1.75 0.0024 E3 28 0.155 0.005 0.18 0.241 1.33 0.0027 Mean 1.4 0.0017 SD 0.6 .0004 L, Length.
Vibrissa Left in vivo Left ex vivo Right in vivo Right ex vivo Pulse mode, FRF in Hz β 34 38 75 33 C1 50 55 50 43 C2 62 72 59 76 C3 140 152 128 168 C4 276 244 310 360 PZ mode, FRF in Hz (Q factor)a β 115 (12) 105 (5.5) 120 (8) 140 (9.3) C1 165 (11) 165 (7) 145 (9.7) 205 (11) C2 160 (10.5) 150 (6.4) 120 (6) 350 (17.8) C3 275 (7.9) 385 (13.3) 310 (7.8) 295 (14.7) C4 480 (12) 565 (12.8) 585 (4.6) 510 (8.6) Summary of the FRFs and Qvalues from in vivo and ex vivo pulse mode and PZ measurements from 10 row-Cvibrissas from the two sides of the face of the same rat. FF, Fixed-fixed.
↵a Values are given for left FF in vivo, left FF ex vivo, right FF in vivo, and right FF ex vivo.


