

Article Figures & Data
Figures
- Figure 6.
P2X2 channels are the targets for ATP at interneuron synapses. A, Top left, Diagrammatic representation of the endogenous mouse P2X2 (mP2X2) locus with 11 exons. Top right, Representation of the targeted locus with exons 2-11 deleted and replaced with Neo. In both diagrams, the black bars indicate the approximate positions of the primers used for PCR analysis of tail genomic DNA, as shown in the gel to the left. Both the PCR and Southern blot (results not shown) approaches show that the mP2X2 gene is disrupted with Neo, but because we ran the PCR screen with all three primers, this approach additionally shows that exons downstream of exon 1 are deleted because no wild-type band was detected (left gel). Right gel, RT-PCR results from P2X2+/+ and P2X2 -/- mice with mRNA harvested from brain and testis. There was P2X2 mRNA in both brain and testis from P2X2+/+ mice but not from P2X2-/- mice. mRNA for β-actin (β-act) was present in both genotypes and tissues. mw, Molecular weight markers. B, C, Nissl staining in P2X2+/+ (B) and P2X2-/- mice (C). The representative voltage waveforms show responses of interneurons to depolarizing and hyperpolarizing current injections. D, EPSC frequency against time for 11 interneurons recorded from a P2X2+/+ mouse; the inset indicates that 64% of neurons responded to P2X activation in this mouse. E, mEPSC frequency against time for 13 interneurons recorded from a P2X2-/- mouse; the inset indicates that only 15% of neurons responded to P2X activation in this mouse. F, Summary of recordings for all neurons that responded to ATPγS from seven P2X2-/- and seven P2X2+/+ mice. G, In the P2X2-/- mice, the proportion of neurons that receive P2X-modulated synapses is significantly reduced (p < 0.05). H, I, Resting membrane potentials (H) and membrane resistances (I) for P2X2-/- and P2X2+/+ mice.
- Figure 1.
Functional P2X channels are absent from CA3 somata but modulate excitatory synaptic transmission onto interneurons. A, Simplified diagrammatic representation of the hippocampus and the feedforward circuit formed between CA3 (green) and CA1 (blue) pyramidal neurons and interneurons (red). i-iv, The black traces are current waveforms (-60 mV) for ATP puffs (IATP), and the color traces are for glutamate puffs (Iglut) to CA3 pyramidal neurons (i), SR interneurons (ii), CA1 pyramidal neurons (iii), and SO interneurons (iv). IATP in stratum oriens interneurons had slow rise times (∼100s of milliseconds), whereas the Iglut was fast (rise time, <20 msec). B, Six successive images of a brain slice excited with 488 nm light with the output filtered for emission at 510 nm. The pseudocolor images show the recording electrode (top left) and interneuron filled with Lucifer yellow and the puffer pipette filled with the fluorescent ATP analog BODIPY-ATP (bottom left). ATP was puffed in the third frame. The plume of ATP spreads only ∼160 μm and is restricted to the stratum radiatum: the concentration of BODIPY-ATP beyond ∼160 μm is negligible. The last three frames show that ATP is efficiently washed away after the puff. The interval between frames was 5 sec, and the bath flow (3 ml/min) was downward. The bottom current trace is the holding current from the interneuron. There was an increase in the inward EPSCs during the ATP puff. The current recording and the image frames are not exactly time-matched but agree to within ∼5 sec, such that the six frames correspond to the current recording trace lasting ∼110 sec, shown below. Scale bar, 160 μm. C, Line profile of the plume of ATP shown in B. The peak fluorescence change decayed within a distance of ∼160 μm. D, Bar graph summarizing initial experiments with ATP puffs to interneurons. E, Top, Recording of an interneuron holding current (-60mV) before and during ATPγS application in the bath and then with ATPγS and CNQX present. The bottom plot shows the frequency of EPSCs recorded from the same cell plotted versus time. Note that all EPSCs are blocked when CNQX was applied.
- Figure 4.
Mechanism for P2X modulation of interneuron synapses. A, Representative traces of mEPSCs before and during ATPγS application. The plots of cumulative probability ± SEM against interevent intervals (top traces, 10 msec bins) and amplitudes (bottom traces, 5 pA bins) are in the presence of TTX. B, Summary of the effects of ATP (1 mm) and ATPγS (100 μm) on synaptic transmission under various recording conditions. There were no significant differences between ATP and ATPγS.
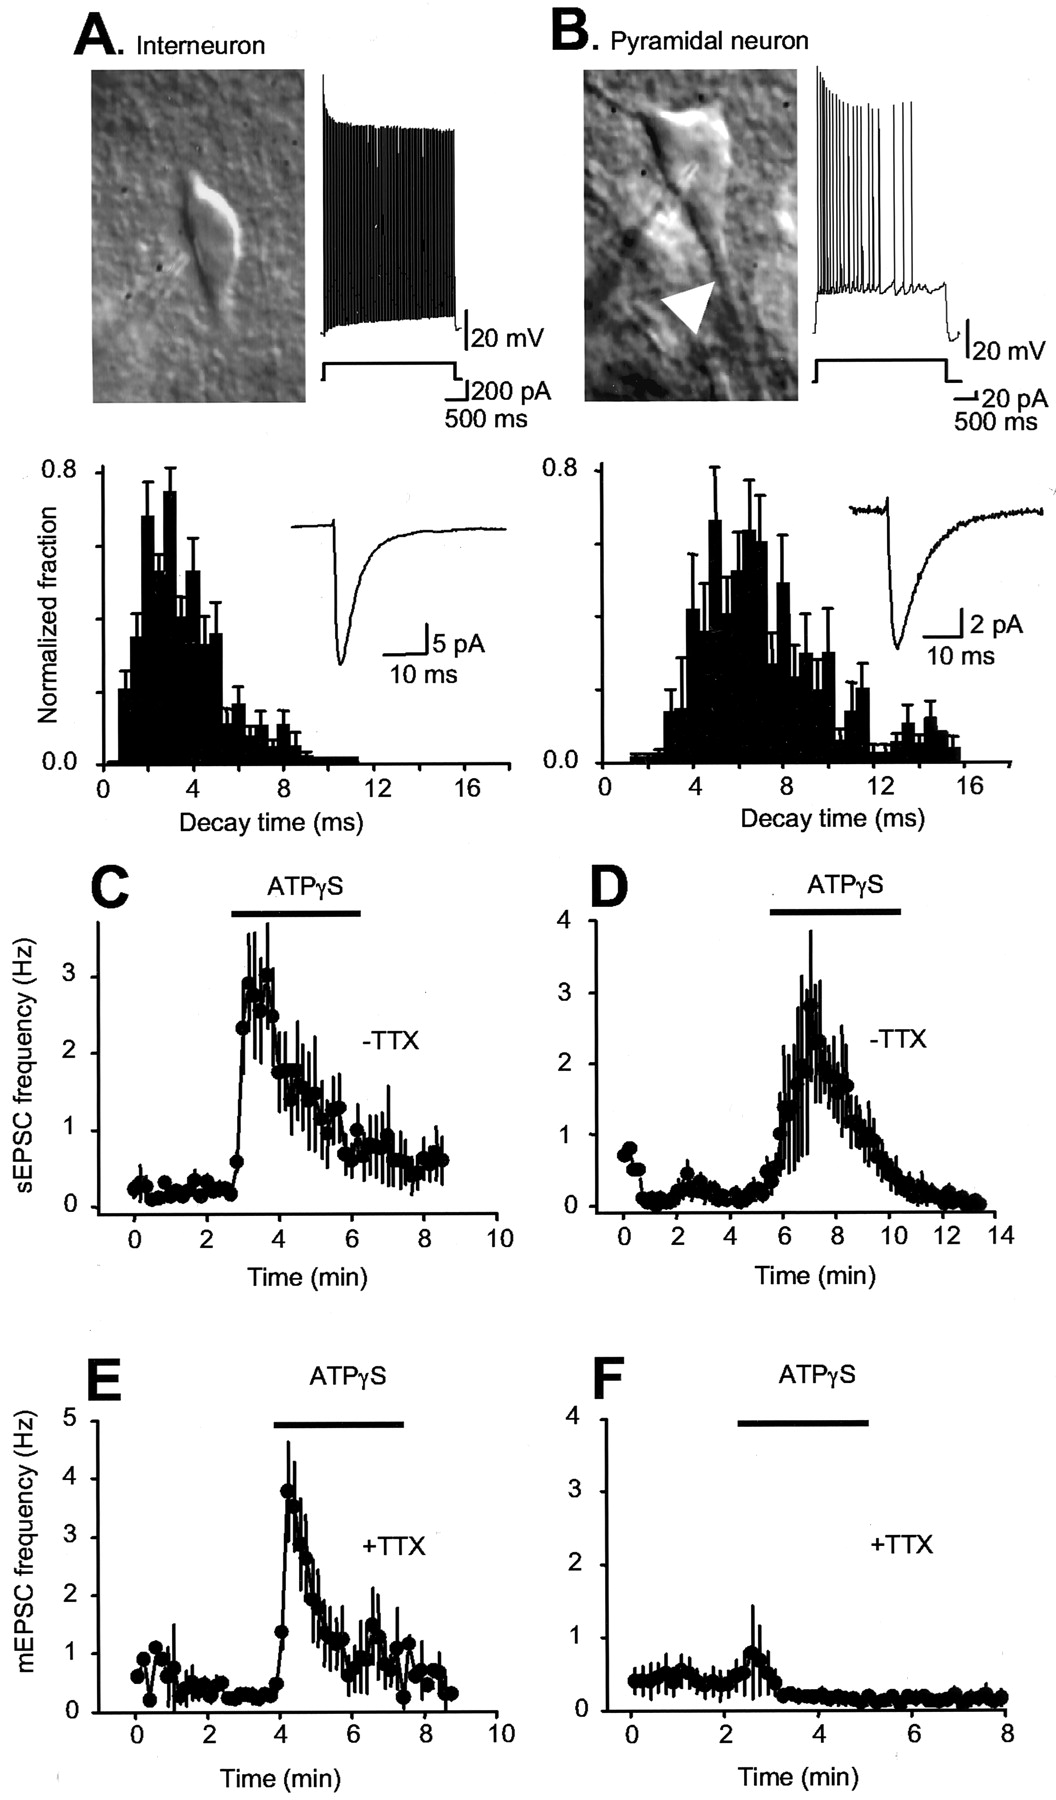
- Figure 2.
Interneuron-specific modulation by P2X channels. A, IR-DIC image of a stratum radiatum interneuron with a patch electrode approaching from the left; note the absence of thick dendrites. The right trace is a representative voltage waveform in response to a 200 pA depolarizing current injection. The upward deflections are action potentials, the frequencies of which are maintained throughout the step. The bottom plot shows the distribution of sEPSC decay times recorded from 13 interneurons, and the inset shows an average of 20 sESPCs from one interneuron. B, IR-DIC image of a CA1 pyramidal neuron with a patch electrode positioned on the soma; note the thick dendrites. The right trace is a representative voltage waveform in response to a 20 pA depolarizing current injection. The upward deflections are action potentials, the frequency of which decreases dramatically during the step. The bottom plot shows the distribution of sEPSC decay times recorded from a CA1 pyramidal neuron, and the inset shows an average of 20 sESPCs from one pyramidal neuron. We could readily discern interneurons from CA1 pyramidal neurons using infrared (775-900 nm) differential interference contrast optics on the basis of anatomical location, neuron shape, presence or lack of a thick apical dendrite, firing patterns, and decay time of sEPSCs. Pyramidal neurons accommodate on depolarizing current injection, whereas interneurons do not, and sEPSCs onto interneurons decay approximately twice as fast as those onto pyramidal neurons (3.4 ± 0.2 msec, 2369 events; n = 13; vs 7.0 ± 0.4 msec, 342 events; n = 6), possibly reflecting neuron-specific expression of distinct glutamate-gated channels (McBain and Fisahn, 2001). C, Interneuron data: sEPSC frequency over time before and during ATPγS application (n = 9). D, CA1 pyramidal neuron data: sEPSC frequency over time before and during ATPγS application (data shown for n = 4 of 17 neurons; the remaining 13 neurons did not respond; see Results). E, F, Time-resolved plots of mEPSC frequency for interneurons (E; n = 10) and CA1 pyramidal neurons (F; n = 16) before and during ATPγS application. ATPγS was applied in the bath.
- Figure 3.
ATPγS modulation of evoked and spontaneous EPSCs at interneuron synapses. A-D, Data for ATPγS application during recordings from interneurons. A, Evoked EPSCs; B, sEPSC amplitude; C, sEPSC frequency recorded simultaneously before, during, and after ATPγS application for one representative neuron. D, Representative sEPSCs. A, Inset, Representative evoked EPSCs. In each case, the bar graphs to the right show average data from all experiments of this type. In all these cases, after washing out ATPγS(∼10-20 min), we applied l-AP-4, and the effect of this agonist is illustrated in E-H. E, Evoked EPSCs; F, sEPSC amplitude; G, sEPSC frequency before, during, and after l-AP-4 application for one representative neuron. H, Representative sEPSCs. E, Inset, Representative evoked EPSCs. In each case, the bar graphs to the right show average data from all experiments of this type. a, i, b, i, c, iii, Before, during, and after agonist application, respectively.
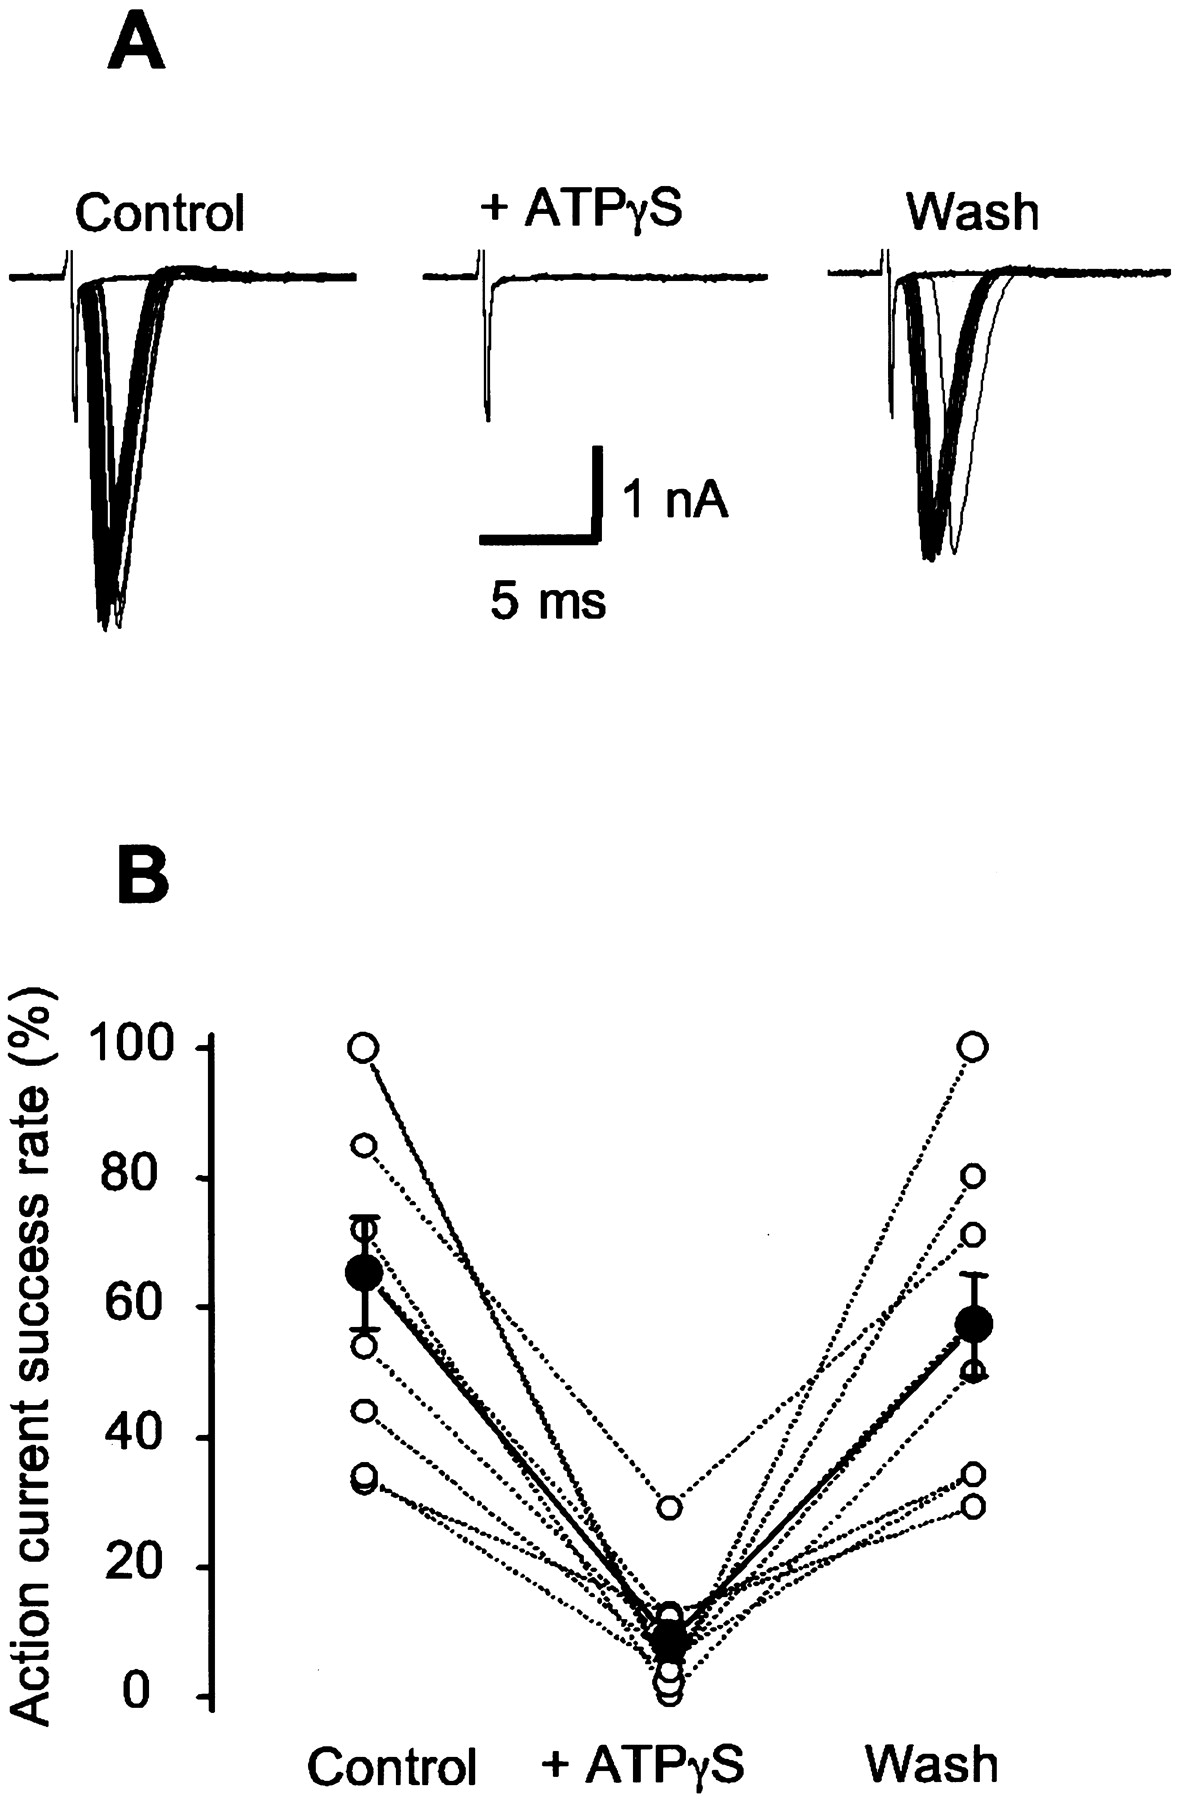
- Figure 5.
The success rate of antidromic action currents is decreased during ATPγS application. A, Representative action currents before, during, and after ATPγS application. B, Data from experiments similar to those shown in A. The filled symbols are the average, and the open symbols are the individual neurons. Action currents were evoked with a glass monopolar electrode filled with aCSF and placed in the Schaffer collaterals. We used a pulse width of 10-100 μsec and varied the stimulus strength to obtain ∼50% failures in antidromic action currents. The stimulating electrode had to be repositioned several times before an antidromic action current could be recorded in CA3 neurons.
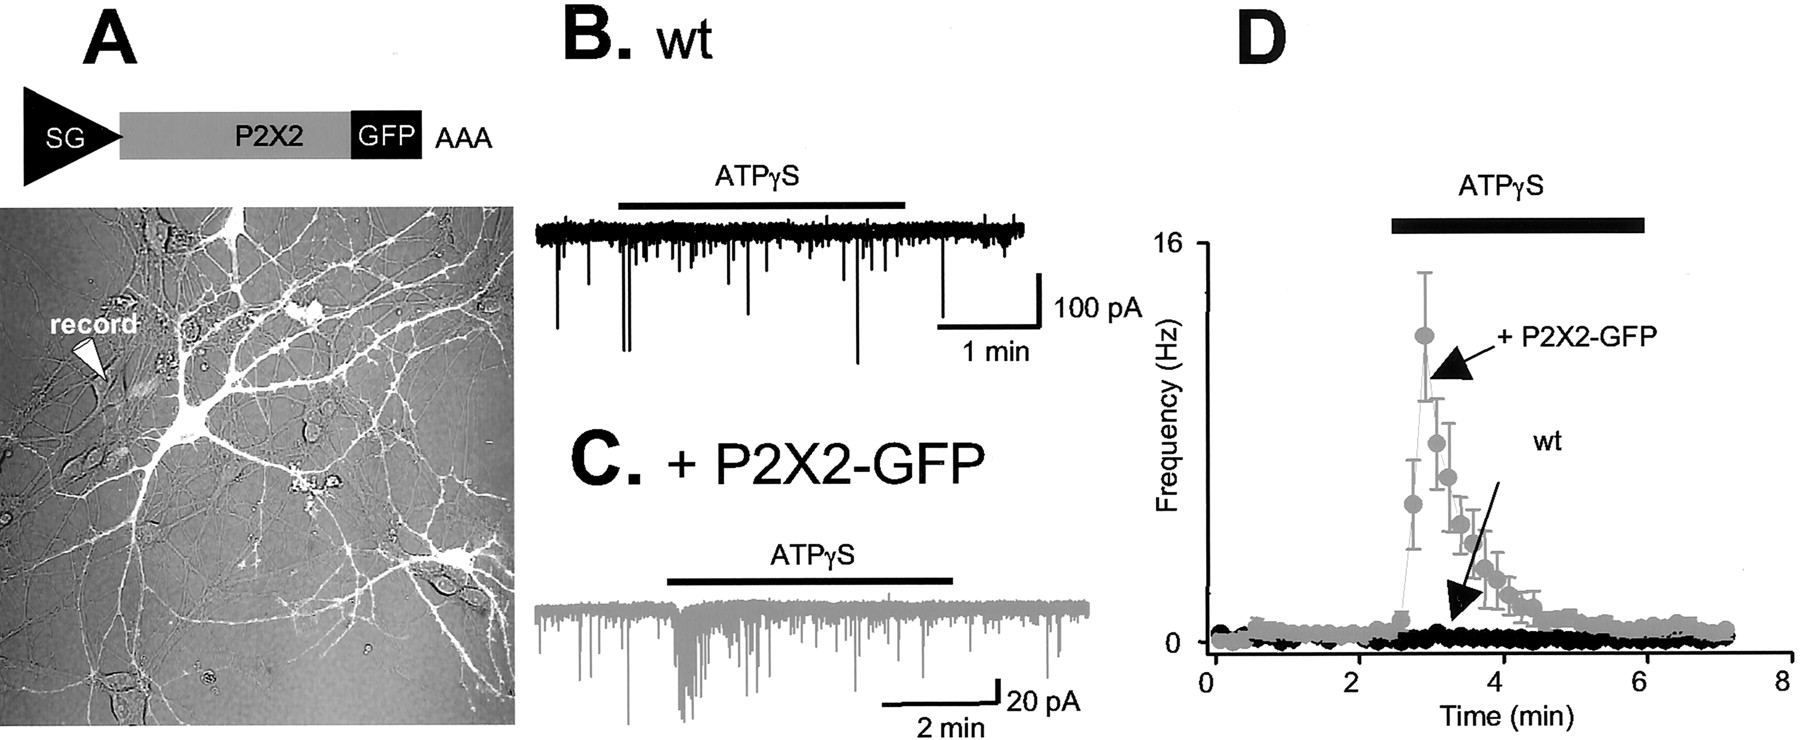
- Figure 7.
P2X2 channel overexpression endows cultured hippocampal neurons with ATP-mediated facilitation of mEPSCs. A, Top, Sindbis virus construct used to express P2X2-GFP under the control of a subgenomic promoter. Bottom, Photomicrograph showing a field of view of cultured hippocampal neurons, with the fluorescent GFP-expressing neurons shown in white. Note the mosaic infection produced by Sindbis results in some uninfected neurons surrounded by brightly fluorescing P2X2-GFP-expressing neurites. B, Current trace from wild-type (wt) uninfected neuron in the presence of TTX; note that ATPγS causes no change in the frequency or amplitude of mEPSCs. C, Current trace from a noninfected neuron surrounded by the neurites of P2X2-GFP expressing neurons in the presence of TTX. D, shows Average graph from six neurons from experiments like those illustrated in C and four neurons from experiments like those shown in B.
- Figure 8.
ATPγS does not trigger CA3 network activity, whereas CCh does. A, Representative voltage traces from extracellular field recordings in basal conditions (with no drugs added) in the presence of ATPγS (100 μm), CCh (50-100 μm), and also CCh plus TTX (1 μm). Only CCh caused oscillatory activity. B, Power spectra of 20 sec traces from the representative examples shown in A. There is a single fundamental frequency peak at 12.5 Hz in the presence of CCh. Inset, Autocorrelograms (with positive lags shown). C, Summary of all experiments like those illustrated in A and B.
- Figure 9.
ATP contributes to the facilitation of interneuron synapses that occurs during oscillations. A, Top plot, Representative current trace from an interneuron before and during the induction of CCh oscillations. Bottom plot, EPSC area (10 sec bins) over time for this neuron. B, Top plot, Representative current trace from an interneuron before and during the induction of CCh oscillations in the continued presence of PPADS (30 μm). Bottom plot, EPSC area (10 sec bins) over time for this neuron. C, Summary bar graphs for experiments like those illustrated in A and B. D, Top plot, Current trace from an interneuron before and during the induction of oscillations by CCh. Middle plot, Effect of PPADS by plotting the EPSC area (10 sec bins) over time. The bottom graphs summarize the findings from all such interneurons. E, Top plot, Current trace from a CA1 pyramidal before and during the induction of oscillations by CCh. As illustrated in the middle plot, there was little change in EPSC areas during application of PPADS. The effect of CCh was less pronounced in pyramidal neurons as compared to interneurons. The bottom graphs summarize findings from all such experiments. In A, B, D, and E, we plotted area versus time because during CCh applications, we recorded increases in sEPSC frequency and a greater number of larger-amplitude sEPSCs (see original traces in A, B, C, E). The large-amplitude sEPSCs in the presence of CCh probably arise because CA3 neurons fire action potentials during oscillations and cause release of transmitter synchronously from multiple release sites onto interneurons. PPADS clearly reduced the frequency of CCh-evoked sEPSCs (D, left graph), but although there was a trend for the sEPSCs to decrease in amplitude in the presence of PPADS, this did not reach significance (D, right graph).
- Figure 10.
PPADS reduces the power of CCh oscillations. A, Representative field potential traces and power spectra for CCh oscillations in a slice pretreated with PPADS. Inset, Autocorrelograms (with positive lags shown). B, Summary of experiments such as those illustrated in A comparing the CCh-induced oscillation frequency and power for control slices and those treated with PPADS. The recording electrode was positioned in CA3. C, Summary of all experiments like those illustrated in A and B.


Tables
- Table 1.
Little evidence for somatic fast ionotropic responses mediated by P2X channels in mouse hippocampal neurons
/glut /ATP Neurons —pA n Concentration —pA n SR interneurons 268±21 6 100 μm ATP 2.5±2.5 6 100 μm ATPγS 0±0 7 3 mm ATP (pH 5.5) 869±130 4 3 mm ATP (pH 7.4) 9.5±6.2 4 CA3 pyramidal neurons 1312±138 10 100 μm ATP 0±0 8 100 μm ATPγS 0±0 5 CA1 neurons 401±93 7 100 μm ATP 0±0 9 SO interneurons 1267±163 3 100 μm ATP 189±65 7 Glutamate puffs were generally 50 msec in duration, whereas ATP puffs were tested at 50, 500, and 5000 msec durations. ATP was ineffective for all these durations except at SO interneurons, where /ATP displayed a 10-90% rise time of 508±112 msec; hence, for these neurons, we measured peak/ATP for 5000 msec puffs, and for comparison we also puffed glutamate for the same duration (see Fig. 1A). We measured solution exchange kinetics at 4-20 msec by measuring the change in tip potential on puffing low-ionic strength solution. Moreover, in initial experiments, /glut rose with a 10-90% rise time of 17.5±3.4 msec, and the peak amplitude was constant for puffs of 50 and 5000 msec (11.7±10.1% change), suggesting that the neurons were “concentration-clamped” in a time frame approaching ∼17 msec on average. The pH of a 3 mm ATP solution in aCSF was 5.5 and resulted in large currents; however, 3 mm was ineffective when the pH was titrated to 7.4.
Value Control period (5 min) 30 mm KCl (5 min) 100 μm muscarine (5 min) TTX/100 μm muscarine (5 min) ATP bioluminescence (% initial) 100.3 ± 2.0 162.5 ± 17.0* 143.2 ± 10.4* 112.6 ± 6.1 n 8 6 5 7 There was negligible increase in the ATP-dependent bioluminescence signal over successive 5 min periods, whereas KCI caused a profound increase. Similarly, induction of spiking with muscarine significantly increased the ATP-dependent bioluminescence signal, and blocking action potential conduction abolished this effect. We chose a 5 min window to measure ATP release because the electrophysiological studies in brain slices (Fig. 9) show that the muscarine effect peaks in ∼5 min.
↵* Values were significantly different from control values as determined by an unpaired t test at p < 0.05.


