

Abstract
Hermissenda crassicornis is an invertebrate model used to study classical conditioning using light as the conditioned stimulus. The memory of the association is stored in type B photoreceptors, the output of which depends on interactions with type A photoreceptors. To understand the effect of classical conditioning on the output of type B photoreceptors in response to light, we measured the effect of light duration and intensity on membrane potential in both photoreceptor types of Hermissenda. The results show that, independent of light stimulus, the afterhyperpolarization is significantly greater in type A than in type B photoreceptors. In response to light, the generator potential (GP) rises linearly with an increase in either intensity or duration for both type A and type B photoreceptors. However, the difference between type A and type B photoreceptors depends on the time after light onset; the increase in peak GP with intensity is steeper in type A than type B, but by 14 sec after light onset, membrane potential is greater in type B than type A photoreceptors. Similarly, firing frequency increases with intensity and duration in both photoreceptor types but with a difference that is time dependent. During the first second after light onset, type A photoreceptors have a significantly higher firing frequency than type B photoreceptors; after this time, firing frequency is higher in type B than type A photoreceptors. Although membrane potential is correlated with firing frequency, this correlation is much lower in type A than type B photoreceptors, suggesting that some other conductance influences firing frequency in type A photoreceptors.
Introduction
Hermissenda crassicornis is an invertebrate model used to study classical conditioning, because it shares behavioral and biophysical properties of classical conditioning with mammals (Lederhendler and Alkon, 1989; Matzel et al., 1990). Hermissenda is classically conditioned using light as the conditioned stimulus and turbulence as the unconditioned stimulus. Before learning, naive animals exhibit positive phototaxis and contract their foot in response to turbulence; after learning, conditioned animals contract their foot in response to light. The memory of this association is stored in the photoreceptors (Crow, 1985; Farley, 1987).
Hermissenda has five photoreceptors: two type A and three type B photoreceptors in each of two eyes (Eakin et al., 1967). Synaptic interactions between type A and B photoreceptors are inhibitory, and the type B photoreceptors inhibit each other (Alkon and Fuortes, 1972). Intracellular recordings have shown that properties of and interactions between type A and type B photoreceptors are modified after conditioning.
Classical conditioning causes an increase in excitability, measured as an increase in input resistance and firing frequency in type B photoreceptors (Crow and Alkon, 1980; West et al., 1982; Farley and Alkon, 1982) and a decrease in firing frequency and input resistance in type A photoreceptors. Additionally, conditioning causes an enhancement of the PSPs produced by type B photoreceptors in type A photoreceptors (Frysztak and Crow, 1994, 1997; Schuman and Clark, 1994) and in type I interneurons (Crow and Tian, 2002). Several studies have shown that classical conditioning also causes an increase in the amplitude of the voltage-dependant K+ current in type A photoreceptors (Farley et al., 1990; Farley and Han, 1997) and a reduction in the calcium-dependent and transient potassium currents (Alkon et al., 1982, 1985) in type B photoreceptors.
The output firing patterns depend on interactions between photoreceptors, which depend on intrinsic currents. In addition to the potassium currents, there are two distinct calcium currents (Yamoah and Crow, 1994; Yamoah et al., 1998), a transient calcium current and sustained calcium current, in both photoreceptor types. Furthermore, both type A and B photoreceptors have a hyperpolarization-activated current (IH). However, in type B photoreceptors, IH has a reversal potential of -36 mV; in type A photoreceptors, IH is selective for potassium ions (Yamoah et al., 1998). The difference in IH explains the difference in spontaneous dark activity between these two photoreceptor types.
The remaining currents are light-induced currents. The type B photoreceptors have a transient sodium current and a prolonged inward current, which is a reduction in steady-state potassium currents (Blackwell, 2002). These currents shape the generator potential (GP), and their sensitivity to light intensity and duration influences type B photoreceptor activity. Until now, there have been few investigations on the effect of light intensity and duration on the light response of type A photoreceptors. Because of the mutually inhibitory interactions, the light response of the type A photoreceptor influences the output of the type B photoreceptor. To better understand their interactions, we measured the effect of light intensity and duration on both type A and type B generator potential and firing frequency.
Materials and Methods
Hermissenda were obtained from Sea Life Supply (Sand City, CA). They were housed in a low temperature aquarium (12-14°C) containing artificial seawater (ASW) in groups of six or less and maintained on a 12 hr light/dark cycle. The animals were fed one piece of cooked frozen mussel three times per week. The experiments were performed during the middle 8 hr of the light cycle.
Samples were prepared for measuring membrane potential in current-clamp mode. The circumesophageal nervous system was dissected free and placed on a glass microscopy slide within a dumbbell-shaped ring of grease. Pins were laid across the nerves exiting the ganglia to fix the nervous system in place. To facilitate penetration of the microelectrode, the connective tissue was dissolved by incubating with Protease (10-14 U/ml for 7-8 min; type XXIV and VIII temperature, 20°C; type IX temperature, 25°C; Sigma, St. Louis, MO). The enzyme reaction was stopped by rinsing with 20 ml of cold ASW. During the experiment, the nervous system was continuously perfused with chilled (18°C) ASW plus 4 mm glucose. ASW contained (in mm): 430 NaCl, 10 KCl, 10 CaCl2, 50 MgCl2, and 10 HEPES-Na, adjusted to pH 7.6, with HCl.
The light stimulus was provided via a fiber optic bundle aimed at the nervous system. The light source was a tungsten bulb filtered through a Kodak (Rochester, NY) Wratten filter 47 (passband, 380-520 nm), resulting in an intensity of 400 μW/cm 2 [measured with a Tektronix (Wilsonville, OR) J17 photometer] when no neutral density filter (normalized intensity, 1.0) was used. Light duration between 30 msec and 3 sec was controlled with a computer-controlled shutter. The intensity of the light was controlled with neutral density filters, producing scaled intensities of 0.1, 0.01, and 0.001.
Types A and B photoreceptors were impaled with aluminosilicate glass micropipettes pulled to a resistance between 30 and 40 MΩ when filled with potassium acetate. After adapting in the dark for 10 min, input resistance, resting potential, and response to a full intensity 30 msec light were measured. Only those photoreceptors meeting the following criteria were accepted for additional experiments: input resistance >15 MΩ, GP >20 mV, action potential (AP) height >10 mV, firing frequency <4 Hz, and no hyperpolarization in response to light. The measurement of the light response was begun after at least 15 min of dark adaptation. To maintain dark adaptation, the interstimulus interval was 2 min for 30 and 100 msec stimuli and 3 min for 300 msec to 3 sec stimuli. Type A and type B photoreceptors were distinguished by: (1) their typical location within the eye (type A photoreceptors are located rostrally), (2) the cessation of APs immediately after light offset in type A photoreceptors, and (3) characteristic AP height adaptation seen within the first second after light onset in type A photoreceptors.
Statistical analysis was performed using the software SAS (SAS Institute, Cary, NC). The effect of cell type, duration, and intensity on membrane potential and firing frequency was assessed with the procedure GLM; significant factors were determined from the type III sums of squares (which are independent of the order of entry of factors) in all cases. The effect of cell type on afterhyperpolarization (AHP), AP height, input resistance, and resting potential was assessed with the procedure TTEST. Correlations were calculated using the procedure CORR.
Results
Physiological characteristics
Data were collected from a total of 24 cells, 12 cells for each photoreceptor type. Of those cells, eight type B and six type A photoreceptors were held long enough to collect measurements at all four intensities and at all five durations. To minimize any interaction between the time of recording and light response, half of the cells received the dimmest stimuli first, and half received the brightest stimuli first.
Table 1 lists physiological characteristics of type A and type B photoreceptors and shows that there are no significant differences for input resistance, resting potential, and GP. As reported by others, type A photoreceptors have significantly larger AP and significantly smaller dark-adapted firing frequencies. Another difference between type A and type B photoreceptors is the AHP amplitude, which is significantly larger in type A than type B photoreceptors. Similar to previous reports (Farley et al., 1990), we found no difference between lateral (n = 10) and medial (n = 2) type A photoreceptors or between lateral (n = 8) and either medial or intermediate (n = 4) type B photoreceptors with respect to input resistance, resting potential, AP height, AHP amplitude, or GP.
Physiological characteristics of type A and type B photoreceptors
Figure 1A illustrates APs and AHPs from two photoreceptors, one type A and one type B, to emphasize the differences. The AP amplitude is as large as 53 mV for type A but never >23 mV for type B photoreceptors. The AHP is as large as -10.3 mV for type A in some cells but never more than -4.2 mV for any type B photoreceptor. Furthermore, in type A but not type B photoreceptors, AHP amplitude is correlated with AP height (r = 0.77, p = 0.003 for type A; r = 0.525, p = 0.08 for type B). Figure 1B shows that a large AP is followed by a large AHP, and small APs are followed by small AHPs in type A but not type B photoreceptors.

Characteristics of APs in type A and type B photoreceptors. A, Sample of AP and AHP from a type A (left) and type B (right) photoreceptor. Both the action potential and AHP are larger in type A than type B photoreceptors. B, Scatter plot of AP height versus AHP for all cells shows that AP height is correlated with AHP for type A but not type B photoreceptors.
In Hermissenda photoreceptors, light stimulation causes a depolarization, called GP, as well as APs. Figures 2 and 3 show the light response at four intensities and three durations for one type A (Fig. 2) and one type B (Fig. 3) photoreceptors. Type A and B photoreceptors have dramatically different responses to light. Type B photoreceptors, but not type A, continue to fire long after light offset; in contrast, APs appear primarily during the first second after light onset in type A photoreceptors. Another difference in AP wave form is evident in these figures. Peak membrane potential of the AP decreases with time for the brighter stimuli in type A photoreceptors. Some characteristics of the light response are similar: for both type A and B photoreceptors, the number of APs increases with duration and intensity, and the latency decreases as intensity increases. These similarities and differences, as well as other characteristics, are discussed in detail.

Effect of light duration and intensity on membrane potential in a type A photoreceptor. A 30 msec (A), 300 msec (B), and 3 sec (C) duration are shown. The bar underneath the traces indicates light stimulus. The time scale is different in all panels. An increase in stimulus duration produces an increase in membrane potential and spike rate. An increase in intensity produces a reduction in latency and an increase in membrane potential and firing frequency. The label to the left of the trace indicates intensity.

Effect of light duration and intensity on membrane potential in a type B photoreceptor. A 30 msec (A), 300 msec (B), and 3 sec (C) duration are shown. The bar underneath the traces indicates light stimulus. The time scale is different in all panels but the same as in Figure 2. An increase in stimulus duration produces an increase in membrane potential and spike rate. An increase in intensity produces a reduction in latency and an increase in membrane potential and firing frequency.
Latency decreases with intensity
Latency, the time between light onset and membrane depolarization, increases with a reduction of intensity (F = 274; p < 0.0001). This effect of intensity is the same for both type A and type B photoreceptors. For the range of intensities tested, the change in latency is close to linear with a log change in intensity (Fig. 4A) [slope, -0.157 ± 0.010 sec/log (intensity)]. In contrast, a change in light stimulus duration does not change latency in either type of photoreceptor. Statistical analysis shows no significant effect of duration (F = 0.18; p = 0.67) or type (F = 0.95; p = 0.33).

Initial time course of GP. A, Effect of intensity on latency for both type A and type B photoreceptors. The latency decreases linearly with a logarithmic increase in intensity [slope, 0.157 ± 0.0095 sec/log (intensity)]. B, Rise time is minimally affected by intensity, duration, and type. In particular, type A rise time is completely insensitive to intensity. Type B rise time is different only for high-intensity, long-duration stimuli.
Rise time minimally affected by intensity or duration
In contrast to latency, rise time (the time from latency to peak GP) is barely modulated by light intensity or duration (Fig. 4B). In type A photoreceptors, the only significant effect is that rise time is significantly greater for long duration (1 and 3 sec) than short duration (30, 100, and 300 msec) stimuli (T = 7.43; p < 0.0001). For type B photoreceptors, a high-intensity (1.0 and 0.1) long-duration stimulus produces a significantly larger rise time compared with other stimuli (T = 11.7; p < 0.0001). Interestingly, type B photoreceptors exhibit both the longest and shortest rise times.
Peak GP depends on intensity, duration, and type
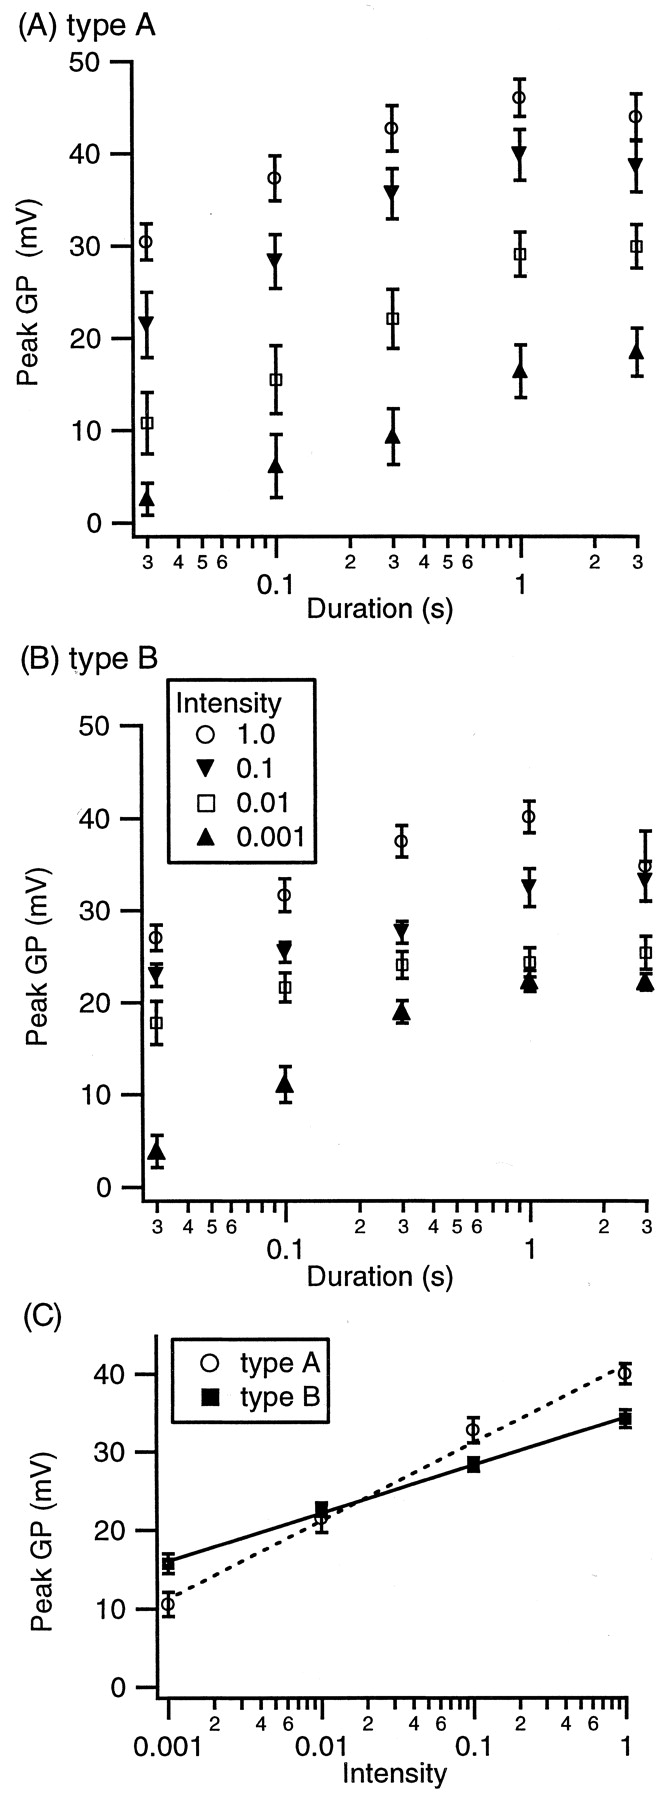
The peak GP increases with duration and intensity in both type A and B photoreceptors. The peak GP reaches a saturated level at a duration of 1 sec at all intensities and does not increase even with longer light stimuli, such as 3 sec, for both type A (Fig. 5A) and type B (Fig. 5B) photoreceptors. At all durations, the peak GP increases with an increase in intensity, although the effect of intensity appears to saturate for 3 sec stimuli. In contrast to latency, the effect of intensity on peak GP differs between type A and type B photoreceptors (Fig. 5C). At higher intensities, peak GP is greater in type A than type B photoreceptors, and at the lowest intensity, peak GP is greater in type B than type A photoreceptors (Fig. 5C).

Group effect of intensity and duration on peak GP. A, In type A photoreceptors, the peak GP rises linearly with the logarithm of both intensity and duration, but peak GP saturates at a duration of 1 sec and is not larger even with longer light stimuli. B, In type B photoreceptors, GP rises linearly with the logarithm of both intensity and duration. Similar to type A photoreceptors, the peak GP saturates at a duration of 1 sec at all intensities. C, The increase in peak GP with intensity is steeper for type A than type B photoreceptors. At the high intensities, peak GP is higher in type A than type B, but at the lowest intensity, peak GP is higher in type B than type A photoreceptors.
Statistical analysis revealed a significant effect of duration (F = 195; p < 0.0001), type (F = 2007; p < 0.0001), and the interaction term log (intensity) by type (F = 306; p < 0.0001). These three terms accounted for 0.68 of the variance. Post hoc analysis revealed that, except for an increase from 1 to 3 sec, an increase in duration produced a significant increase in peak GP (p < 0.001 for post hoc comparisons among durations <3 sec; p = 0.77 for comparison between 1 and 3 sec). The difference between type A and type B photoreceptor response to intensity was quantified by calculating the slope of peak GP versus log (intensity). The slope was 9.96 ± 0.49 mV for type A and 6.13 ± 0.44 mV for type B photoreceptors, as illustrated in Figure 5C.
Membrane potential after light offset
Membrane potential was measured at several time points (between 1 and 14 sec) after light onset. All of these values were correlated with each other and with peak GP (p < 0.0001; R between 0.26 and 0.9). We chose two time points with the lowest correlations to evaluate the time course of the GP. The two time points were 5 sec after light onset and 14 sec after light onset. Because the light duration is never >3 sec, at 5 sec after light onset, the light has been off for at least 2 sec. The transient light-induced current decayed; thus, any depolarization is attributable to the light-induced potassium current or calcium-activated currents.
Membrane potential measured 5 sec after light onset, VM (5 sec), depends on light intensity and duration. In contrast with peak GP, there are no significant differences between type A and type B photoreceptors, and the effect of intensity depends on the duration. The amplitude of depolarization increases with intensity for stimuli of duration >0.3 sec, and the increment attributable to intensity is larger with longer durations. Similarly, an increase in duration produces an increase in VM (5 sec) for durations >0.1 sec for high-intensity stimuli; but at intensity 0.001, an increase in VM (5 sec) with duration is seen only with 3 sec duration stimuli (Fig. 6A). In contrast to peak GP, VM (5 sec) does not saturate with 1 sec duration stimuli but exhibits higher values with 3 sec duration stimuli.

Effect of intensity and duration on membrane potential after light offset. A, VM (5 sec) increases linearly with duration and the logarithm of intensity. An increase in intensity has a larger effect at longer durations. B, VM (14 sec) increases linearly with duration and the logarithm of intensity. Similar to VM (5 sec), longer light stimuli are required to see an effect of duration. Statistical analysis shows no significant difference between type A and type B photoreceptors for VM (5 sec). However, VM (14 sec) is significantly greater for type B than type A at all intensities (C).
Confirming the observations above, statistical analysis revealed a significant effect of duration (F = 232; p < 0.0001), intensity (F = 9.19; p = 0.0026), and the interaction term duration by intensity (F = 37.5; p < 0.0001). These three terms accounted for 51% of the variance. Post hoc analysis revealed that the responses to short-duration stimuli (30-300 msec) did not differ significantly from each other.
Membrane potential measured 14 sec after light onset, >11 sec after light offset, is still modulated by intensity and duration. Similar to VM (5 sec), the effect of intensity and duration on VM (14 sec) is seen for long-duration stimuli only. Furthermore, stimulus duration needs to be >0.3 sec to produce an effect on VM (14 sec) (Fig. 6B). Another distinguishing characteristic of VM (14 sec) is that potential is higher in type B than type A photoreceptors, but the modulation by intensity and duration is the same for type A and type B photoreceptors (Fig. 6C).
Statistical analysis revealed that 30% of the variance is explained by four terms: type (F = 28.5; p < 0.0001), intensity (F = 11.8; p = 0.0007), duration (F = 71.7; p < 0.0001), and the interaction term intensity by duration (F = 18.6; p < 0.0001). The interaction terms with type are not significant. As seen in Figure 6C, type B photoreceptors are ∼1.5 mV more depolarized than type A photoreceptors at all intensities.
Firing frequency is affected by intensity, duration, and type
The number of APs was measured for several time periods (0-1, 1-4, and 4-26 sec) after light onset. AP counts were converted to firing frequency by dividing by the duration of the period in seconds. To evaluate the increase in firing frequency caused by light, the firing frequency during the 4 sec period before light onset was subtracted. We chose these different time periods to evaluate how the firing frequency changed over time and to compare the firing frequency with membrane potential at a related time period.
Firing frequency is higher in type A than type B photoreceptors during the first second after light onset at all but the lowest intensity (Fig. 7A). Firing frequency increases with intensity for both type A and type B photoreceptors, but type A firing frequency increases more with intensity than type B. Statistical analysis shows that the slope of firing frequency versus intensity is much steeper in type A than type B. Type A firing frequency = 23.66 + 7.37 log (intensity) Hz; type B firing frequency = 15.43 + 4.46 log (intensity) Hz. Spike rate is only weakly moderated by duration (Fig. 7B), with a significant difference between a duration of 0.03 sec and durations >0.03 sec (T = -2.98; p = 0.0032).

Firing frequency during the first second after light onset. A, Firing frequency increases with intensity but increases more steeply in type A than type B photoreceptors [slope, 23.62 + 7.38 log (intensity) Hz for type A; slope, 15.43 + 4.46 log (intensity) Hz for type B]. B, The effect of duration is small. Durations >30 msec produce higher firing frequencies than a duration of 30 msec (p = 0.0032) for both type A and type B photoreceptors.
The firing frequency between 1 and 4 sec after light onset behaves much differently than the firing frequency during the first second. Most significantly, the firing frequency for type B (6.63 ± 0.44 Hz) is greater than that for type A photoreceptors (3.16 ± 0.48 Hz; p < 0.0001) (Fig. 8B). Also, the firing frequency increases with both duration and intensity (Fig. 8A) for both type A and type B photoreceptors. Firing frequency increases ∼1 Hz with each log unit of intensity (F = 22; p < 0.0001) and by ∼2.5 Hz with each second of duration (F = 113; p < 0.0001).

Firing frequency from 1-4 sec after light onset. A, Firing frequency increases linearly with the logarithm of either intensity or duration in both type A and type B photoreceptors. B, Mean firing frequency is higher in type B than type A photoreceptors (p < 0.0001).
Firing frequency measured between 4 and 26 sec after light onset is still significantly greater than the firing frequency before the light. This long after the light stimulus, type A photoreceptors produce AP only in response to the highest light stimulation, an intensity of 1 or 0.1 and a duration of 1 or 3 sec. Firing frequency in response to these high-light stimuli is significantly different from firing frequency in response to the remaining low-light stimuli (high, 0.199 ± 0.081; low, 0.002 ± 0.002; p < 0.024) (Fig. 9B). Type B photoreceptors generate APs at a rate significantly greater than type A (Δ = -1.11; T = -10.2; p < 0.0001). In addition, type B photoreceptors remain sensitive to changes in duration (F = 81; p < 0.0001) and intensity (F = 31; p < 0.0001) (Fig. 9A). An increase in intensity produces a 0.46 ± 0.08 Hz increase in firing frequency per log unit intensity (T =-5.55; p < 0.0001); short-duration stimuli (≤0.3 sec) have lower firing frequencies than long-duration stimuli (1 or 3 sec; p < 0.0001).

Firing frequency from 4-26 sec after light onset. A, Type B photoreceptor firing frequency is still sensitive to intensity and duration. The mean frequency is significantly higher than type A photoreceptors. B, Type A photoreceptors fire occasionally for stimuli of both high intensity (1 or 0.1) and long duration (1 or 3 sec).
Additional analysis showed that the firing frequency from 0-1 sec was well correlated with the peak GP for type B photoreceptors (R2 = 0.66) but not as well correlated for type A photoreceptors (R2 = 0.40). Similarly, R2 of the correlation between firing frequency at 1-4 sec and membrane potential at 2 sec after light onset was 0.84 in type B and 0.35 in type A photoreceptors. Multiple regression of firing frequency with both membrane potential and AHP amplitude improves the R2 for type B but not type A photoreceptors. This suggests that an additional factor, unrelated to the AHP, influences type A firing frequency.
Relative light sensitivity of type A and type B photoreceptors
A common method for determining sensitivity is to calculate the light intensity at which the half-maximal response is produced (Bahner et al., 2002); however, this method uses extremely high light intensities to measure the maximal (saturating) response. An alternative method used in the present study calculates the percentage of cells responding to a 30 msec stimulus as a function of light intensity. As shown in Figure 10, type B photoreceptors respond to light stimuli 10 times lower in intensity than type A photoreceptors when a response is defined as a detectable GP (or as an increase in firing frequency up to 4 sec after light onset). This result agrees with the 10-fold difference in sensitivity reported previously (Alkon and Fuortes, 1972). However, if a response is defined as an increase in firing frequency during the first second after light onset, then type B photoreceptors are only 3 times more sensitive.

Sensitivity of type A and type B photoreceptors measured as the percentage of cells responding (to a 30 msec stimulus) as a function of light intensity. Bottom curves, Type A photoreceptors are 10 times less sensitive than type B photoreceptors when response is defined as a detectable GP. Top curves, Type A photoreceptors are three times less sensitive than type B photoreceptors when a response is defined as an increase in firing frequency during the first second after light onset.
Differences between medial and lateral photoreceptors
The responses of medial and lateral photoreceptors were compared to determine whether there were subtype differences in the response to light. No subtype differences were observed in latency, rise time, VM (5 sec), or VM (14 sec) for either A or B photoreceptors (p > 0.1122). Also, there was no subtype difference in peak VM for type A (p = 0.1171), but a significant difference for peak VM between medial-intermediate B and lateral B photoreceptors (p = 0.008) emerged. Additional analysis showed that this subtype difference was a smaller depolarization (-2.8 mV) in the response of the lateral photoreceptor to dim stimuli (p = 0.0063). The firing frequency of no medial A photoreceptors was analyzed; therefore, differences were analyzed only between the 6 lateral and 2 medial or intermediate B photoreceptors (treated as one group because of low n). Analysis showed no difference in firing frequency at any time (p > 0.1). Because we had so few medial photoreceptors (n = 2 for type A; n = 4 for type B), it is likely that the one significant subtype difference is attributable to a sampling error.
Discussion
The present study contributes to characterizing the differences between type A and type B photoreceptors in Hermissenda by measuring the effect of light duration and intensity on membrane potential and firing frequency. A surprising finding is that, independent of light stimulus, the AHP is significantly larger in type A than type B photoreceptors. Furthermore, the AHP is highly correlated with AP height in type A but not in type B photoreceptors. The results also reveal that differences in firing frequency are greater than the differences in GP.
Cause of AHP
The large AHP, seen in figures from previous studies (Alkon and Fuortes, 1972; Farley et al., 1990; Crow and Tian, 2000), is one of the most distinct characteristics of type A photoreceptors. In other neurons, both voltage- and calcium-dependent potassium currents underlie the AHP (Pineda et al., 1992; Sah and McLachlan, 1992; Martinez-Pinna et al., 2000). Three types of potassium currents, the voltage-dependent delayed rectifier (Acosta-Urquidi and Crow, 1995), transient potassium current (IA) and calcium-dependent potassium current (IKCa) (Alkon et al., 1984; Sakakibara et al., 1993), may underlie the AHP in type B and type A photoreceptors from Hermissenda. Farley et al. (1990) observed that IKCa is larger and IA is smaller in type A than in type B photoreceptors, but it is unknown whether this difference can account for the difference in AHP. The high correlation between AP and AHP amplitude suggests a second possible cause of the difference between type A and type B photoreceptor AHPs. The variation in type A photoreceptor AP and AHP may be caused by cable filtering, with a variable distance between the soma and the fast sodium channels in the neurite (Rall and Agmon-Snir, 1998).
Generator potential
The effect of light duration and intensity on GP is consistent with previous voltage-clamp measurements of the light-induced currents (Blackwell, 2002). Both studies show a decrease in latency with an increase in intensity and an increase in peak GP or peak light-induced current with an increase in intensity and duration. That study only measured currents in type B photoreceptors, but the correlation between light-induced sodium current (INalgt) and peak GP suggests that the difference between type A and type B photoreceptors is attributable to a difference in INalgt.
The difference between type A and type B photoreceptors depends on the time after light onset. Peak GP, which occurs within 1 sec of light onset, increases with intensity more steeply for type A than type B photoreceptors. Because INalgt is the predominant current at this time, it is likely that INalgt has a steeper dependence on intensity in type A than in type B photoreceptors. In contrast to peak GP, no difference between type A and type B photoreceptors was detected at 5 sec after light onset; type B photoreceptors were more depolarized than type A photoreceptors at 14 sec after light onset. Because INalgt has decayed to zero by this time, the difference is caused by either the hyperpolarization-activated current (Yamoah et al., 1998) or the light-induced potassium current, which has a very long time course in type B photoreceptors (Blackwell, 2002).
Firing frequency
Similar to the effect on membrane potential, an increase in light intensity or duration produces an increase in firing frequency. During the first second after light onset, firing frequency of type A photoreceptors is greater than that of type B photoreceptors, and it increases more steeply with intensity. After 1 sec after light onset, the pattern switches, and the firing frequency of type B photoreceptors is greater than that of type A photoreceptors. It is important to point out that type B photoreceptors fire more than type A photoreceptors at a time when there is no difference between membrane potential. If firing frequency was solely dependent on membrane potential, the correlation between the two should be very high.
The correlation between membrane potential and firing frequency was high for type B but not type A photoreceptors. Paradoxically, a large AHP is usually associated with a decrease in firing frequency (Viana et al., 1993; Pedarzani et al., 2001; Savic et al., 2001); thus, between 1 and 4 sec after light onset, the larger AHP may be inhibiting AP generation in type A photoreceptors more so than type B photoreceptors. However, this does not explain the greater firing frequency in type A photoreceptors during the first second after light onset. Interestingly, a larger AHP is associated with a higher firing frequency in neurons of the suprachiasmatic nucleus (Cloues and Sather, 2003).
Relative sensitivity of photoreceptors
A previous study of both photoreceptor types concluded that the type B photoreceptor was 10 times more sensitive to light than the type A photoreceptor (Alkon and Fuortes, 1972). The present study measured the effect of intensity on a large number of type A photoreceptors for a wide range of intensities and showed that the difference in sensitivity between type A and B photoreceptors depends on how photoreceptor response is measured. Our results replicate the previous findings when response is defined as a detectable GP. However, if response is defined as a signal that is transmitted across a synapse (which is more relevant to Hermissenda in terms of escape from predators), then an increase in firing frequency is the appropriate response measurement. In this case, type A and B photoreceptors are much closer in sensitivity.
Implications for Hermissenda vision
Both light and dark adaptation are more rapid in type A than type B photoreceptors (Alkon and Fuortes, 1972; Crow, 1985; Farley et al., 1990; Yamoah et al., 1998), and both types of adaptation are readily apparent in the response to 3 sec light stimuli (Figs. 2 and 3). The decrease in membrane potential and firing frequency during the response to a 3 sec light (i.e., light adaptation) is more rapid in type A than type B photoreceptors. Similarly, after light offset (i.e., dark adaptation), type A photoreceptor membrane potential rapidly returns to resting, and firing rapidly stops, whereas type B photoreceptors stay depolarized and continue firing for many seconds.
These response properties suggest that type A and type B photoreceptors are communicating different types of information about environmental light stimuli. The large initial firing frequency, followed by the rapid cessation of firing after light offset, suggests that type A photoreceptors are uniquely situated for signaling rapid changes in the environment. The sustained response and the sensitivity of firing frequency between 4 and 26 sec after light onset to light intensity suggests that type B photoreceptors are signaling background illumination.
Implications for classical conditioning
Comparison of the light response of type A and type B photoreceptors suggests that their interactions in response to light change dynamically over time. During the first second after light onset, type A photoreceptors inhibit type B photoreceptors because type A photoreceptors have the higher firing frequency. After the first second, the direction of inhibition switches, because type B photoreceptors have a higher firing frequency. This inhibition from type B to type A photoreceptors is probably stronger than the inhibition from type A to type B photoreceptors because, after light offset, the light-induced sodium channel closes, increasing the input resistance which increases the effect of IPSCs.
How are these dynamics changed by classical conditioning? Classical conditioning probably does not change the inhibition of type B by type A photoreceptors during the first second after the light because of the low input resistance caused by INalgt. Furthermore, changes in excitability are most evident during and after the plateau phase of the light response (West et al., 1982; Crow and Forrester, 1991). During and after the plateau phase, a facilitation of type B to type A photoreceptor PSPs (Frysztak and Crow, 1994, 1997; Schuman and Clark, 1994), coupled with an increase in type B photoreceptor firing frequency, suggests that an overall increase in type B to type A inhibition will occur, despite the decrease in input resistance of the type A photoreceptor. Also during this phase, the strength of the mutual inhibition between type B photoreceptors may increase resulting from parallel increases in firing frequency and input resistance.
The increase in mutual inhibition may be sufficient to produce bursting behavior caused by rebound firing subsequent to inhibitory potentials (Destexhe et al., 1993; Warren et al., 1994). This hypothesis is consistent with observations that burst firing after light is seen more frequently after in vitro conditioning (K. T. Blackwell, unpublished observations). Figure 11 shows the response to a 3 sec light during conditioning, taken from experiments published previously (Blackwell and Alkon, 1999). The burst-like firing pattern, seen after the fourth pairing of light and vestibular stimulation, is evident as an interruption in spike activity by periods of hyperpolarization. Although the response to a 3 sec light alone was not measured after conditioning in these experiments, previously published interstimulus interval (ISI) histograms of the light response in conditioned Hermissenda (Crow, 1985) suggest an increase in burst-like firing patterns. These histograms show an increase in variance of ISIs, which may reflect the increased irregularity produced by burst-like firing patterns. Thus, classical conditioning behavior may be caused not only by an increase in type B photoreceptor firing frequency but also by a change in type B photoreceptor dynamics from regular spiking to burst firing.
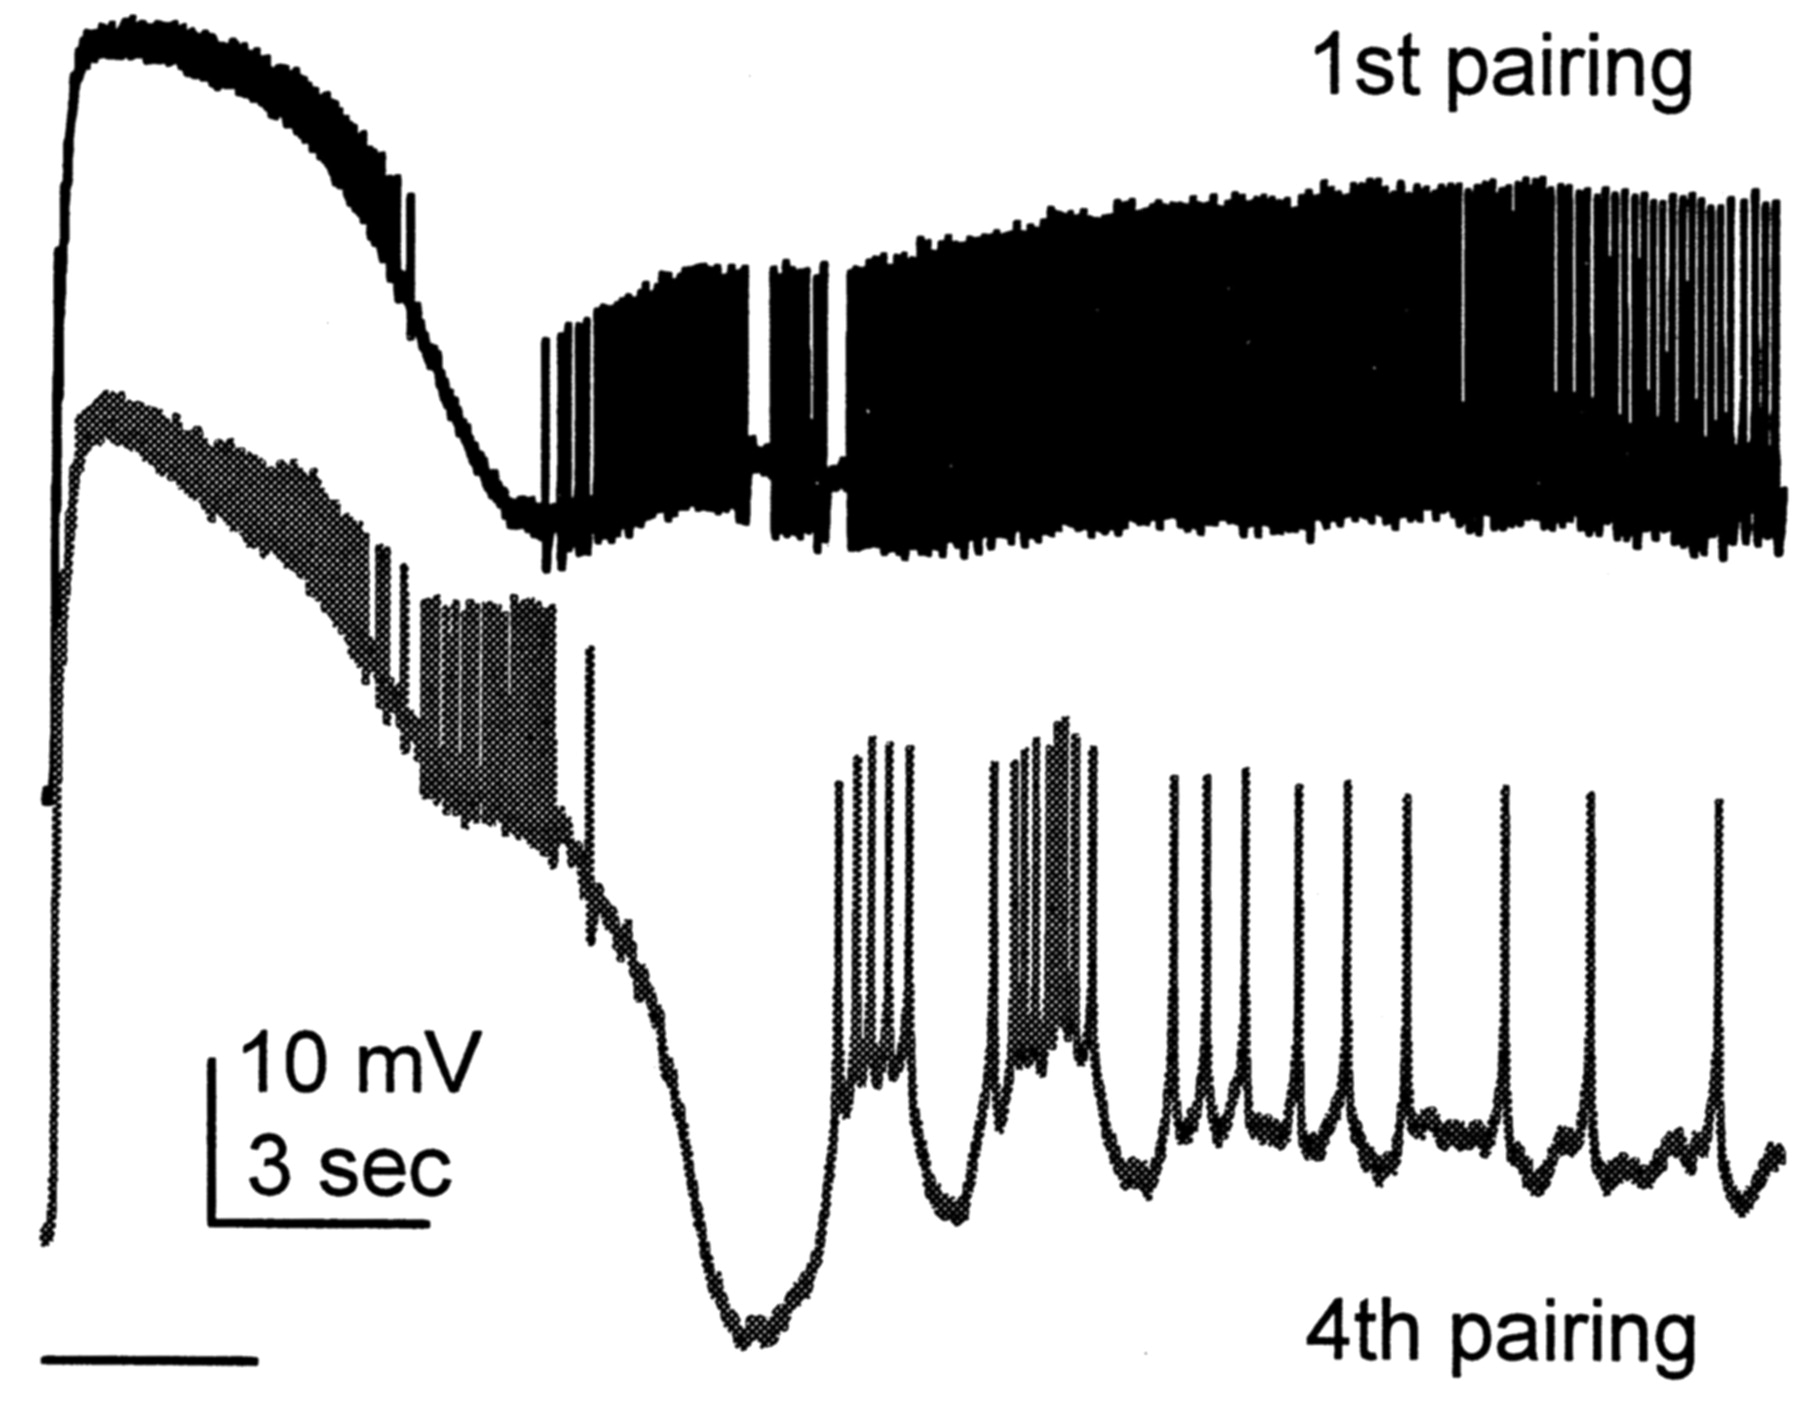
Response to 3 sec light paired with vestibular simulation during conditioning shows an increase in burst-like firing. The top trace is the response to the first pairing, and the bottom trace is the response to the fourth pairing of light and vestibular stimulation. Bar indicates time of light stimulus.
Footnotes
This study is based on work supported by National Science Foundation Grant IBN 0077509.
Correspondence should be addressed to Kim T. Blackwell, School of Computational Sciences and Krasnow Institute for Advanced Study, George Mason University, Rockfish Creek Lane, MS 2A1, Fairfax, VA 22030. E-mail: avrama{at}gmu.edu.
Copyright © 2003 Society for Neuroscience 0270-6474/03/238020-09$15.00/0


