

Article Figures & Data
Figures
- Fig. 1.
Types of neurons that were recorded in the forelimb representation of the left motor cortex (MC): CCIs [corticocortical neurons projecting to the ipsilateral primary somatosensory cortex (S1)], CCCs (corticocortical neurons projecting to the contralateral motor cortex or primary somatosensory cortex), CF6s [corticofugal neurons of layer VI projecting to ventrolateral thalamus (VL)], and CF5s (corticofugal neurons of layer V). These neuron types were identified by their antidromic responses to electrical stimulation of the corresponding structures (Stim 1 to Stim 4). SINs were identified by their high-frequency orthodromic responses to stimulation of ventrolateral thalamus or a cortical site (Stim 1 to Stim 4).Solid lines indicate the directly tested projections;dotted lines show supposed projections.
- Fig. 2.
Location of the motor limb representation in the rabbit (a typical example). A, Schematic drawing of the hemispheres (dorsal view) and the limb representations. Thedashed horizontal line indicates the zero anteroposterior coordinate. The square area shown inA is represented in B with a higher magnification to show the relative positions of motor representation of the forelimb (1), the primary somatosensory representations of the forelimb (2a) and the hindlimb (2b), as well as that of the whiskers (3).
- Fig. 3.
Characteristics of simple and complex locomotion.A, B, Body configuration in four sequential phases of the locomotor cycle (1–4) are shown for simple (A) and complex (B) locomotion. C, D, Sequential positions of the “leading” forelimb presented as stick figures for one representative step for simple (C) and complex (D) locomotion. E, F, Footprints in 20 sequential passages during simple (E) and complex (F) locomotion. Three steps in each passage are shown. Black circles indicate footprints of the leading forelimb, gray circles indicate footprints of the trailing forelimb, and bars indicate footprints of the hindlimbs. The positions of barriers 1–3 inF are shown by vertical bars. The direction of progression in C–F was fromleft to right.
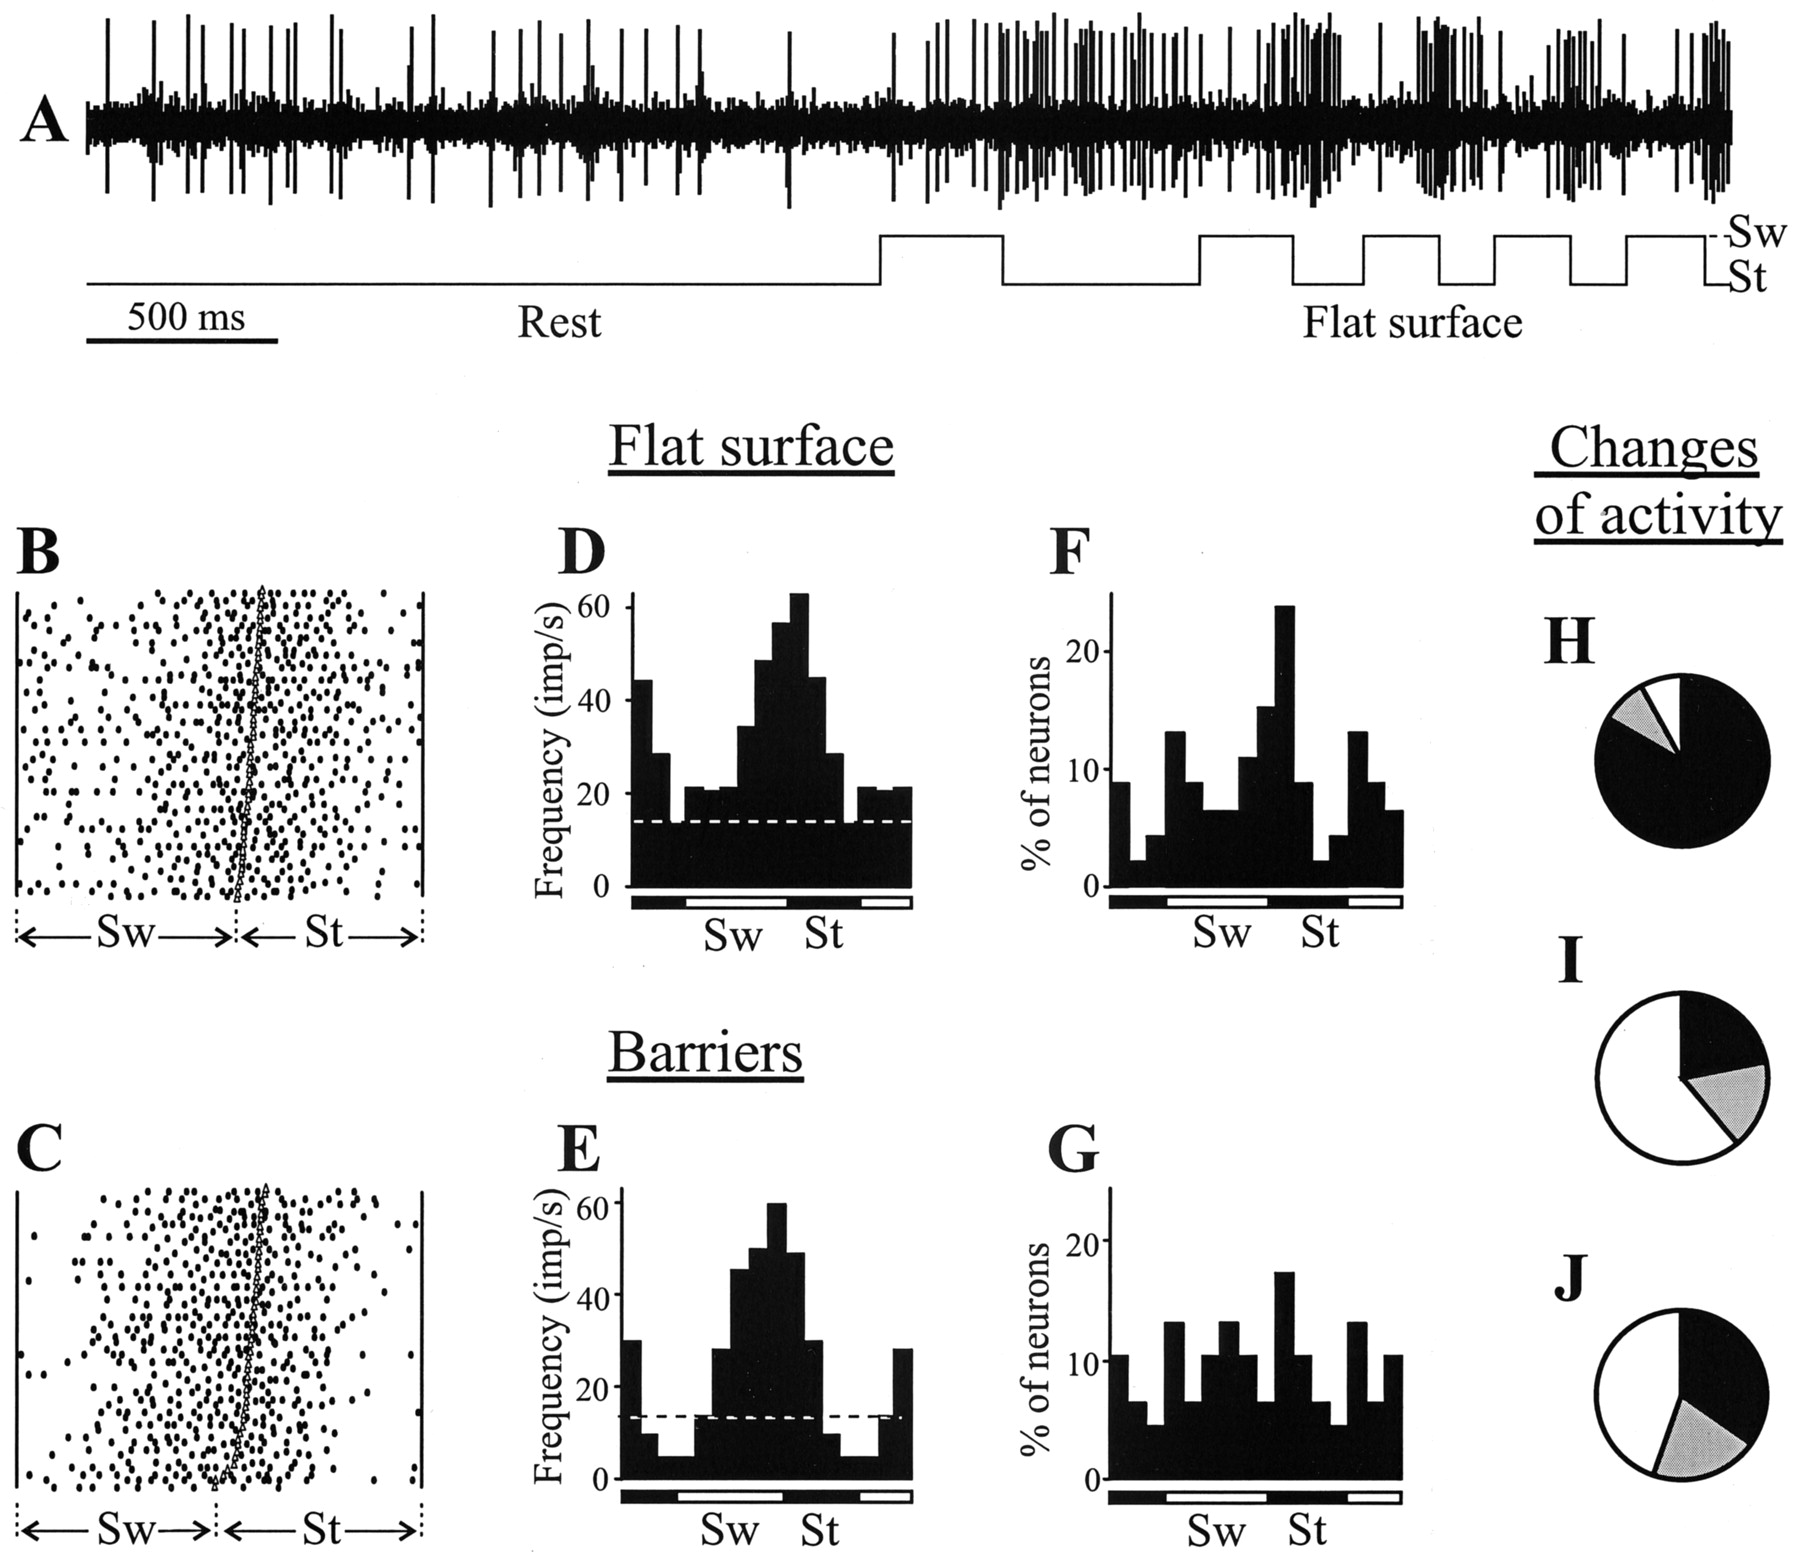
- Fig. 4.
Activity of CF5 neurons during locomotion.A, A representative record of a CF5 neuron discharge at rest and during simple and complex locomotion. The bottom trace shows the swing (Sw) and stance (St) phases of the step cycle of the forelimb contralateral to the recording site in the cortex. B, D, Activity of the same CF5 neuron during simple locomotion is presented as a raster of 50 step cycles (B) and as a histogram (D). In the raster, the duration of step cycles is normalized to 100%, and the raster is rank-ordered according to the duration of the swing phase. The beginning of the stance phase in each step is indicated by an open triangle. In the histogram, the dashed lineshows the level of activity at rest. C, E, Activity of the same neuron during complex locomotion presented as a raster (C) and as a histogram (E).F, G, Distribution of preferred phases (positions of mean vectors) of activity of all CF5 neurons in the normalized step cycle during simple (F) and complex (G) locomotion. H, I, Proportion of neurons in which the mean discharge frequency increased (black), decreased (gray), and did not change (white) on transition from rest to locomotion (H) and from simple to complex locomotion (I). J, Proportion of neurons in which the coefficient of frequency modulation increased, decreased, and did not change on transition from simple to complex locomotion; color codes are same as in H andI.
- Fig. 5.
Examples of activity of CF6 neurons during locomotion. A, Inhibition of the discharge of a neuron during locomotion. B–E, A raster and a histogram for simple (B, D) and complex (C, E) locomotion for a typical CF6 neuron are shown. Designations are as in Figure 4.
- Fig. 6.
Activity of CC neurons during locomotion.A–D, Examples of activity of one of the most active and modulated CC neurons during locomotion. A raster and a histogram are shown for simple (A, C) and complex (B, D) locomotion. E, F, Proportion of neurons in which the discharge rate increased (black), decreased (gray), and did not change (white) on transition from rest to locomotion (E) and from simple to complex locomotion (F).G, Proportion of neurons in which the coefficient of frequency modulation increased, decreased, and did not change on transition from simple to complex locomotion. Designations are as in Figure 4.
- Fig. 7.
Activity of SINs during locomotion.A, A representative record of a SIN discharge at rest and during simple locomotion. B, D, Activity of the same SIN during simple locomotion is presented as a raster of 50 normalized step cycles (B) and as a histogram (D). C, E, Activity of the same neuron during complex locomotion is presented as a raster (C) and as a histogram (E).F, G, Distribution of preferred phases (positions of mean vectors) of activity of all SINs in the normalized step cycle during simple (F), and complex (G) locomotion. H, I, Proportion of neurons in which the discharge frequency increased (black), decreased (gray), and did not change (white) on transition from rest to locomotion (H) and from simple to complex locomotion (I). J, Proportion of neurons in which the coefficient of frequency modulation increased, decreased, and did not change on transition from simple to complex locomotion. Designations are as in Figure 4.
- Fig. 8.
Characteristics of different neuronal groups.A–C, Mean discharge frequency of neurons of different groups at rest (A), during simple locomotion (B), and during complex locomotion (C). For the CF6 and CC populations, the mean rates are presented across the active cells only. D, E, Percentage of neurons in which the activity was modulated in relation to the step cycle during simple (D) and complex (E) locomotion. F, G, Mean coefficient of modulation of neurons during simple (F) and complex (G) locomotion. Note that the differences in all of the parameters between different neuronal subpopulations were similar during simple and complex locomotion.


