

Abstract
Amblyopia results in a loss of contrast sensitivity and position acuity. Here we report the results of experiments using noise to try to better understand the nature of the neural losses in amblyopia. In the first experiment, we used noise to derive the template or classification image used to detect a target and to discriminate its position. We found that some amblyopic observers show markedly abnormal templates for the position task and moderately abnormal classification images for the detection task; however, the abnormal template could not fully account for the loss of performance (efficiency). Reduced efficiency in the amblyopic visual system may reflect a poorly matched template, a high fraction of internal to external noise, or both. Comparison of the observers' performance with that of their template suggests that the amblyopes have a high fraction of internal (relative to external) noise. To analyze the internal noise further, we used a “double-pass” technique, in which observers performed the identical experiment twice. The amount of disagreement between the two experiments provides another estimate of the fraction of internal noise. Amblyopes show a much higher fraction of stimulus-dependent internal noise than do normal observers. We conclude that the loss of efficiency in amblyopia is attributable in part to a poorly matched template, but to a greater degree, to a high fraction of internal (relative to external) noise.
Introduction
Abnormal early visual experience results in dramatic deficits in the properties of neurons in cortical area V1 (Wiesel, 1982; Smith et al., 1997; Kiorpes et al., 1998) and in visual perception (Kiorpes and McKee, 1999). For example, if one eye is turned (strabismus) during early childhood, the resulting amblyopia may lead to a loss in the proportion of cortical neurons influenced by the amblyopic eye and a loss of visual acuity, contrast sensitivity, and position acuity (Hess, 1982; Levi, 1991). However, the known neural abnormalities do not fully explain the range of visual deficits (Kiorpes et al., 1998), and the precise nature of the losses is not yet fully understood.
Although the tuning properties of visual neurons in the amblyopic cortex are considered to be normal (Smith et al., 1997; Kiorpes et al., 1998), for many visual tasks, performance may be limited by the information that the observer uses to solve the task. Perceptual task performance is often modeled as the overlap of a “template” with the stimulus plus sources of internal noise (Dosher and Lu, 1999). Thus, one might hypothesize that the perceptual losses in amblyopia are a consequence of a poorly matched template or are attributable to high levels of internal noise.
Measuring human visual performance in noise can provide important insights into the neural mechanisms and computations used to solve a visual task (Dosher and Lu, 1999; Pelli and Farell, 1999; Gold et al., 2000). By keeping track of both the pattern of noise and the observer's responses on each trial, it is possible to compute the correlation between the noise and the observer's response. The result is a classification image, a “map” or spatial profile that shows which image locations influence the observer's performance. The classification image may be thought of as a behavioral receptive field (Gold et al., 2000); it is the psychophysical analog to reverse correlation methods used in the physiological mapping of receptive fields (Ringach et al., 1997; DeAngelis et al., 1999). Classification images provide a sufficiently important new tool that a special issue of the Journal of Vision has been devoted to the topic (Eckstein and Ahumada, 2002).
Classification images, first derived in audition (Ahumada and Lovell, 1971), have been derived in normal vision for detection (Ahumada and Beard, 1999), Vernier acuity (Beard and Ahumada, 2000; Levi and Klein, 2002), and illusory contours (Gold et al., 2000). Classification images have, to our knowledge, never been measured in humans with amblyopia. In the present paper, we used noise to derive the classification images used to detect a target and to discern its position in normal and amblyopic observers.
Visual performance at threshold (both psychophysical and neuronal) may also be limited by noise or variability (Parker and Newsome, 1998). By using a double-pass technique, in which the observer takes two passes through the identical stimuli and noise (Burgess and Colborne, 1988;Gold et al., 1999), we are able to determine the ratio of internal to external noise in the amblyopic visual system. Our experiments and modeling show that the reduced performance of amblyopic vision is attributable in part to a poorly matched template, but surprisingly, it is attributable to a much greater degree to a high fraction of internal (relative to external) noise.
Materials and Methods
Three normal observers and six strabismic amblyopes participated in this study. The data for the two amblyopes shown in Figures 1-4 are typical of the strabismic amblyopes. Ages ranged from 22 to 55 years. Viewing was monocular, with appropriate optical correction. All experiments were performed in compliance with the relevant laws and institutional guidelines.
Our stimuli and noise consisted of sums of sinusoids; they are described in detail by Levi and Klein (2002), along with details of the ideal observer modeling. Briefly, the test pattern is a discrete frequency pattern (DFP): a bar-like pattern (see Fig. 1a) given by contrast cos(πy)10cos(2π 6y) and composed of 11 harmonics (from 1 to 11 cycles/degree) all added in cosine phase with a spatial frequency envelope, shown in Figure 1c. The noise is a one-dimensional grating consisting of the same 11 harmonics with phases and amplitudes randomized with each harmonic having equal variance. The target and noise (see Fig. 1b) were presented for 0.75 sec, in a 1.7° square field with a mean luminance of 42 cd/m2 with a dark surround. We used a signal-detection method to measure the observers' performance (d′, which is a measure of the observers' signal-to-noise ratio) and linear regression to compute the classification coefficients (Levi and Klein, 2002). The observers' rating responses were regressed on the 11 cosine noise components for the detection task (the sine components were found not to contribute significantly) and on the 11 sine noise components for the position task. Rating-scale methods have been shown to be able to improve the quality of the classification of images (Murray et al., 2002).
To calculate the fraction (F) of internal (stimulus-dependent) noise (relative to external noise) we conducted a double-pass experiment (experiment 3). Burgess and Colborne (1988)developed this technique using a two-alternative forced-choice paradigm. We use a rating scale, single-interval variant of the technique. Our stimuli and methods were identical to those described above, except that we saved the random seed from the initial run and reused it so that the stimuli and external noise were identical in the two runs. The proportions of internal (Ni) and external (Ne) noise were obtained using Monte Carlo simulations using the same performance (d′) levels and criteria that were found in the average of the two double-pass data sets. The simulations searched for the amount of internal noise that would give us the same ratio of correlated responses found in the double-pass runs. For example, if the two runs had highly correlated responses, the internal noise would be small.
Results
Experiment 1: detecting a fuzzy bar
We asked observers to detect a fuzzy bar (the DFP) (Fig.1a) that was presented in noise (Fig. 1b). The amplitudes of the 11 coefficients of the bar stimulus are shown as the solid line in thetop row of Figure 1c. The classification coefficients (Fig. 1c), obtained using linear regression, show how each of the 11 spatial frequency components of the noise influenced the observer's rating response for the normal controls (top) and for two of the amblyopic eyes (middleand bottom). The spatial frequency tuning for our localized target is considerably broader than the tuning of spatial frequency channels derived from adaptation or masking experiments. Note that the amblyopes show a shift in the peak of their spatial frequency tuning toward lower spatial frequencies (Levi et al., 1994b), consistent with the lower spatial resolution and optimal spatial frequency tuning found in the cortex of some amblyopic monkeys (Kiorpes et al., 1998). The classification images (Fig. 1d) are the Fourier transforms of Figure 1c and represent the spatial maps or templates of the normal controls and the amblyopic eyes.

Examples of our stimuli. a, DFP.b, DFP in noise. Note that the noise was random, and varied from trial to trial. The observers' task was either to detect the DFP (experiment 1) or judge its position (high or low) relative to the bright line on the right (experiment 2). c, Classification coefficients for detection averaged across the dominant eyes of three normal observers (top) and for two amblyopic eyes (middleand bottom). The regression coefficients (symbols) correspond to the template weighting used by the observer and are plotted as a function of spatial frequency. Thesolid line in the top row shows the spatial frequency envelope of the stimulus; it corresponds to the classification image of the ideal observer. The amblyopes' coefficients have each been shifted vertically by 10 for clarity. The smooth curves are an exponentiated difference of Gaussians given byp1[exp(−p2f2) − exp(−p3f2)]p4that are the best fit to the 11 data points. p, Parameter;f, spatial frequency. An additional datum at 30 c/degree with a value of zero was added to account for the expected falloff at very high spatial frequencies. d, Classification images for detection. The dotted lines are the raw classification images averaged across the dominant eyes of three normal observers (top) and for two amblyopic eyes (middle and bottom). The solid curves are the Fourier transforms of the exponentiated difference of Gaussian curves fit to the regression coefficients inc. The ordinate has arbitrary units.RH, Strabismic amblyope; DM, strabismic and anisometropic amblyope.
Experiment 2: discriminating the position of a fuzzy bar
Humans with naturally occurring amblyopia associated with strabismus (a turned eye) are often compromised in their ability to judge changes in relative position (Levi and Klein, 1982, 1986; Hess and Holliday, 1992; Wang et al., 1998). In this experiment, we asked our observers to judge whether the DFP pattern (in noise) was higher or lower than a small bright abutting line (Fig. 1a); we measured the observer's classification images for the position task. Figure 2 shows the classification coefficients (a) and images (b) of the normal control observers and of two amblyopic observers for a 90 arc sec offset. The classification coefficients (Fig. 2a) for the amblyopic observers show a marked decrease for spatial frequencies above ∼4–5 c/degree, in contrast to the normal controls, whose coefficients increase more or less linearly up to 8 c/degree. Correspondingly, their classification images (Fig. 2b) extend over longer spatial distances than those of the normal observers. The amblyopic position template, like that of the normal parafovea (Levi and Klein, 2002), is a low spatial frequency template, reflecting a shift in the spatial scale of analysis (Levi et al., 1994b). Interestingly, a comparison of the regression coefficients for detection (Fig. 1c) and position (Fig. 2a) shows a much more severe loss in the position task. For the two amblyopes, the position coefficients are very small at >5 c/degree, whereas their detection coefficients have significant amplitudes over the entire range. This “extra” loss of position information is consistent with previous studies of amblyopic and peripheral vision (Hess and Holliday, 1992; Wang et al., 1998; Levi and Klein, 2002).

a, Classification coefficients for position (fixed offset = 90 arc sec). The 11 regression coefficients are plotted as a function of spatial frequency. Thesmooth curve is the two parameter derivative of a Gaussian (a blurred dipole) given by p1fexp(−p2f) that is best fit to the 11 data points. An additional datum at 30 c/degree with a value of zero was added to account for the expected falloff at very high spatial frequencies. Other details are as in Figure 1. b, Classification images for position (fixed offset = 90 arc sec). The dotted lines are the raw classification images averaged across normal and eyes and for the amblyopic eyes of two observers. The solid lines are the Fourier transforms of the blurred dipole curves fit to the regression coefficients in a. RH, Strabismic amblyope;DM, strabismic and anisometropic amblyope.
Do the amblyopes' templates account for their reduced performance?
We can compare our observers' performance (d′) in noise with that of an “ideal observer” (a machine that knows precisely what the stimulus is, but not what the external noise is). Figure 3a shows the performance of each observer for detection (the leftmost points) and for the position task at different offset levels. Figure 3ashows that the performance levels for detection are quite similar across observers, whereas for the position task, the amblyopic eyes are considerably worse, especially at small offsets. This reduced performance in the position task is not simply a consequence of low visibility of the pattern, because we boosted the target contrast for the amblyopic eyes for the Vernier task, to compensate for any loss of contrast sensitivity (Wang et al., 1998). The solid gray line shows the performance of the ideal observer (at the same contrast level as the normal observers).

a, Performance (d′) for position as a function of offset size. Open circlesare the means of three normal control observers; open squares are the means of the nonamblyopic eyes of the amblyopes. Solid symbols are the amblyopic eyes of RH and DM. The solid gray line shows the ideal observer's performance (calculated based on the same contrast used to test the normal observers). For the amblyopic eyes, which were tested at a higher physical contrast (but at the same multiple of the detection threshold), the ideal observer would be simply shifted upward. Thedotted gray line shows the template, derived directly from the classification coefficients, for the normal observers. Thevertical dashed line at 90 arc sec marks the offset used for Figure 2b. The leftmost points (at an abscissa value of 1) show the detection performance (d′). b, Ratio of human/template performance (d′) as a function of offset size. Theleftmost points (at an abscissa value of 1) show the ratio of human/template performance for detection. Details are as ina. NAE, Nonamblyopic eyes; RH, strabismic amblyope; DM, strabismic and anisometropic amblyope.
The squared ratio of the human to ideal performance (d′) is known as efficiency. For detection, amblyopic observers generally had similar efficiency in their two eyes, which was a slightly lower efficiency than the normal controls. For the position task, the amblyopic eyes show a large decrease in efficiency, particularly at small offsets. The loss of efficiency is not surprising, given the amblyopes' abnormal templates. The question we address next is whether the reduced detection efficiency of the amblyopes can be explained by a poorly matched template. To address this question, we compared the amblyopic observers' performance (d′) with that of an ideal observer using the real observers' templates (Fig. 3b). For detection (leftmost points), the ratio of human (dh) to template performance (dt) for the amblyopic eyes was comparable with that of the normal observers. For the position task, normal observers and the preferred eyes of amblyopes had a ratio of human to template performance of ∼70%, independent of offset. For the amblyopic eyes, the ratio decreases markedly at smaller offsets. Thus, the amblyopes' performance is worse than predicted by their mismatched template. Matching performance (d′) at an offset of 90 sec (Fig. 3, dashed vertical lines) in the amblyopic eye to an offset of 20 sec in the normals (which give equivalentd′ values) does not alter the conclusion.
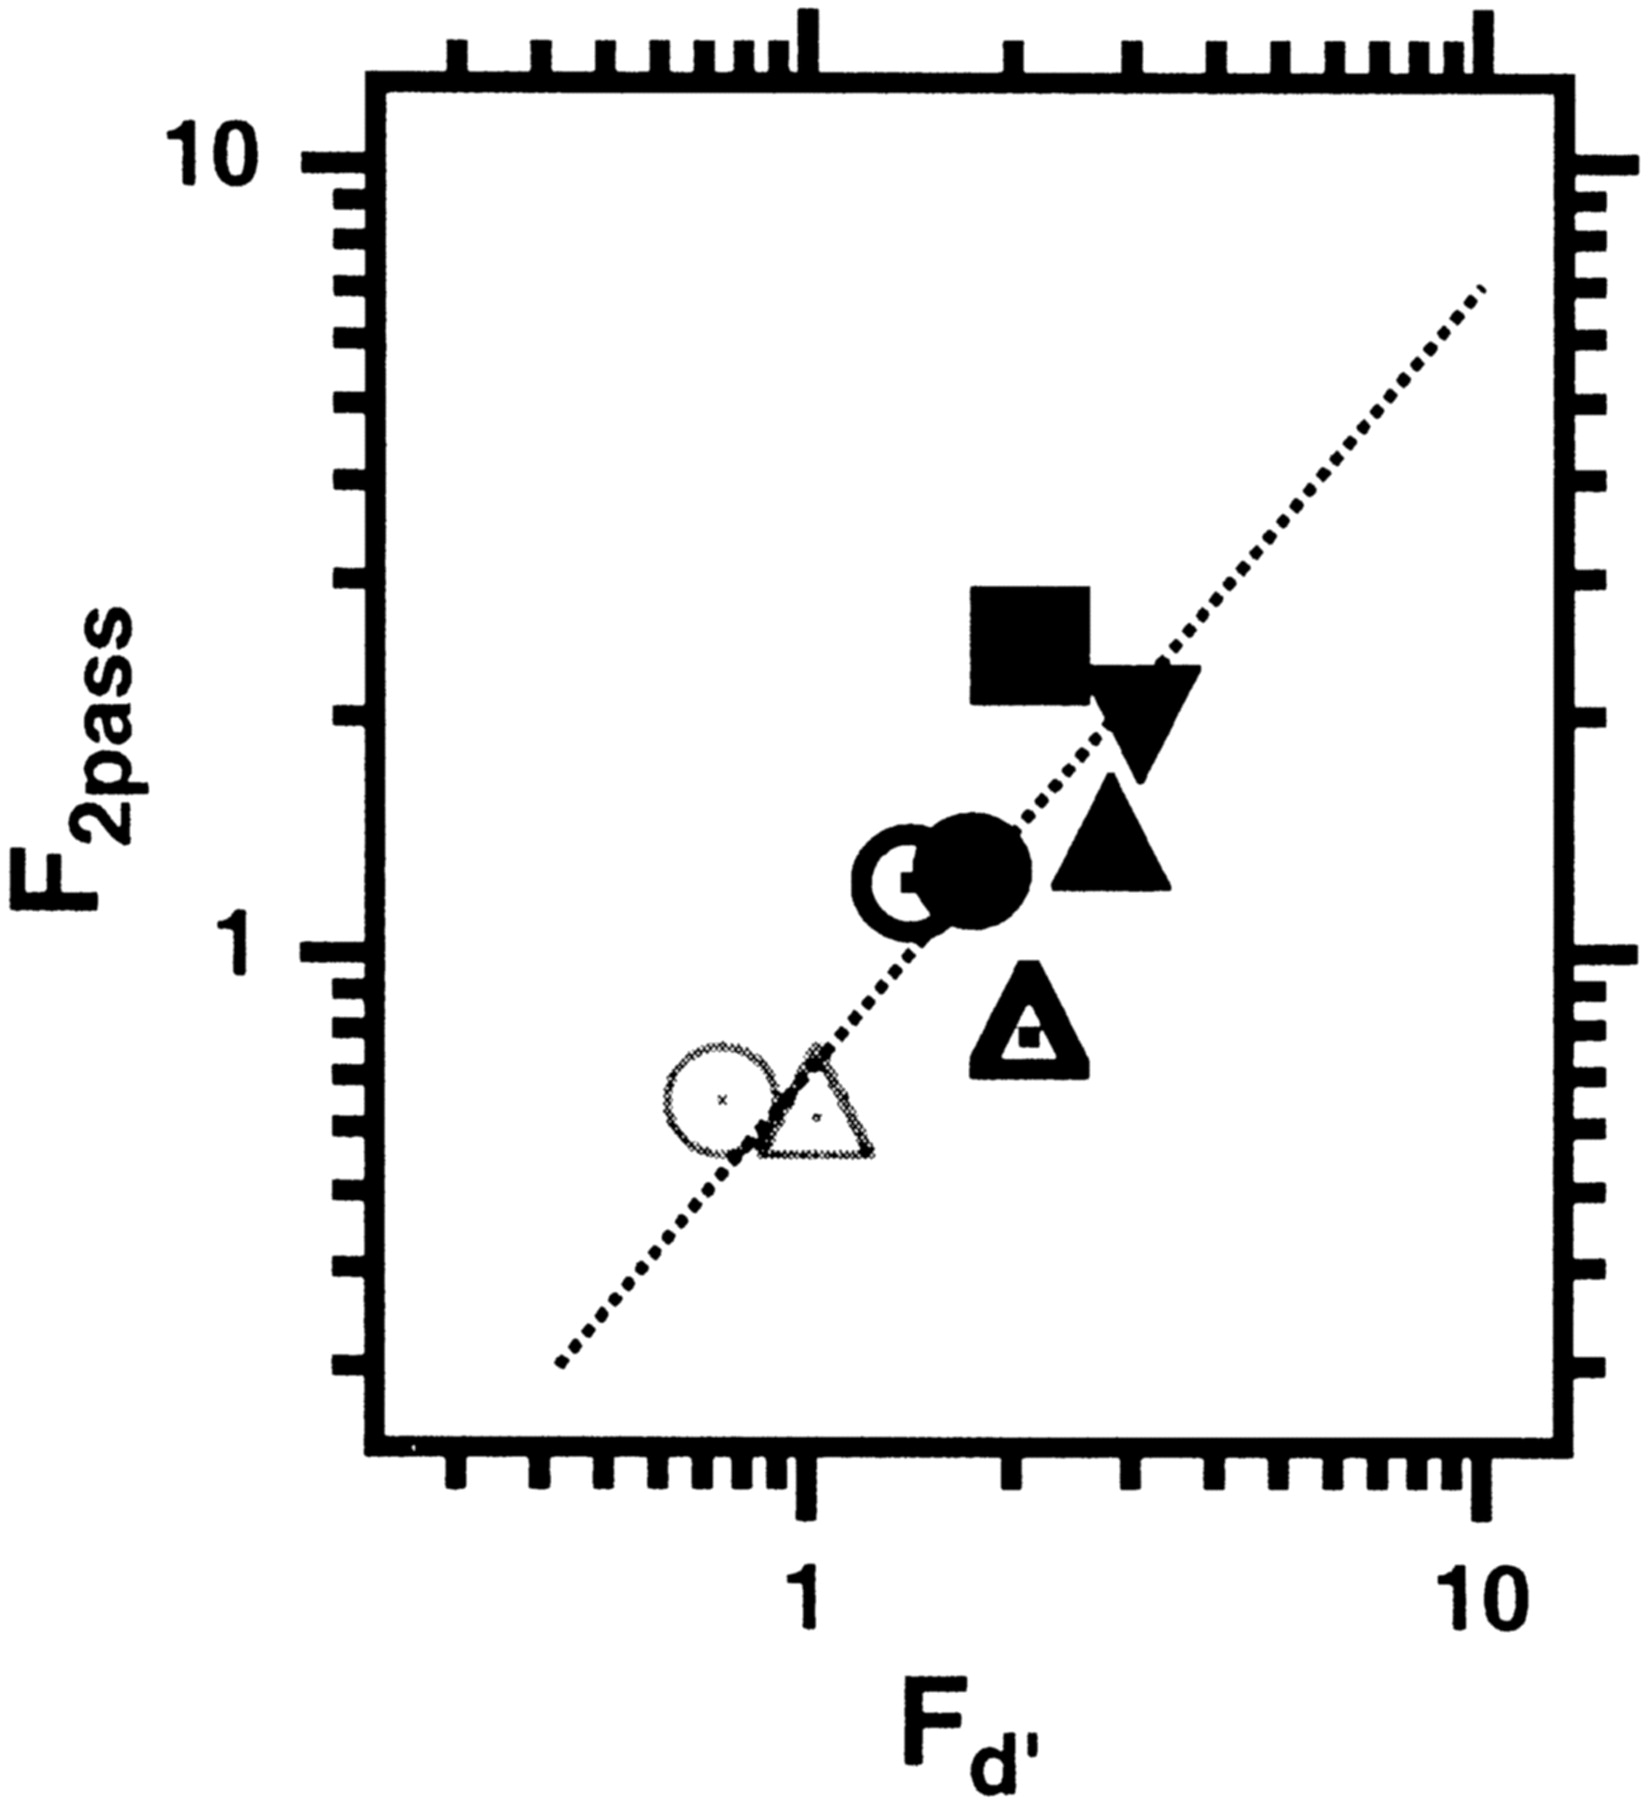
Reduced efficiency in the amblyopic visual system may have several possible causes. For example, reduced efficiency could reflect a high level of noise in the visual system or a poorly matched template. Noise provides a very useful tool to ask about the cause of the reduced efficiency. A poorly matched template results in systematic noise, allowing us to calculate the fraction, F, of internal noise (NI, which is variable from trial to trial) to external noise (Ne,which is consistent from trial to trial).Fd′ =Ni/Ne= (Efftemplate/Effhuman−1)1/2 (Ahumada, 2002).Fd′ is shown by the abscissa values in Figure 4. For normal observers (gray symbols), for both tasksFd′ ≈ 0.7–1.0. For the nonamblyopic eyes (open black symbols), it is higher, and for the amblyopic eyes (solid black symbols), it is higher still (the range of Fd′ was from ∼2 to 12 for all of the amblyopic eyes of the six amblyopic observers). Experiment 3 provides independent evidence for the increased fraction, F, of internal noise in amblyopic eyes.

F, the fraction of internal (relative to external) noise. We use two methods to estimateF. The ordinate shows F2passobtained from the double-pass experiment (experiment 3) for normal observers viewing foveally (open thin gray circles andtriangles for detection and position, respectively) and for each eye of two amblyopic observers (nonamblyopic, open black symbols; amblyopic, filled black symbols:circle and square for detection;triangles and inverted triangles for position). The ordinate shows the corresponding values ofFd′ obtained by comparing the observers' efficiency with that of their templates (experiments 1 and 2).
Experiment 3: two trips through the noise
To assess the contributions of internal noise, we conducted a double-pass experiment, in which observers performed the identical experiment twice [a variant of the experiments described by Burgess and Colborne (1988) and Gold et al. (1999)]. In this experiment, the stimuli and the noise samples in the second test were identical to those in the first. The amount of response disagreement between the two tests (at a given performance level) provides another method to determine F. Because the noise was 15–20 times threshold, it resulted in substantial (∼10-fold) threshold elevation in both normal and amblyopic eyes. Therefore, the internal noise that we measure with this method is greater than the noise for zero stimulus, so the internal noise must be stimulus dependent. The ordinate values in Figure 4 show F estimated from Monte Carlo simulations of the double-pass data. For normal observers, for both tasks, the noise energy is predominantly external (on average 70%, compared with internal noise energy of ∼30%). The fraction,F2pass = (Ni/Ne) ≈ √(0.3/0.7) ≈ 0.65. The results for the amblyopic observers are quite surprising. The amblyopic observers show a higher fraction of internal noise with their preferred eyes (F≈ 1) and a much higher fraction of internal noise when viewing with their amblyopic eyes (on average, internal noise energy was 75% compared with external noise energy of ∼25%, makingF2pass ≈ 1.8). It is important to note that these observers were highly practiced psychophysical observers, each having performed hundreds of thousands of trials across a variety of experiments. Moreover, they were highly familiar with these specific stimuli and tasks, because the double-pass experiment was performed after the completion of experiments 1 and 2. Thus, we conclude that the loss of efficiency in the amblyopic visual system is attributable in part to a poorly matched template, but to a much greater degree, to a high fraction of internal (relative to external) noise.
Both methods point to a high fraction of internal noise; however, the two estimates of F shown on the two axes of Figure 4 differ by a factor of ∼1.4. For F2, such as used by Ahumada (2002), this would be a factor of two. Ahumada (2002) also reported a difference (of a factor of ∼2) in the two estimates in the same normal observers in a detection-in-noise experiment. The precise reasons for the quantitative differences are beyond the scope of this report, but in the Discussion we speculate on why the two estimates might differ.
Discussion
Our results show reduced performance for both detection and position discrimination in observers with amblyopia, consistent with several previous studies using noise to try to understand the mechanisms of amblyopia (Kersten et al., 1988; Wang et al., 1998;Kiorpes et al., 1999). Our novel finding is that this loss is attributable in part to a poorly matched template, but to a much greater extent to a high fraction of stimulus-dependent internal noise.
Our measurements reveal that amblyopes have a coarse template (classification image) for position, with severe high-frequency attenuation. The poorly matched template exhibited by several amblyopes produces systematic noise that reduces efficiency. However, amblyopes show a much larger fraction of internal (relative to external) noise, and this provides some new insights into the mechanisms of amblyopia.
Three explanations have been widely used to account for the losses seen in humans with amblyopia; none of these can simply account for the pattern of our results. The first, which has found broad agreement, is that there is a scale shift (i.e., a loss of contrast sensitivity at high spatial frequencies), consistent with the loss of contrast sensitivity of small (high spatial frequency) receptive fields in area V1 in monkeys with experimental amblyopia (Kiorpes et al., 1998). Our finding of a coarser (low spatial frequency) template is a consequence of this explanation. However, the loss of contrast sensitivity at high spatial frequencies cannot fully account for the present data. For example, the shift of contrast sensitivity toward lower spatial frequencies actually makes the detection template more rather than less efficient, because the ideal observer is optimally tuned to the test pattern with a peak at 6 c/degree (Fig. 1c, solid line), whereas the normal human has an inefficient peak at higher spatial frequencies (Levi and Klein, 2002). Our results show little loss of performance or efficiency for detection. The loss of neural contrast sensitivity is also too small to account fully for the behavioral losses of contrast sensitivity in monkeys with amblyopia, and the spatial scale shift hypothesis also cannot fully explain the loss of position acuity in humans with strabismic amblyopia. To account for this “additional” loss, two other explanations have been suggested: a reduced complement of cortical neurons (“undersampling”) (Levi and Klein, 1986) and miswiring of cortical neurons (“topographical jitter”) (Hess, 1982; Hess and Holliday, 1992). Neither hard-wired miswiring nor fixed undersampling can, by itself, fully account for the present pattern of results (Levi et al., 1994a). For example, a hard-wired miswiring or fixed undersampling would damage the template, but would have little effect on the internal noise. Although we cannot rule out the possibility that some form of undersampling or miswiring exists, our results point to a different explanation.
The present study adds new pieces to the puzzle: first, it quantifies the amblyopic template, showing a relatively small loss compared with the ideal observer. Second, it shows that the amblyopic visual system has a high fraction of internal (relative to external) noise, which is stimulus dependent.
We do not yet understand the origin of the high fraction of internal noise. Physiological recordings in monkeys with experimental amblyopia (Kiorpes et al., 1998) show a modest (less than twofold) reduction in the proportion of neurons in V1 driven by the amblyopic eye, resulting in a reduced signal-to-noise ratio in the amblyopic cortex. Our finding that strabismic amblyopes show a high proportion of internal noise when viewing with both the amblyopic and preferred eyes suggests that this internal noise is central and is likely related to the absence of correlated binocular visual experience early in life (Kind et al., 2002). As noted above, variability in neural signals has important consequences for perception (Parker and Newsome, 1998). To our knowledge, there are no quantitative physiological studies ofF in animals with experimental amblyopia (or for that matter, with normal vision). The fraction F is directly related to the correlation of the responses in the two passes, and in principle, this fraction could be determined by performing a physiological double-pass experiment (i.e., recording neural responses to the identical noise sequence twice).
It seems likely that there are multiple sources of stimulus-dependent internal noise. For example, it is well known that the variance of the spike count is proportional to the mean spike count (Tolhurst et al., 1983; Shadlen and Newsome, 1998), indicating that there is stimulus-dependent noise. One possibility for the high proportion of internal noise in amblyopia is an increase in this variance. Another source of noise that likely plays a role in the stimulus-dependent internal noise seen in humans using the double-pass method (Burgess and Colborne, 1988) is variability in the observer's template. It seems plausible that the increased fraction of internal noise in the amblyopic cortex might be a consequence of a variable or noisy template (McIlhagga and Paakkonen, 1999). Noisy templates can be achieved in a variety of ways [e.g., by including randomly selected but irrelevant neurons (Shadlen et al., 1996) or by uncertainty (Pelli, 1990) in which a multiplicity of mechanisms (e.g., shifted templates) are monitored]. This sort of multichannel model with uncertainty would result in a decrease in performance (d′) but would not degrade the double-pass correspondence, thus leading to a larger estimate ofF with the template method than with the double-pass method (as seen in Fig. 4). A multiplicity of shifted templates would lead to a broader template, would degrade the position task more than the detection task, and, importantly, would lead to an increased proportion of internal noise. Discriminating between increased early (e.g., V1) noise variance and a later-stage noisy template will require physiological recordings in animals with experimental amblyopia.
Footnotes
This work was supported by Research Grants R01EY01728 and R01EY04776 and Core Center Grant P30EY07551 from the National Eye Institute, National Institutes of Health. We thank Hope Queener for developing the processing tools.
Correspondence should be addressed to Dr. Dennis M. Levi, University of California at Berkeley, School of Optometry, Berkeley, CA 94720-2020. E-mail: dlevi{at}spectacle.berkeley.edu.


