

Abstract
In the present study, we investigated the auditory responses of the medial geniculate (MGB) neurons, through in vivo intracellular recordings of anesthetized guinea pigs, while the auditory cortex was electrically activated. Of the 63 neurons that received corticofugal modulation of the membrane potential, 30 received potentiation and 33 received hyperpolarization. The corticofugal potentiation of the membrane potential (amplitude, mean ± SD, 8.6 ± 5.5 mV; duration, 125.5 ± 75.4 msec) facilitated the auditory responses and spontaneous firing of the MGB neurons. The hyperpolarization of –11.3 ± 4.9 mV in amplitude and 210.0 ± 210.1 msec in duration suppressed the auditory responses and spontaneous firing of the MGB neurons. Four of the five neurons that were histologically confirmed to be located in the lemniscal MGB received corticofugal facilitatory modulation, and all of the four neurons that were confirmed to be located in the non-lemniscal MGB received corticofugal inhibitory modulation. The present intracellular recording provides novel results on how the corticofugal projection gates the sensory information in the thalamus: via the spatially selective depolarization of lemniscal MGB neurons and hyperpolarization of non-lemniscal MGB neurons. It is speculated that the systematic selectivity of facilitation and inhibition over the lemniscal and non-lemniscal MGB is related to the attention shift within the auditory modality and across the sensory modalities.
- corticofugal modulation
- the medial geniculate body
- electrical stimulation
- in vivo intracellular recording
- excitatory postsynaptic potential
- EPSP
- inhibitory postsynaptic potential
- IPSP
- low-threshold calcium spike
Introduction
The thalamus relays ascending information to the cortex and, in turn, receives a much stronger reciprocal projection than the ascending one back from the cortex (Andersen et al., 1980; Montero, 1991; Liu et al., 1995a). It has been suggested that the cortical feedback to the thalamus provides a gating or gain-control mechanism in the transmission of information from the periphery to the cortex (Sherman and Koch, 1986; Murphy and Sillito, 1987; Deschênes and Hu, 1990; He, 1997; Zhang et al., 1997).
Previous studies using a cooling technique by Ryugo and Weinberger (1976) and Villa et al. (1991) have demonstrated that the auditory cortex has two processes for modulating its thalamic relay nucleus, the medial geniculate body (MGB): facilitatory and inhibitory. Both processes have been observed in the MGB and in the inferior colliculus (IC) when the cortex was activated by electrical stimulation (Watanabe et al., 1966; Sun et al., 1989; He, 1997, 2003; Suga et al., 1997; Zhang et al., 1997; Zhou and Jen, 2000; He et al., 2002). The electrical activation of the auditory cortex mainly caused strong facilitation and little inhibition on the lemniscal nucleus of the MGB, although it mainly caused inhibition on the non-lemniscal MGB (Yan and Suga, 1996; He, 1997, 2003; He et al., 2002).
Previous extracellular recording experiments have shown that corticofugal modulation could sharpen the following: the frequency tuning curves, the stimulus-duration tuning curves, and the echo-duration tuning curves. The corticofugal modulation could also gate the matched information and amplify the low-intensity sound, as well as control the plasticity in the MGB and IC (Sun et al., 1989; He, 1997, 2003; Suga et al., 1997; Zhang et al., 1997; Zhou and Jen, 2000; Jen et al., 2001; He et al., 2002). Doubts still remain, however, on how these function at the level of a single cell.
Studies of intracellular recording with slice preparation have revealed similar intrinsic membrane properties and different synaptic properties of the lemniscal and non-lemniscal MGB (Hu, 1995; Tennigkeit et al., 1996; Bartlett and Smith, 1999). It has also been revealed that corticofugal feedback can control the thalamic oscillation (Steriade et al., 1972; Contreras et al., 1996, 1997; Huntsman et al., 1999; Bal et al., 2000; Blumenfeld and McCormick, 2000; Steriade, 2000; Golshani et al., 2001; He, 2003b) and that the corticofugal influence on the thalamic reticular nucleus (TRN) is 2.4 times higher that on the thalamic relay neurons (Golshani et al., 2001; Steriade, 2001b). However, a systemic linkage of the corticofugal projection is still to be investigated with the in vivo preparation.
In the present study, we chose a simpler animal model, the guinea pig, which has very few thalamic interneurons (Arcelli et al., 1997), and used in vivo intracellular recordings to uncover the most basic functions of the corticofugal modulation of the mammals: corticofugal facilitation and inhibition. Changes of membrane potential to acoustic stimuli were recorded while the corticofugal pathway was activated through electrical stimulation. We labeled the neurons after the intracellular recording and counterstained the section to identify the locations of the functionally identified neurons.
Materials and Methods
Animal preparation for intracellular recording. Thirty guinea pigs served as subjects for the present intracellular recording study. Anesthesia was initially induced with pentobarbital sodium (Nembutal, 35 mg/kg, i.p.; Abbott Laboratories, Abbott Park, IL) and maintained by supplemental doses of the same anesthetic (∼5–10 mg·kg–1·hr–1) during the surgical preparation and recording. The anesthetic level was monitored by electrocorticography during the recording. The subject was mounted in a stereotaxic device after the induction of anesthesia. A midline incision was made in the scalp, and craniotomy was performed to enable us to implant stimulation electrodes into the auditory cortex and vertically access the MGB in the right hemisphere (He et al., 2002; He, 2003a; Xiong et al., 2003). The head was fixed with two stainless steel bolts to an extended arm from the stereotaxic frame using acrylic resin. The left ear was then freed from the ear bar, so that the subject's head remained fixed to the stereotaxic device without movement.
CSF was released through an opening on the back of the neck at the medulla level. Artificial respiration was applied to the animal, both sides of the animal's chest were opened, and its body was hung up to reduce vibrations to the brain caused by intra-thoracic pressure.
We used a glass pipette filled with 1.0 m KCl as the recording electrode,. The resistance of the electrode was between 40 and 90 MΩ. The electrode was advanced vertically from the top of the brain by the stepping motor. After the electrode was lowered to a depth of 4–5 mm, the cortical exposure was sealed using low-melting temperature paraffin. When the electrode was near or in the targeted area, it was slowly advanced at 1 or 2 μm per step.
Acoustic stimuli. Acoustic stimuli were generated digitally by a MALab system (Kaiser Instruments, Irvine, CA), which was controlled by a Macintosh computer (Apple Computers, Cupertino, CA) (Semple and Kitzes, 1993; He, 1997). Acoustic stimuli were delivered to the subject via a dynamic earphone (Bayer DT-48) mounted in a probe. The sound pressure level of the earphone was calibrated over a frequency range of 100 Hz to 35 kHz under the control of a computer by using a condenser microphone (¼ inch; Brüel and Kjær, Norcross, GA). The calibration was saved in the computer and used to compensate for the output intensity for each frequency (Semple and Kitzes, 1993). The subject was placed in a double-walled soundproof room (NAP, Clayton, Australia). Repeated noise bursts and pure tones with a 5 msec rise–fall time were used to examine the neuronal responses.
Electrical stimulation. We performed several mapping studies of the auditory cortex before the present study and found that the stimulation site only made a quantitative difference to the corticofugal modulation of the thalamic neurons (He et al., 2002; He, 2003a). In the present study, we omitted the mapping procedure to save time for the intracellular recordings. An electrode array consisting of three parallel electrodes was implanted into the auditory cortex (the anterior and dorsocaudal auditory fields) of the subjects. In most cases, we used electrical current pulse trains of 0.1 or 0.2 msec in width, 50 or 200 Hz in frequency, and 5–20 pulses to activate the auditory cortex according to the map obtained from previous works (Edeline et al., 1994; He, 1997; He et al., 2002). The effect of number of pulses per stimulus train was also examined in the present study. Electrical currents of 50–200 μA were applied to the auditory cortex, ipsilateral to the recording thalamus through either a monopolar or bipolar low-impedance electrode array. After a delay interval of 100 msec, a sound stimulus was delivered to the contralateral ear of the recording hemisphere after the end of the cortical stimulation (He, 1997, 2003a).
Anatomical confirmation. For 19 subjects, we filled the recording pipette with Neurobiotin (1–2% in 1 m KCl; Vector Laboratories, Burlin-game, CA) and injected the tracer into one to four neurons in each subject after physiological recordings. Neurobiotin was delivered into the neuron by passing rectangular depolarizing current pulses (150 msec, 3.3 Hz, 2 nA) for 1–4 min. The subjects were deeply anesthetized with sodium pentobarbital and perfused transcardially with 0.9% saline, followed by a mixture of 4% paraformaldehyde in a 0.1 m phosphate buffer, pH 7.3. Their brains were removed, postfixed in 4% paraformaldehyde overnight, and then moved to a 0.1 m phosphate buffer containing 30% sucrose. The thalami were cut transversally using a freezing microtome at a thickness of 90 μm. Sections were collected in 0.01 m potassium PBS (KPBS), pH 7.4, and then incubated in 0.1% peroxidase-conjugated avidin-D (Vector Laboratories) in KPBS with 0.5% Triton X-100 for 4–6 hr at room temperature. After the detection of peroxidase activity with 3′,3′-diaminobenzidine, sections were examined under the microscope and photographed. Those sections containing labeled neurons were mounted on gelatin-coated slides and counterstained with neutral red (1%; Sigma, St. Louis, MO).
Data acquisition and analysis. After amplification, the membrane potential with artifacts of electrical stimulation as well as the auditory stimulus were stored in the computer with the aid of commercial software (AxoScope; Axon Instruments, Foster City, CA). No manipulations of membrane potentials were made to the data presented in this study. The amplitudes of EPSPs and IPSPs were calculated as the change to the membrane potential caused by cortical stimulation. The durations of EPSPs and IPSPs caused by cortical stimulation were calculated to be the lasting of the accumulative EPSPs and IPSPs from their onset.
Results
The present results were sampled from 67 neurons in 30 animals.
Locations of the MGB neurons of corticofugal facilitation and inhibition
Of the 67 neurons presented in the present report, nine were successfully labeled with Neurobiotin and counterstained with neutral red. Five neurons were located in the lemniscal MGB, and four neurons were located in the non-lemniscal MGB. Four of the five neurons located in the ventral division of the MGB (MGv) received facilitatory modulation from the cortical stimulation, and the remainder did not respond to the cortical stimulation. All of the four neurons in the non-lemniscal MGB showed an inhibitory response to the electrical stimulation of the auditory cortex.
Figure 1 shows the physiology of corticofugal modulation, the morphology of Neurobiotin labeling, and the anatomical locations in the thalamus with the neutral red counterstaining of five MGB neurons. Of the five representative neurons shown in Figure 1, three were located in the ventral division of the MGB, and two were located in the caudomedial nucleus of the MGB.

The anatomical locations of MGB neurons received either corticofugal facilitatory or inhibitory modulation. The left panel shows the neuronal responses to the noise-burst stimulus and the combination of a cortical electrical stimulation and the noise-burst stimulus. The middle panel shows the labeled neurons stained with Neurobiotin. The right panel shows a lower magnification of the section after it was counterstained with neutral red. On the basis of the neuronal architecture, we could parcel the MGB into varied nuclei. The labeled neurons were highlighted on either the right or left top corner of each right photograph. The neurons in A–C responded to an auditory stimulus with an EPSP and spike(s), and a depolarization to the electrical stimulation in the auditory cortex. The neurons inDand E responded with an IPSP to auditory stimulus and were inhibited by the electrical cortical stimulation. v, Ventral nucleus; cm, caudomedial nucleus; rm, rostromedial nucleus of the MGB. Scale bars: middle panel, 100 μm; right panel, 1000 μm.
The neuron in Figure 1A responded to a noise-burst stimulus with two spikes and a sustained EPSP and was depolarized by the cortical stimulation of a five-pulse train. This multipolar neuron was located in the ventral division of the MGB.
The neuron in Figure 1B responded with an EPSP to the noise-burst stimulus and was depolarized by the cortical stimulation of a 10-pulse train, which resulted in a greater EPSP to the same noise-burst stimulus. This neuron was located in the ventral division.
The third neuron in Figure 1C responded to a noise-burst stimulus with a spike and a short-lasting EPSP. The cortical stimulation caused a small EPSP and resulted in a doublet in its response to the same noise-burst stimulus. The neuron was identified to be in the ventral division.
Two neurons located next to each other were labeled in Figure 1D. Both of them were located in the non-lemniscal MGB. We presume that one of them was recorded and injected with the tracer and the other was accidentally filled with the tracer while we were moving the electrode. The left panel of Figure 1D showed a small inhibitory response to the noise-burst stimulus and was inhibited by the cortical stimulation of a five-pulse train. The neuron was located in the caudomedial nucleus of the MGB.
The last neuron in Figure 1E showed an IPSP to the noise-burst stimulus. The neuron received a hyperpolarization from the cortical stimulation of a five-pulse train. The labeled neurons were again located in the caudomedial nucleus of the MGB.
Of the four neurons that were histologically confirmed to be located in the non-lemniscal MGB, three showed an inhibitory response to the acoustic stimulus, and one responded with spikes and EPSPs to the auditory stimulus. However, all of them received inhibitory modulation from the cortical stimulation.
Membrane potential dependence of auditory responses
When the resting membrane potential was above –70 mV, neurons with a more positive resting membrane potential responded with more spikes to auditory stimuli than those with a lower membrane potential. The neuron in Figure 2 responded with a train of seven to nine spikes at a resting membrane potential of –50 mV; however, the number of spikes gradually decreased to two at –65 mV, one at –67 mV, and zero at –69 mV. A slow-rising EPSP could still be detected in the last trace of Figure 2A. The number of spikes from 37 trials of auditory responses was plotted as a function of the resting membrane potential of the neuron (Fig. 2B). The resting membrane potential drifted spontaneously during the course of recording.

Relationship between the number of spikes in the auditory responses of an MGB neuron and its resting membrane potential. A, The MGB neuron responded to a noise-burst stimulus at varied resting membrane potentials. The membrane potential of the neuron drifted spontaneously. The calibration for membrane potential is shown on the left of each trace. The auditory stimulus is shown below each column. Some noises, picked up by the recording electrode, were probably caused by the vibration of the acoustic probe that transmitted the vibration to the animal. B, The scatterplot shows the number of spikes in response to the auditory stimulus verses the resting membrane potential.
Corticofugal modulation of the membrane potential
Figure 3 shows two typical examples of corticofugal modulation of the membrane potential: depolarization and hyperpolarization. The membrane potential of the neuron in Figure 3A was depolarized for 13 mV, and the spontaneous firing rate increased on average from <1 to 21 Hz (counted over 1 sec periods) (Fig. 3A, bottom panel). Thirty-eight neurons exhibited corticofugal depolarization in their membrane potentials. The membrane potential of the neuron in Figure 3B was hyperpolarized for –20 mV by cortical stimulation (bottom panel). The spontaneous firing was suppressed by the corticofugal hyperpolarization. The hyperpolarized membrane potential lasted during the pulse trains of the stimulation. Fifty neurons exhibited corticofugal hyperpolarization in their membrane potential.

Electrical stimulations of the cortex modulate the spontaneous firings of two MGB neurons. A, Cortical stimulation depolarized the membrane potential and increased the spontaneous firing rate of the MGB neuron. B, Cortical activation hyperpolarized the membrane potential and decreased the spontaneous firing rate of another MGB neuron. Each arrowhead indicates the artifact of a pulse train of the electrical stimulation, which consisted of 20 0.1-msec-width and biphasic pulses at 200 Hz. The stimulation current was 100 μA. Resting membrane potentials are indicated on the left of the intracellular recording traces.
Of 67 of the neurons reported in the present report, 63 that received corticofugal modulation of the membrane potential were used in the statistics and presented in Table 1.
Summary of neurons receiving corticofugal modulation
Corticofugal facilitation of the thalamic response to auditory stimuli
With a resting membrane potential above –70 mV, the corticofugal depolarization of the membrane potential facilitated auditory responses of the MGB neurons. Three examples of the corticofugal facilitation of thalamic response to auditory stimuli are shown in Figure 4. The auditory-responsive neuron in Figure 4A responded to a repeated noise-burst stimulus, with one or two spikes in the control condition when the cortex was not stimulated (Fig. 4Aa). The neuron was depolarized by ∼10 mV in its membrane potential when the cortex was electrically stimulated. It responded to the same acoustic stimulus as the control condition, with more spikes (two to five) when the cortex was activated by electrical stimulation (Fig. 4Ab). The neuron had a frequency selectivity of low frequencies ranging from 1 to 4 kHz (Fig. 4Ac).

Cortical activation facilitates the auditory response of three MGB neurons (A–C). Aa, The neuron responded to an acoustic stimulus of noise burst with an ON response of either one or two spikes, followed by a rebound. Four repeats of the responses are overlapped with each other. The resting membrane potential was –64 mV. Calibration of the membrane potential and time are shown on the left of the second trace and below the traces; they apply to all traces. Ab, After the cortical activation, the neurons responded to the same acoustic stimulus as in Aa with more spikes. Cortical stimulation consisted of 20 0.1-msec-width and biphasic pulses in 200 Hz. The experimental paradigm is shown below the traces. The time bar in Aa applies to Ab. The resting membrane potential was –66 mV, similar to that in Aa. Ac, Neuronal responses to pure-tone stimuli of varied frequencies. Calibration of both membrane potential and time apply to all traces. The timing of the auditory stimulus shown below the traces applies to all traces.The conventions here apply to the following parts of the figure. B,C, The left and the right panels show auditory responses without and with cortical stimulation, respectively. The neuron in B had a resting membrane potential of –55 mV, and that in C had one of –65 mV. Calibration: B, C, 50 mV, 200 msec.
The neuron in Figure 4B responded with one to two spikes to a noise-burst stimulus in the control condition and increased its responses to four to six spikes–spikelets, when the cortex was activated. The neuron in Figure 4C had a lower membrane potential of –65 mV. The neuronal response to the same pure-tone stimulus increased from two to four spikes–spikelets to six spikes–spikelets after the cortex was activated.
Both neurons in Figure 5, A and B, show an accumulated excitatory effect with each pulse of cortical stimulation. Neuron A showed a compound EPSP of 13 mV that lasted for 113 msec, and neuron B showed an EPSP of 9 mV that lasted for 128 msec. The mean compound EPSP of the 30 neurons that received the corticofugal depolarization of their membrane potential was 8.6 ± 5.5 mV (mean ± SD; range, 2–24 mV) and lasted for 125.5 ± 75.4 msec (range, 27–400 msec).
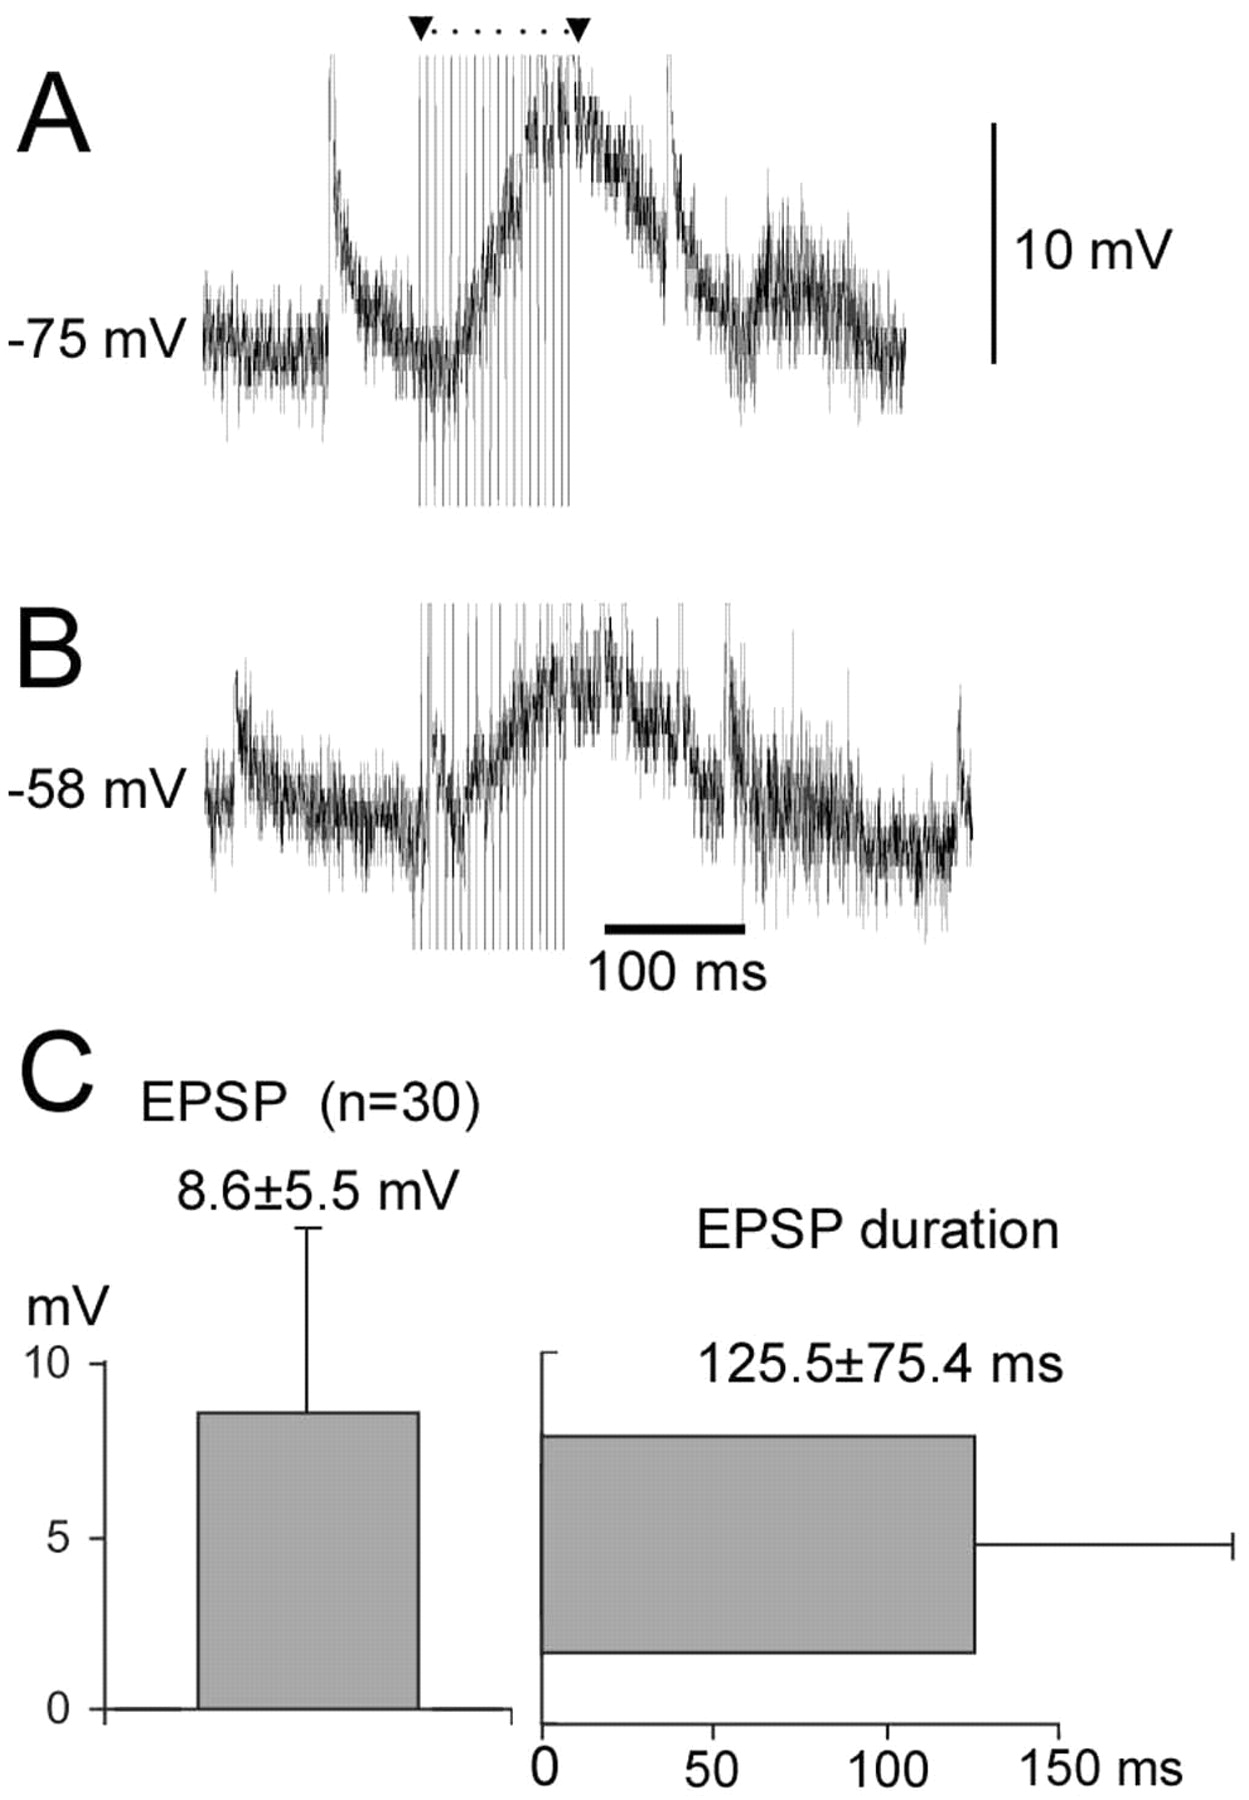
The cortical stimulation results in a membrane potentiation and an EPSP on the thalamic neurons. The neurons in A and B had a resting membrane potential of –75 and –58 mV, respectively. The calibration of the membrane potential applies to both neurons. The statistics of the compound EPSPs of 30 neurons are shown in C. The left vertical bar graph shows the mean amplitude and SD of the compound EPSP of the neurons. The right horizontal bar shows the mean and SD of the lasting duration of the EPSP of the neurons.
Long-lasting corticofugal inhibitory effect
All neurons in Figure 6 received an inhibitory effect when the auditory cortex was electrically activated. All inhibition lasted for long periods of over 400 msec. The neuron in Figure 6A showed a resting potential of –57 mV and received a compound IPSP of approximately –8 mV. The neuron in Figure 6B had a resting membrane potential of –55 mV and received a compound IPSP of –19 mV, that in Figure 6C had –55 and –7 mV, respectively, and the neuron in Figure 6D had –57 and –20 mV, respectively. All of the inhibitory effects on the neurons in Figure 6 had a long-lasting effect: A, 590 msec; B, 750 msec; C, 1150 msec; and D, 440 msec.

Corticofugal hyperpolarization on the thalamic neurons has a long duration. Three trials of neuronal responses to electrical and auditory stimuli are shown for each of the neurons, with resting membrane potentials of –57 mV (A), –55 mV (B), –55 mV (C), and –57 mV (D), respectively. A standard pulse train consisting of 20 pulses at 200 Hz was applied to the cortex, and the compound IPSP was calculated on 33 neurons. The means and SDs of the amplitudes of the compound IPSP are shown in the left vertical bar graph of E. The means and SDs of duration of the first IPSP are shown in the top bar, and those of the duration of the total inhibitory effect caused by the electrical stimulation of the cortex are shown in the bottom bar of the right section of E.
It was interesting to note that the neuron in Figure 6D showed an accumulated inhibitory potential, i.e., a compound IPSP, that initially lasted for only 115 msec. The inhibitory effect, however, bounced back and back again, making a spindle oscillation of membrane potential and lengthening the total inhibitory effect to >400 msec. A total of 33 neurons that showed an obvious inhibitory effect were averaged for the initial IPSP duration, as well as the total inhibitory effect induced by the electrical cortical stimulation (Fig. 6E). Only those neurons that showed a rebounded inhibitory response were accounted for in the latter statistics. The mean compound IPSP was –11.3 ± 4.9 mV (n = 33; range, 3–21 mV), and the mean compound IPSP duration and the total inhibitory duration were 210 ± 210.1 msec (n = 33; range, 90–1220 msec) and 1023.0 ± 635.8 msec (n = 16; range, 300–3200 msec), respectively.
Number of stimulation pulses versus corticofugal effect
In the present study, we varied the number of electrical stimulation pulses and examined their effect on 12 neurons, two of which are shown in Figure 7, A and B. We changed the number of pulses from 1 to 20 and examined the corticofugal modulatory effect on the thalamic neurons. Both neurons shown in Figure 7, A and B, received inhibitory effects from cortical stimulation. Changes in the number of stimulation pulses caused only quantitative differences in the evoked compound IPSPs in thalamic neurons (Fig. 7C). The mean amplitude of the IPSPs caused by electrical cortical stimulation increased from 7.7 ± 6.3 to 9.4 ± 7.1 mV and to 10.7 ± 4.8 mV when the number of stimulation pulses increased to 1 to 5 and to 10 or 20, respectively (n = 7). The duration of IPSP also increased from 107.5 ± 34.9 to 150.7 ± 23.8 msec and to 224.3 ± 78.8 msec, respectively. The duration of IPSP was calculated over the accumulative effects of all pulses. It was technically difficult to accurately assess the effect of the number of pulses on the duration of the inhibition. The response duration, however, showed only quantitative difference in relation to the number of stimulation pulses.

Cortical stimulations of varying numbers of pulses result in a compound IPSP and EPSP. Electrical stimulations consisted of 1, 5, and 20 pulses at varied frequencies. Electrical stimulations were repeated five times on each trace in A. The resting membrane potential of the neuron was –58 mV. Electrical stimulations were repeated two times for the neuron in B, which had a resting membrane potential of –60 mV. C, The bar graphs show the means of the amplitudes (left panel; n = 7) and durations (right panel) of the IPSP caused by the cortical stimulation of various numbers of pulses. D, The bar graphs show the means of the amplitudes (left panel; n = 5) and durations (right panel) of the EPSP caused by the cortical stimulation of various numbers of pulses. Here, the EPSPs and IPSPs included the accumulative effects of all pulses.
Of the 12 neurons examined, five showed corticofugal facilitation (Fig. 7D). The mean amplitude of the EPSP increased from 7.0 ± 3.7 to 8.9 ± 5.2 mV and to 11.5 ± 2.9 mV when the number of stimulation pulses increased from 1 to 5 and to 10 or 20, respectively. The duration of EPSP also increased from 59.0 ± 29.6 to 141.0 ± 48.3 msec and to 220.0 ± 21.6 msec, respectively.
Cortical activation hyperpolarizes the membrane potential of the thalamic neurons
The results of corticofugal inhibition presented in this study were obtained while the membrane potential was between –55 and –67 mV.
Figure 8 shows an MGB neuron that responded to noise-burst stimuli with one to two spikes (left panel). The cortical stimulation hyperpolarized the membrane potential by approximately –6 mV, which inhibited the auditory responses of the neuron from spikes to EPSPs (right panel).

Cortical stimulation inhibits the neuronal responses to an auditory stimulus. Responses to a repeated noise-burst stimulus of an MGB neuron at a resting membrane potential of –58 mV, without cortical stimulation (left panel) and with cortical stimulation (right panel). The electrical stimulation consisted of a pulse train of 20 pulses; the artifact of each is indicated with an arrowhead. The auditory stimulus signal is shown below the neuronal response signal. The left panel shows the neuronal responses to three repeats of a noise-burst stimulus, and the right panel shows the neuronal responses to the same stimuli, which were preceded by an electrical stimulation of the cortex. The calibration for time is 200 msec.
Corticofugal inhibition was more dominant than corticofugal facilitation and lasted for a longer period of time. Corticofugal inhibition could completely switch off the ON auditory responses.
Discussion
Number of cortical stimulation pulses
In previous studies, we discussed other stimulation parameters, such as the stimulation frequency, stimulation intensity, the interval between the electrical pulses, and the delivery of the acoustic stimulus with an extracellular preparation (He et al., 2002; He, 2003a). The number of electrical stimulation pulses is thought to have determinative effects on thalamic neurons (McCormick and von Krosigk, 1992). The electrical stimulation of the corticothalamic fibers anterior to the dorsal lateral geniculate nucleus (LGNd) of the guinea pig both in vivo and in vitro resulted in either monosynaptic EPSPs followed by IPSPs or IPSPs among LGNd neurons (Deschênes and Hu, 1990; Scharfman et al., 1990). However, the delivery of two or more electrical stimuli at a frequency of between 3 and 500 Hz to the corticothalamic projection generated a slow excitatory potential with a long time constant of >1 sec (McCormick and von Krosigk, 1992). In the present study, only a quantitative difference between the neuronal response triggered by single-pulse stimulus and that by multiple-pulse stimulus was obtained. We conclude that the difference in the responses is attributable to the location of the recording neurons as discussed below.
Membrane potential-dependent auditory responses
An injection of positive small current intracellularly depolarizes the membrane potential and causes an increase in spontaneous firing rate (White et al., 1994; Torterolo et al., 1995; Smith and Populin, 2001; Sukov and Barth, 2001). The spontaneous firing rate depends on the resting membrane potential (Xiong et al., 2003) (Fig. 3).
Like the spontaneous firing rate, the auditory response also depends on the membrane potential. In the present study, we observed a decreased response when the membrane potential was hyperpolarized. The number of spikes decreased from nine to zero, while the membrane potential was manipulatively hyperpolarized from –50 to –69 mV (Fig. 2). This simple result explains the neuronal responsiveness to sensory stimuli when their membrane potential is above –70 mV.
Facilitatory effect
Previous extracellular studies have indicated that specific cortical stimulation (in which the stimulation site is functionally matched with the recording site in the thalamus and the inferior collicuclus) mainly results in facilitatory effects in the cat and bat (He, 1997; Zhang and Suga, 1997; Zhang et al., 1997; Gao and Suga, 1998; Zhou and Jen, 2000; He et al., 2002). Of 20 corticofugal modulatory neurons obtained by Watanabe et al. (1966), six had facilitatory effects, with a maximum increase of 57% in the number of spikes. A similar phenomenon was also observed in the cat MGv, in which interneurons accounted for one-fourth of the total population (Villa et al., 1991; He, 1997). Compared with the cat, the corticofugal modulation of the thalamus of guinea pig has a much broader effective area, supposedly resulting from fewer interneurons in the guinea pig's thalamus (He et al., 2002). The intracellular recording results shown in Figures 4 and 5 demonstrate how the corticofugal facilitation influenced the thalamic neurons and their subsequent changes in the auditory responses. The result shown in Figure 4 is comparable with the extracellular result shown by He (1997, his Fig. 11).
The present results clearly indicate that cortical stimulation could potentiate the membrane potential by 8.6 mV. The corticofugal potentiation facilitated the neuronal responses to acoustic stimuli of the thalamic neurons. The corticofugal potentiation lasted for an average period of 125.5 msec (range, 27–400 msec). This period is comparable with the time constant of the corticofugal facilitation on the thalami of the cat and the guinea pig: a few hundred milliseconds (He, 1997; He et al., 2002).
Morphologically, it is known that approximately one-half of the synapses on a thalamic relay neuron are RS terminals (small profiles with rounded vesicles; defined by Guillery, 1969; and Ralston et al., 1988) (Jones and Powell, 1969a,b; Liu et al., 1995a,b). The majority of the RS terminals appear to derive from corticothalamic fibers (Jones and Powell, 1969a). This dense synaptic input into thalamic relay neurons is clearly excitatory, activating AMPA, NMDA, and metabotropic glutamate receptors (mGluRs) (Deschênes and Hu, 1990; McCormick and von Krosigk, 1992; Bartlett and Smith, 1999; Tennigkeit et al., 1999). The mGluR is coupled to G-proteins and acts through the inositol trisphosphate second-messenger pathway, lasting for time periods of up to hundreds of milliseconds (McCormick and von Krosigk, 1992; Tennigkeit et al., 1999). The corticothalamic terminals have their main contact on the distal dendrites, thereby delivering an accumulative effect. This again suggests that there is a slow effect on the thalamic neurons and that the corticofugal modulation is maintained for a long period of time (Liu et al., 1995a; Bartlett et al., 2000).
Corticofugal inhibitory effect on thalamic neurons
The stimulation of the auditory cortex produced more inhibitions than facilitations on the thalamic neurons. The average compound IPSP on the thalamic neurons caused by the cortical stimulation was 11.3 mV, which was larger than the mean corticothalamic EPSP. The compound IPSP lasted for a long duration of 210.8 ± 210.1 msec. The total inhibition on the thalamic neurons by the cortical stimulation including the rebounded inhibition lasted even longer, for 1023.0 ± 635.8 msec.
In a recent extracellular study, He (2003a) observed a mostly inhibitory effect on the ON responses of the non-lemniscal MGB neurons after cortical stimulation. In some cases, the ON response was switched off by the cortical stimulation (He, 2003a, his Figs. 1, 2). The corticofugal inhibition was widespread (He, 2003a, his Figs. 5, 6).
The major sources of afferent input in the TRN are the collaterals of thalamocortical and corticothalamic fibers, all of which pass through the TRN en route to and from the cerebral cortex. The thalamocortical and corticothalamic collateral terminals display a topographical distribution in the TRN (Yen et al., 1985). The TRN neurons of all species are GABAergic (Houser et al., 1980; Oertel et al., 1983; Yen et al., 1985). The axons arising from the TRN neurons, after giving off one or two collaterals in the nucleus, only project back to and terminate in the dorsal thalamus but not to the cortex (Scheibel and Scheibel, 1966; Yen et al., 1985; Steriade et al., 1997).
He showed that corticofugal inhibition lasted for over 100 msec (He, 2003a, his Fig. 4). An intracellular study on brain slice showed that the neurons in the dorsal division of the non-lemniscal MGB responded to thalamic radiation stimulation with a long-duration IPSP of >200 msec, suggesting that the stimulation activated the TRN fibers that inhibit the MGB neurons through GABAB receptors (Bartlett and Smith, 1999, their Fig. 8).
The majority of the excitatory inputs to the TRN neurons are derived from the cerebral cortex (Liu and Jones, 1999), indicating that the corticofugal fibers to the TRN neurons control the excitability of the TRN neurons (Golshani et al., 2001; Steriade, 2001b). The TRN neurons extend dendrites within the thin reticular sheet, which enable the neurons to receive projections from a wide cortical region and project to widespread areas in the ventroposterior nucleus of the thalamus (Liu et al., 1995b). The TRN neurons project in a diverse manner to the thalamus (Jones, 1975; Shosaku and Sumitomo, 1983; Simm et al., 1990; Bourassa and Deschênes, 1995; Cox et al., 1997; Pinault et al., 1997). Recent physiological results indicate that the TRN terminals have a very strong inhibitory effect on the thalamic relay neurons (Bartlett et al., 2000; Golshani et al., 2001). It is known that the GABAB receptor has a time constant of hundreds of milliseconds (Ulrich and Huguenard, 1996; Kim et al., 1997; Tennigkeit et al., 1998; Bartlett and Smith, 1999). In summary, the activation of the cortex directly generates excitatory inputs to the lemniscal MGB neurons. This also activates the TRN neurons through corticothalamic fibers, which in turn inhibit the non-lemniscal MGB neurons in a time period of over hundreds of milliseconds.
Although both the cortex and thalamus have an intrinsic capacity to generate oscillations of varied frequencies, the corticothalamic loop is an ideal oscillator (Destexhe et al., 1993; Steriade et al., 1993a,b; von Krosigk et al., 1993; Golshani and Jones, 1999; Bal et al., 2000; Steriade, 2001a). The spindle-like oscillatory inhibitory wave in the membrane potential in Figure 6D might be caused by the recurrent inhibition of the corticothalamic loops. After the thalamus has received an impact (partly facilitation and partly inhibition) from the cortex, the thalamus echoes back an excitation to the TRN either directly or indirectly via the cortex, and this excitation of the TRN in turn inhibits the thalamus. A question arises here of whether the recurrent inhibition is caused by the thalamo–cortico–TRN–thalamic loop or by the thalamo–TRN–thalamic loop. A recent study by Golshani et al. (2001) showed that the amplitude of the EPSCs evoked in TRN neurons by the minimal stimulation of corticothalamic fibers were 2.4 times larger than in the relay neurons. The GluR4 receptor subunits labeled at corticothalamic synapses on TRN neurons outnumbered those on relay cells by 3.7 times (Golshani et al., 2001). Although the question needs additional investigation, these results would favor the view that recurrent inhibition might be caused by the thalamo–cortico–TRN–thalamic loop. The oscillatory corticothalamic loop serves another role, that of lengthening the corticofugal inhibitory effect from a mean value of 210.8 to 1023.0 msec (range, 300–3200 msec).
Functional remarks
Together with previous knowledge obtained from extracellular recordings, we determined that the corticofugal excitation amplifies the matched ascending auditory information via the lemniscal MGB to the cortex with a varied time period ranging from tens of milliseconds to hundreds of milliseconds. The corticofugal projection also switches off the non-lemniscal MGB, with a long-lasting inhibition of hundreds of milliseconds to seconds. Because the non-lemniscal MGB is involved in multisensory integration and in amygdala and basal ganglia interactions, switching off the non-lemniscal MGB might functionally prepare the auditory cortex for sole processing of auditory information. Adversely, a fading activity of the auditory cortex might relieve the inhibition on the non-lemniscal MGB and cause a shifting of attention across the sensory modality because the non-lemniscal MGB is multisensory. A strong and long-lasting inhibition means effective switching with a limited corticofugal effect. The long inhibition is probably caused by the recurrent inhibition of either the thalamo–cortico–reticulo–thalamic or the thalamo–reticulo–thalamic loop.
Footnotes
This study was supported by Hong Kong Research Grants Council Grant CERG PolyU5211/99M (J.H., Y.S.C.). We thank Simon S. M. Chan of The University of Hong Kong for his excellent technical assistance in the experiment.
Correspondence should be addressed to Jufang He at the above address. E-mail: rsjufang{at}polyu.edu.hk.
DOI:10.1523/JNEUROSCI.4897-03.2004
Copyright © 2004 Society for Neuroscience 0270-6474/04/243060-10$15.00/0


