

Article Figures & Data
Figures
- Figure 1.
Different measurements of the distribution of DSI for a sample of simple cells (n = 310). Open circles, The distribution of DSI measured using drifting gratings. Open triangles, The distribution of DSI predicted from the linear RF. Filled triangles, The distribution of DSI predicted from the RF taking into account an expansive output nonlinearity modeled as an exponent of 2.5. In addition to having a measured DSI >0.5, cells must also have a predicted DSI >0.5 (as indicated by the vertical dashed line) to be classified as a DS cell.
- Figure 2.
Distribution of latency-to-peak for quadrature fitting components of DS cells. The solid line shows time-to-peak latencies for monophasic fitting components (mean, 106.6 ± 25.5 msec). The short and long dashed lines show the latencies for the first (upward triangles; mean, 69.1 ± 17.3 msec) and second (downward triangles; mean, 150.0 ± 37.8 msec) peaks of the biphasic fitting components, respectively.
- Figure 3.
Distribution of biphasic indices for non-DS simple cells. Cells with biphasic indices <0.3 are classified as monophasic. Cells with biphasic indices >0.5 are classified as biphasic.
- Figure 4.
Distribution of latency-to-peak for non-DS simple cells. The solid line shows time-to-peak latencies for monophasic cells (mean, 76.3 ± 14.4 msec). The short and long dashed lines show the latencies for the first (mean, 65.3 ± 15.5 msec) and second (mean, 152.8 ± 36.4 msec) peaks of biphasic cells, respectively. The latencies of monophasic cells and those of the first peak of biphasic cells primarily overlap and show only weakly significant differences (p < 0.05; t test).
- Figure 5.
The distribution of peak latencies for different classes of LGN cells. The solid line shows the latency-to-peak for lagged cells (n = 61; mean, 97.5 ± 22.2 msec). Short and long dashed lines show, respectively, first (mean, 49.4 ± 12.0 msec) and second (mean, 119.8 ± 40.2 msec) peak latencies for nonlagged cells (n = 345).
- Figure 6.
The difference between space–time RFs for a pair of potentially connected simple cells. A, The RF for the DS member of the cell pair. Solid and dashed contours represent “on” and “off” responses, respectively. B, The RF for the non-DS member of the cell pair. C, The space–time RF obtained by taking the difference of the DS and non-DS RFs. Here the difference resembles a separable (non-DS) cell, which could potentially be a simple cell, or a group of LGN cells.
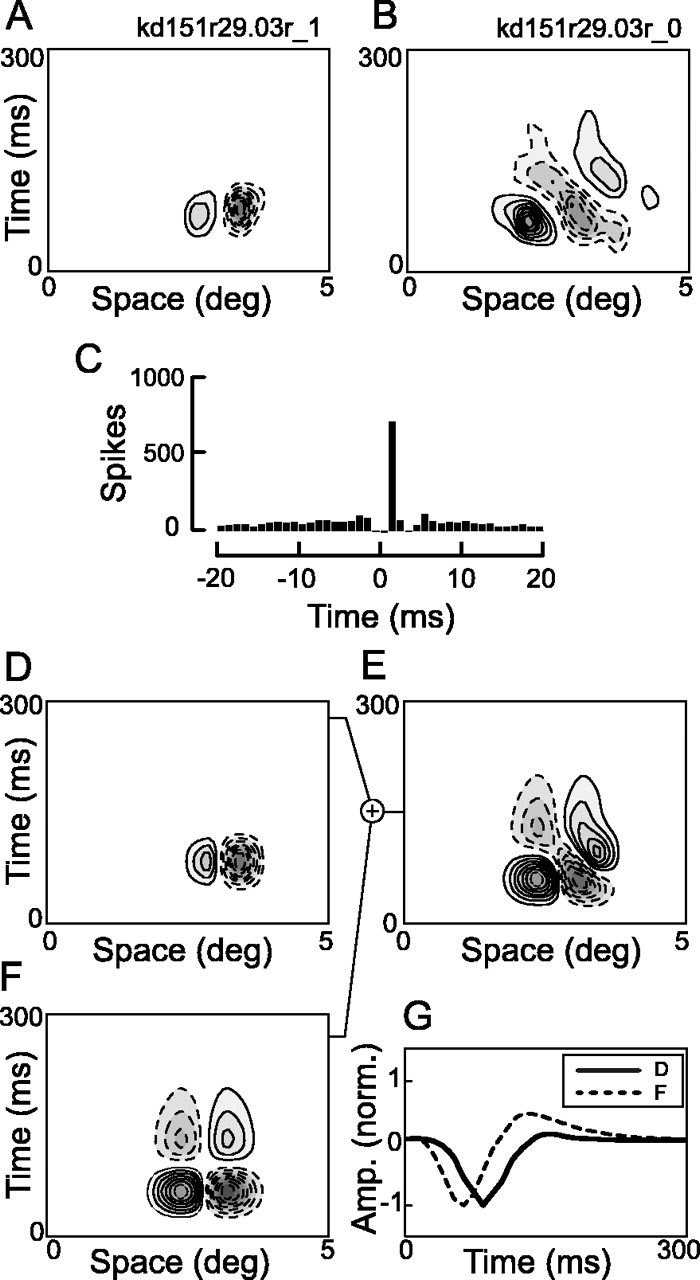
- Figure 7.
Example pair analysis for the cells shown in Figure 6. A, B, The non-DS and DS RFs. C, The CCH of the DS and non-DS cells. This CCH does not show a clear functional connection. The horizontal axis of the CCH has been expanded to show the slow (not functionally significant) correlations. For this analysis, we assume the non-DS cell is one of two inputs to the DS cell. The analysis shown here is designed to determine the RF of the best-fitting second input. D–F, The fit to the second, i.e., missing, component (F), which when added to the fit of the non-DS RF (D), provides the best fit (E; R2 = 0.88) to the DS member of the pair (B). G, The temporal profiles of the two input RFs. Solid and dashed lines represent the temporal profiles obtained from the components in D and F, respectively. Here the temporal phase difference between the two components is only 11°.
- Figure 8.
Another cell pair analysis as in Figure 7. For this pair, the CCH contains a narrow peak offset from zero, which is indicative of a monosynaptic connection from the non-DS to the DS cell. Here the best-fitting missing component (R2 = 0.85) produces a temporal phase difference of –85.2°, which is approximately quadrature. The negative phase value indicates that the non-DS member of the pair functions as the late component. This is an example in which the late component is a simple cell. In other words, direct lagged input is not necessary to produce direction selectivity.
- Figure 9.
A third example of the cell pair analysis. The layout is the same as in Figure 7. As in Figure 8, this pair exhibits a CCH indicative of a monosynaptic connection from the DS to the non-DS cell. Here the best-fitting missing component (R2 = 0.74) has a temporal phase difference of –46°, indicating that the measured RF forms the late component with a relationship that is less than quadrature.
- Figure 10.
The distribution of temporal phase differences between the two input components. A, Phase differences determined by a fitting analysis of cell pairs (n = 17). We find both positive and negative phase differences, indicating that non-DS simple cells can form both the early and late input components of DS cells. The phase differences cover the whole range of phases from –90° to +90°, suggesting that DS cells are formed from a pair of inputs with phase differences often less than quadrature. B, A distribution of minimum temporal phase differences needed to fit DS simple cells with the same goodness of fit as for the quadrature model. The distribution is broad, suggesting that temporal quadrature is not necessary for direction selectivity.
- Figure 11.
Analysis of the minimum temporal phase necessary to fit DS cells shows a broad distribution with very few cells requiring quadrature. This figure shows the distribution of minimum phase differences in terms of latency-to-peak. Solid and dashed lines represent the distribution of peak latencies for the more monophasic (solid line; mean, 85.9 ± 34.6 msec) and more biphasic (short and long dashed lines; means, 76.6 ± 33.9 and 183.0 ± 61.1 msec, respectively) of the two components of the variable phase fit, respectively. The more monophasic component is defined as the one with the smaller biphasic index.


