

Article Figures & Data
Figures
- Figure 1.
Schematic representation of the time course (a) and types of novel environments (b) used in the experiment. Animals were allowed to freely explore the novel environment A (b, top row) for 6 min (epoch 1). After a 20 min rest period in the home cage, the rats were exposed to either environment A again or to one of the other four environments schematically represented in b (epoch 2). Three of these environments were modified A environments: in Aobj, the local cues were changed from balls to cubes; in Aconf, the same local cues (balls) were rearranged in a different cue configuration; and in Ab, the entire local environment was moved into a different room with different distal cues. Environment B was in the second room and was as different as possible from environment A, yet contained the same number of local cues to ensure a similar level of complexity.
- Figure 3.
Summary of the Arc/H1a catFISH data. a, A confocal projection image (of 20 1 μm optical slices compressed into a single plane) from CA3 showing the four possible cell staining profiles (nuclei are shown in blue): the green arrow points to a H1a+ neuron, which has only H1a transcription foci (green) and thus was activated only during epoch 1; the red arrow points to an Arc+ neuron, which has only Arc transcription foci (red color) and thus was activated only during epoch 2; and the yellow arrow points to a Arc/H1a+ neuron that contains both Arc and H1a transcription foci and thus was activated during both epoch 1 and epoch 2. Neurons that had no foci were classified as negative. Scale bar, 50 μm. b, Staining profiles of CA3 and CA1 neuronal ensembles of the different behavioral groups expressed as percentages of total counted neurons. In both CA3 and CA1, the A/A group had the lowest percentage of H1a+ and Arc+ neurons and the highest percentage of Arc/H1a+, indicating the highest level of overlap of neuronal ensembles activated by epoch 1 and epoch 2. Conversely, the A/B group had the lowest level of overlap of activated neuronal ensembles. All other behavioral groups had an intermediate, but mutually equal, degree of overlap. +p < 0.05 relative to caged controls; #p < 0.05 relative to group A/B; Δ, p < 0.05 relative to group A/A. c, Size of the CA3 and CA1 neuronal ensembles active during epochs 1 and 2, expressed as the percentage of total counted neurons. The activated CA1 neuronal ensembles in all behavioral groups were significantly greater than those of CA3, and both CA3 and CA1 ensembles of the exploration groups were dramatically larger than those of caged controls.
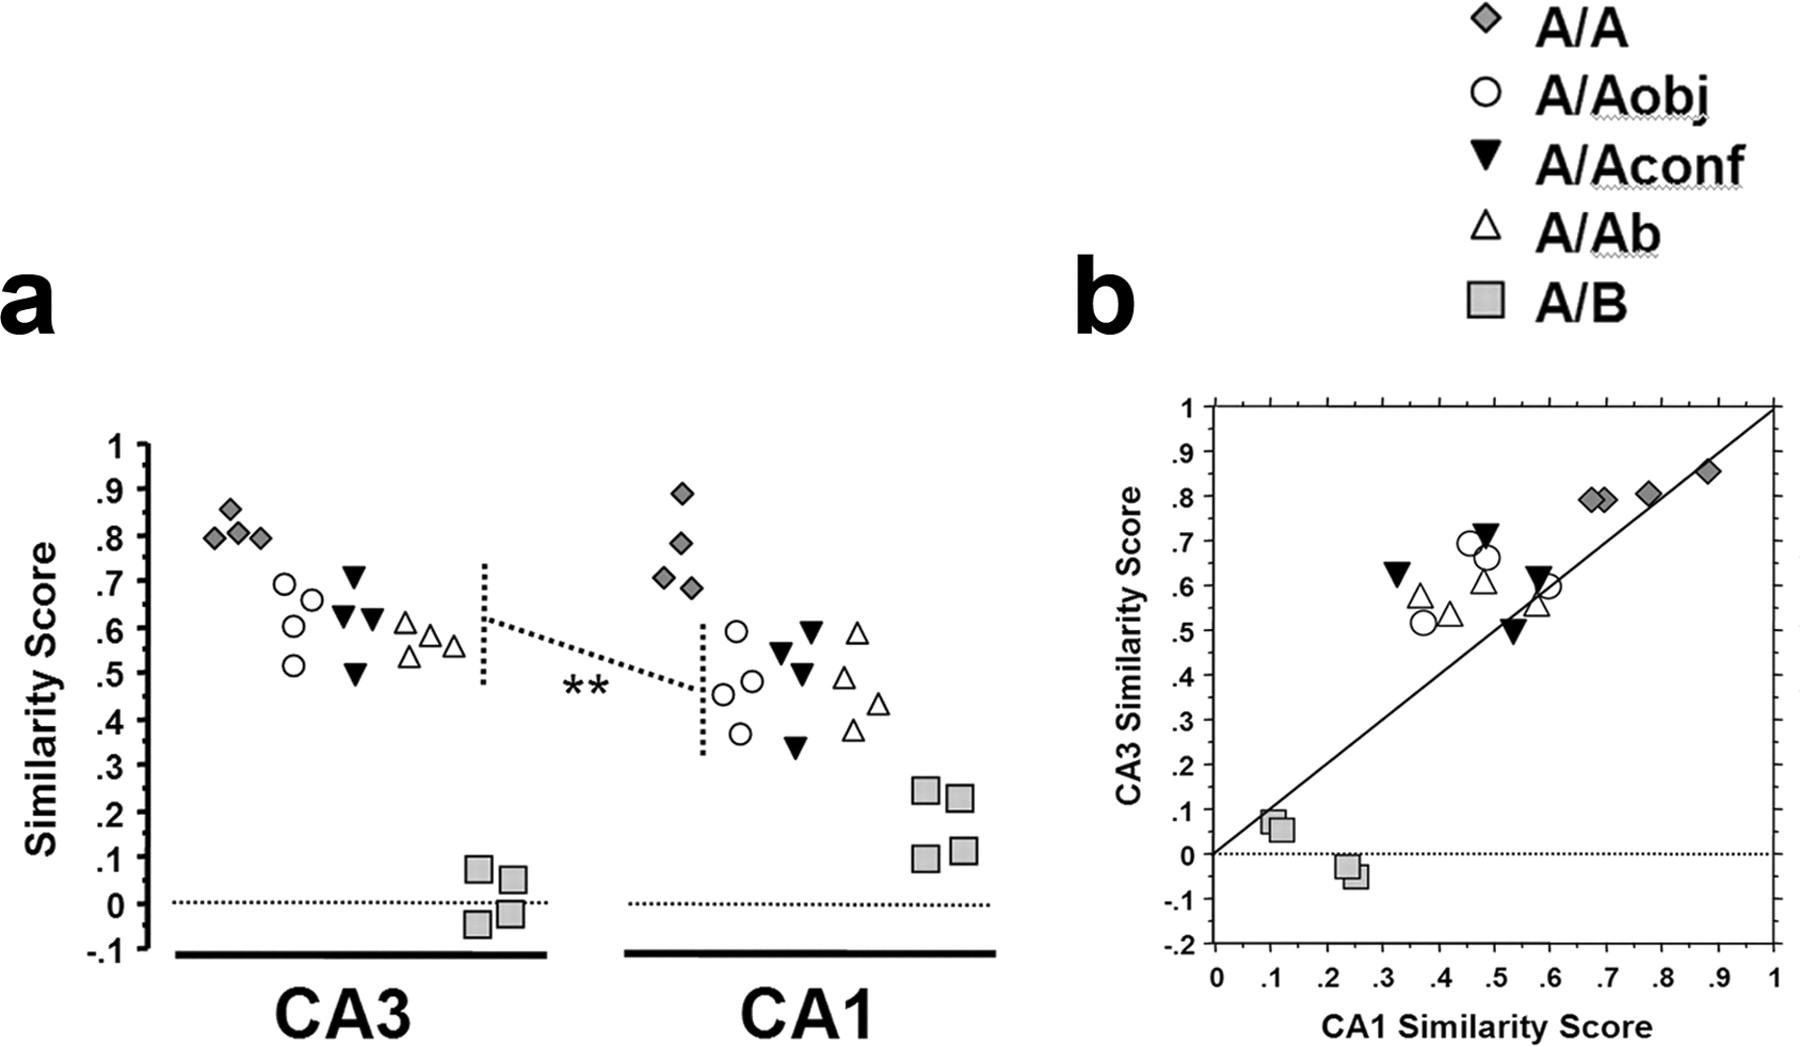
- Figure 4.
Analysis of similarity scores of rats from the different behavioral groups. A similarity score of 1 indicates a complete overlap of the neuronal ensembles activated by epoch 1 and epoch 2 (no remapping), whereas a similarity score of 0 indicates no overlap beyond that predicted by chance (complete remapping; see Materials and Methods). a, In both CA3 and CA1, the similarity scores from rats of the A/Aobj, A/Aconf, and A/Ab groups were significantly different from the A/A and A/B groups (p < 0.02) but were not different from each other (p > 0.82). Thus, in both CA3 and CA1, all alterations to environment A (here termed A′ and comprising groups A/Aobj, A/Aconf, and A/Ab) produced a similar effect on the neural ensemble response in that cell population. Notably, the similarity score of the A/A′ rats was greater in CA3 compared with CA1 (**p = 0.001). b, Correlation between the CA3 and CA1 similarity scores for each rat. Note that the CA3 similarity scores for the A/A′ rats tended to be higher than those for CA1, as indicated by the majority of points being above the 45 ° line. Furthermore, the CA3 similarity scores of the A/B group were lower than those of CA1 in the same rats (all points of the A/B group are below the 45 ° line). These findings, as visualized in a and b, indicate that CA3 separates well dissimilar representations (A vs B), but when the threshold for remapping is not met (as in the A/A and A/A′ groups), then the initiated pattern completion will de-emphasize mild perturbations of the environment. In CA1, in contrast, differences in the environment are represented more continuously (see Results and Discussion for details).
- Figure 2.
Summary of the behavioral data per epoch. For all epochs, there were no significant differences in the measures of exploratory behavior between groups as revealed by overall ANOVAs. Consequently, behavioral measures within an epoch were collapsed across groups for subsequent analyses. Although all rats explored actively the novel environments during both epoch 1 and epoch 2, as evidenced by the high number of zone transitions, object approaches and number of rearings, during epoch 2 there was a small, but statistically significant, decrease in exploratory behavior evident in all three behavioral measures when all groups were collapsed (see Results).
- Figure 5.
Within-animal correlations of neuronal ensemble activity between regions (CA3 and CA1) and across behavioral epochs. Epoch 1 ensemble activity is defined as the fraction of H1a+ cells (H1a+ plus Arc/H1a+) of the total counted cells, and epoch 2 ensemble activity is defined as the fraction of Arc+ cells (Arc+ plus Arc/H1a+) of the total counted cells (see Materials and Methods and Results for additional details). Ensemble activity levels between CA3 and CA1 were not correlated for either epoch 1 (a) or epoch 2 (b). This finding indicates that there is not a simple coactivation of these cell populations during exploratory behavior. In contrast, levels of activity within both CA3 (c) and CA1 (d) were modestly correlated across behavioral epochs. Furthermore, the within-rat ratio of CA3 to CA1 activity was strongly correlated across behavioral epochs (e). The fact that the CA3 and CA1 activity per epoch was not correlated across rats (a, b), but that the CA3/CA1 within-rat ratio was correlated across sessions, suggests that the balance of CA3 to CA1 activity is highly specific to the individual rat. The CA3/CA1 ratio was not related to the nature of the experience, because all groups were evenly distributed along the regression line (e), nor was it related to levels of general exploratory behavior, because the total exploration measures across epochs 1 and 2 were not significantly correlated (f). See Results for additional details.


