

Article Figures & Data
Figures
- Figure 1.
Complex-tone stimuli with fixed temporal regularity and different degrees of pitch salience. The schematic diagrams illustrate time (a) and frequency (b) representations of a complex tone (vertical lines). Auditory filters (solid and dotted curves in b) are excited by single harmonic components at low frequencies. Consequently, firing patterns after cochlear filtering represent individual low-numbered harmonics, and hence the components are resolved (c, top). In contrast, because filter band width increases with center frequency, several components excite high-frequency filters. The harmonics interact within the filter such that firing patterns after cochlear filtering result in complex waveforms whose repetition rates correspond to the fundamental frequency (c, bottom). Thus, the harmonic components are unresolved by the auditory system. Perceptually, complex tones comprising only unresolved harmonics produce weaker pitch than those comprising resolved harmonics. d, Because of our choice of F0 ranges and spectral regions, the complex tones in condition 2 included only unresolved harmonics and hence produced weaker pitch salience than the rest of the tonal conditions. Although a total of four tones were created per condition, for ease of visualization, only one is shown here. The wide-band background noise that accompanies the tones was added to mask distortion products at lower frequencies arising from nonlinear interactions between components at the level of the cochlea.
- Figure 4.
Cochlear nucleus and inferior colliculus showed robust activation that did not depend on pitch salience. a, b, Activation maps for contrasts between condition 1 and silence for a representative subject. The color activation maps are superimposed on grayscale anatomical images for the same subject. c, d, Average ± SEM normalized percentage signal change produced by tone conditions, relative to silence, within cochlear nuclei (c) and inferior colliculi (d). Percentage signal change was quantified for the lowest p value voxel in each structure and hemisphere, normalized to the condition yielding the highest percentage change, and then averaged across subjects. In both cochlear nucleus and inferior colliculus, activation did not differ significantly between conditions (c, d) and was therefore independent of pitch salience.
- Figure 2.
Low activation for complex tones with weak pitch salience in anterior auditory cortex. a, Differential activation maps based on data from five subjects superimposed on averaged anatomy and displayed in an inflated format. Light and dark gray regions correspond to gyri and sulci, respectively. White indicates areas of significant difference (p < 10-3) between conditions that differed in harmonic resolvability and hence in pitch salience. The qualitative center of mass for these areas (indicated by asterisks) had Talairach coordinates of 48.28, -10.52, 3.35 (right hemisphere) and -54.94, -4.83, 2.65 (left hemisphere). No differential activation was found in the contrasts between conditions that differed in F0 or frequency range alone. b, c, Average ± SEM normalized percentage signal change for each tone condition (b) or bandpass-filtered noise bursts (c), relative to silence, within the activation areas shown in a. Within complex-tone stimuli, condition 2, which produced weak pitch salience, elicited the lowest level of activation. Consistent with the interpretation that activity in these are as reflects pitch salience, noise bursts (no pitch) elicited activation levels that were lower than, or comparable with, those produced by the condition of weak pitch salience (c). Unlike the case of tones, different levels of activation for the noise conditions reflected differences in spectral region.
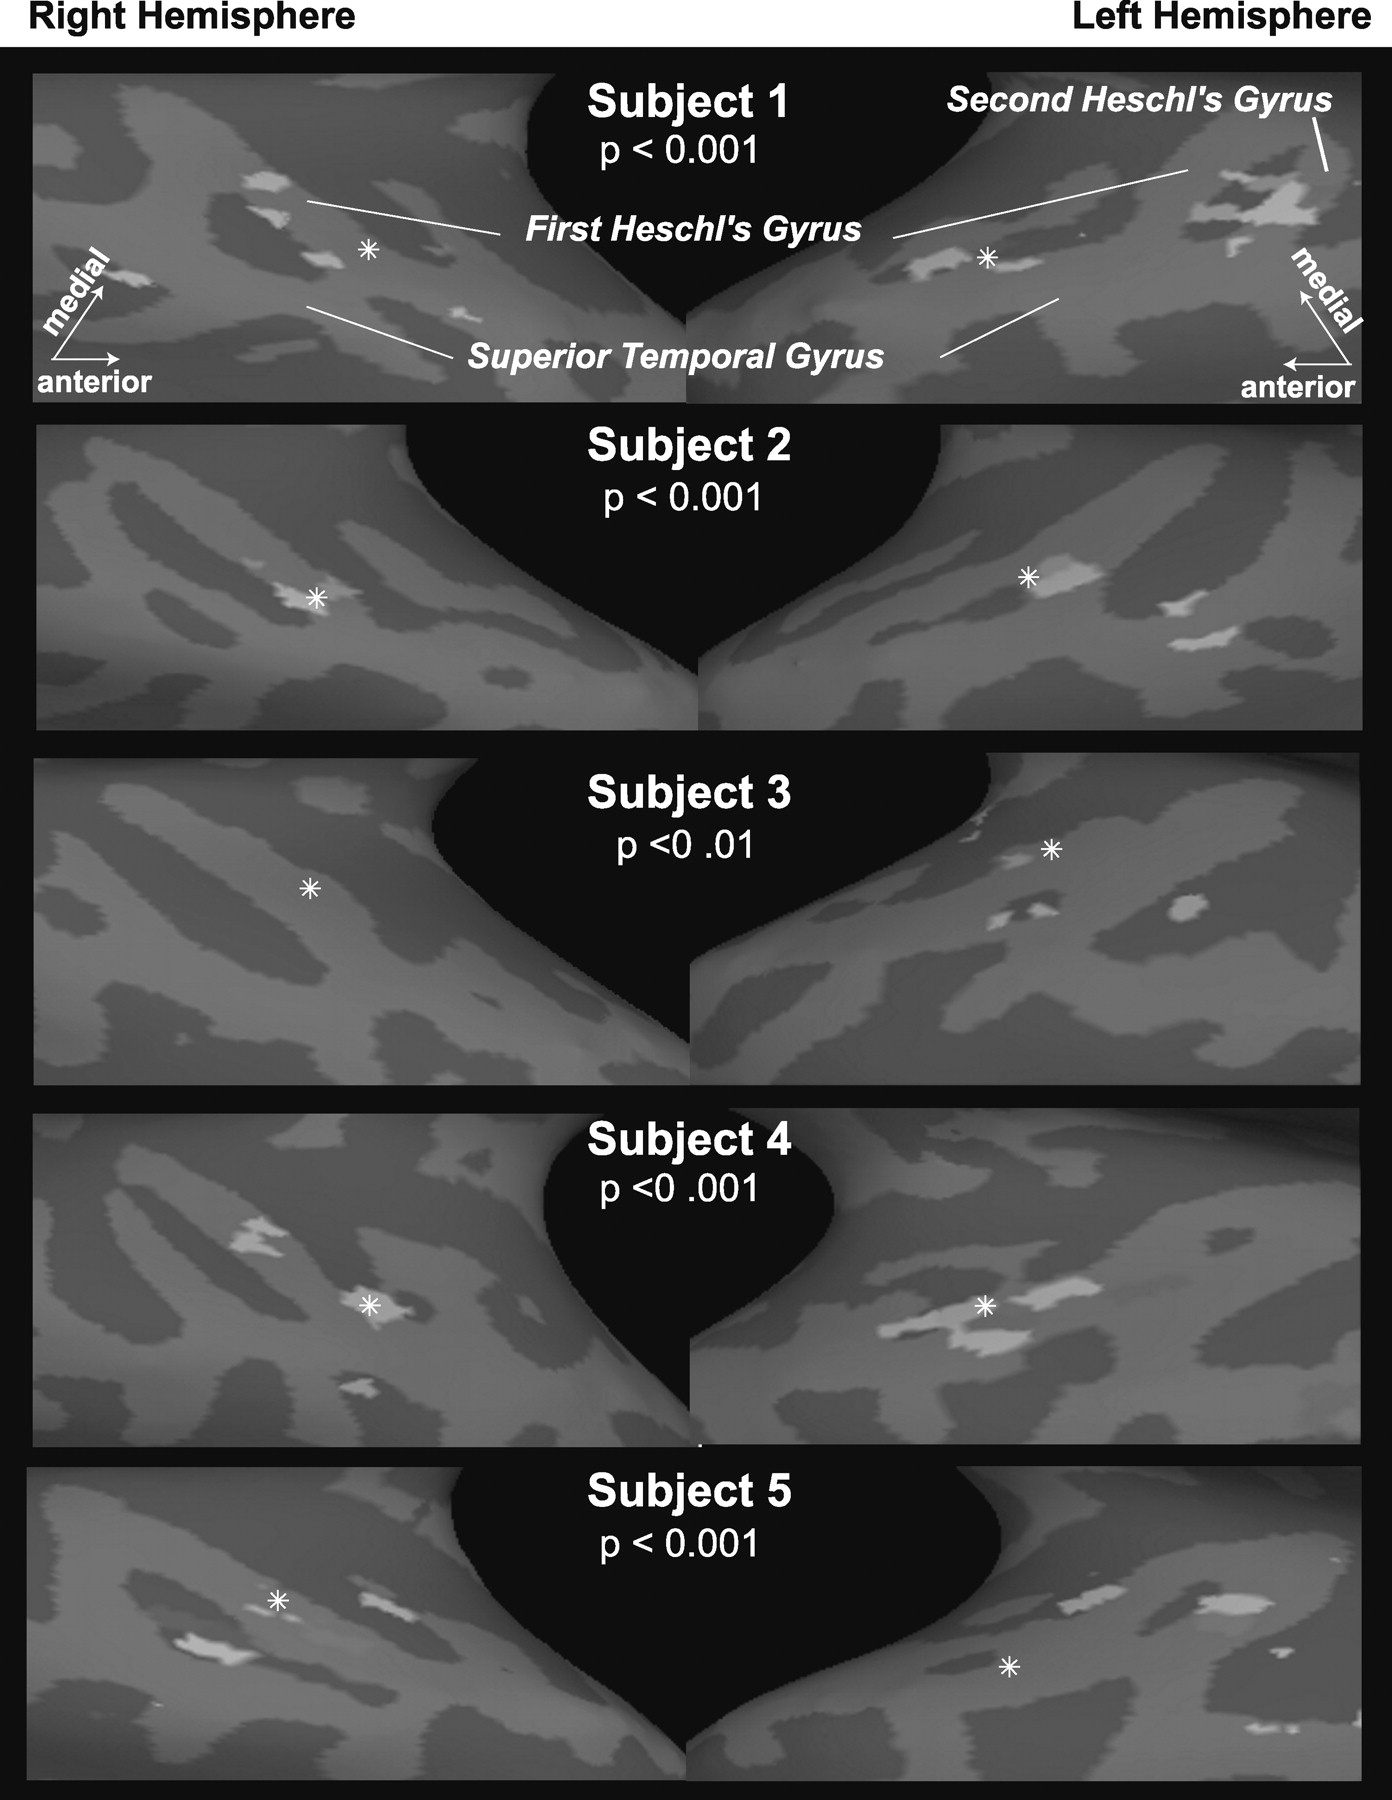
- Figure 3.
Differential activation maps in individual subjects showing areas sensitive to pitch salience. The map for each subject was constructed as in Figure 2. Asterisks mark the Talairach coordinates of the activation “center of mass” from the group analysis. In each of the individual hemispheres, the asterisk lies at the anterolateral end of first Heschl's gyrus. The majority of hemispheres show differential activation on anterolateral (first) Heschl's gyrus with some showing additional activation in posterior and lateral areas. For the purposes of this display, a less stringent activation threshold was used for subject 3 (p < 0.01) than for the other subjects (p < 0.001). Note that, within a region of interest defined by the group activation (Fig. 2), all hemispheres showed the lowest percentage signal change for condition 2 (even the right hemisphere of subject 3, which shows no differential activation).


