

Abstract
Embryonic stem (ES) cells provide a potentially unlimited source of specialized cells for regenerative medicine. The ease of inducing stable genetic modifications in ES cells allows for in vitro manipulations to enhance differentiation into specific cell types and to optimize in vivo function of differentiated progeny in animal models of disease. We have generated mouse ES cells that constitutively express Bcl-XL, an antiapoptotic protein of Bcl-2 family. In vitro differentiation of Bcl-XL overexpressing ES (Bcl-ES) cells resulted in higher expression of genes related to midbrain dopamine (DA) neuron development and increased the number of ES-derived neurons expressing midbrain DA markers compared with differentiation of wild-type ES cells. Moreover, DA neurons derived from Bcl-ES cells were less susceptible to 1-methyl-4-phenylpyridium, a neurotoxin for DA neurons. On transplantation into parkinsonian rats, the Bcl-ES-derived DA neurons exhibited more extensive fiber outgrowth and led to a more pronounced reversal of behavioral symptoms than wild-type ES-derived DA neurons. These data suggest a role for Bcl-XL during in vitro midbrain DA neuron differentiation and provide an improved system for cell transplantation in a preclinical animal model of Parkinson's disease.
- embryonic stem (ES) cells
- dopamine (DA) neurons
- Bcl-XL
- Parkinson's disease
- transplantation
- differentiation
Introduction
Among the key features of embryonic stem (ES) cells are the ability for near unlimited in vitro propagation and pluripotency, the potential to generate any cell types of an adult organism. These unique properties make ES cells a powerful assay system for developmental biology and a promising cell source for regenerative medicine. Parkinson's disease has become a prime target for cell therapy. Studies using dopamine (DA) neurons derived from primary human fetal tissue have demonstrated that grafted DA neurons can survive long term in vivo (Kordower et al., 1995) and ameliorate motor symptoms in Parkinson's disease (Lindvall and Hagell, 2000). The main concerns, however, are the limited availability of fetal tissue, heterogeneity of the grafted cells, as well as significant ethical concerns. ES cells might provide a promising alternative to the use of fetal tissue. Several methods have been developed to differentiate mouse ES cells into midbrain DA neurons. They include embryoid body (EB)-based multistep differentiation protocols (Lee et al., 2000) and coculture-based methods requiring the neural-inducing activities of stromal feeder cells (Kawasaki et al., 2000). Functionality of ES-derived DA neurons has been demonstrated in vivo recently using cells overexpressing the nuclear orphan receptor Nurr1 (Kim et al., 2002). Whereas ES-derived DA cells have been demonstrated to function in vitro (Lee et al., 2000) and in vivo (Kim et al., 2002), questions remain about long-term efficacy and potential side effects of this approach. Of particular concern is the possibility of incomplete or inappropriate ES cell differentiation with the associated risks, including tumor formation.
Antiapoptotic proteins of the Bcl-2 family are expressed in the developing and adult CNS and have been shown to protect various neuronal populations from cell death (for review, see Yuan and Yankner, 2000). In addition to protecting neuronal cell death, it has been suggested that Bcl-2 and the Bcl-2 homolog Bcl-XL may play a role during early CNS development (Abe-Dohmae et al., 1993; Krajewska et al., 2002), particularly within the developing cortical plate (Merry et al., 1994). Bcl-2 antiapoptotic family proteins have also been implicated in DA neuron development (Rolletschek et al., 2001), and they have been effective in protecting midbrain DA cells from toxic stimuli in animal models of Parkinson's disease (Offen et al., 1998; Yang et al., 1998; Hartmann et al., 2002).
These findings prompted us to generate mouse ES cells constitutively expressing Bcl-XL (Bcl-ES). Here, we report that Bcl-ES cells show enhanced DA and serotonin neuron differentiation with an associated increase in the expression of genes specific to midbrain and hindbrain development compared with wild-type ES cells. In addition, Bcl-ES-derived DA neurons were less sensitive to a parkinsonian neurotoxin 1-methyl-4-phenylpyridium (MPP+) than those obtained from wild-type ES cells. On transplantation, DA neurons derived from Bcl-ES cells exhibited an increased capacity for functional restoration in parkinsonian mice. These results suggest that Bcl-XL affects DA neuron development and function.
Materials and Methods
ES cell culture and in vitro differentiation. Mouse ES cells (R1) were propagated and differentiated in vitro as described previously (Lee et al., 2000), with some minor modications. Briefly, undifferentiated ES cells were grown on gelatin-coated tissue culture plates in the presence of 1000 U/ml leukemia inhibitory factor (LIF; Chemicon, Temecula, CA) in ES cell medium consisting of knock-out DMEM (Invitrogen, Grand Island, NY) supplemented with 15% FBS (Invitrogen), 100 mm MEM nonessential amino acids, 0.55 mm 2-mercaptoethanol, and antibiotics (all from Invitrogen) (stage 1). To induce EB formation (stage 2), the cells were dissociated to a single-cell suspension by 0.05% trypsin and 0.04% EDTA in PBS and plated in ES medium without LIF onto nonadherent bacterial culture dishes at a density of 2–2.5 × 10⁶ cells/dish. Four-day-old EBs were plated onto adherent tissue culture dishes and maintained in ES medium for 24 hr. The selection of nestin-positive cells (stage 3) was initiated by replacing the ES cell medium with serum-free insulin/transferrin/selenium medium (Okabe et al., 1996). After 6–10 d of selection, cells were trypsinized and plated on glass coverslips or culture dishes precoated with polyornithine (15 μg/ml; Sigma, St. Louis, MO)/fibronectin (1 μg/ml; Sigma or Invitrogen) at a concentration of 1–2 × 10⁵ cells/cm2. Fibronectin-coated coverslips placed in 24-well plates were air dried for 3–5 min, and 30–50 μl of dissociated cells was added to the center of each coverslip on a surface corresponding to ∼75 mm2 (10 cm in diameter). Approximately 5 min later, 450 μl of N2 medium (Johe et al., 1996) containing 20 ng/ml basic FGF (bFGF; R & D Systems, Minneapolis, MN) and 200 μm ascorbic acid (AA; Sigma) was added. Neural precursor cells were expanded in N2 medium supplemented with bFGF for 2–4 d (stage 4). The medium was changed every other day, and bFGF was added every day. Terminal differentiation (stage 5) was induced by withdrawal of bFGF in N2 medium supplemented with 200 μm AA. Cells were kept in differentiation conditions for 6–14 d.
Generation of Bcl-ES cell lines. To generate a vector, pEF1, expressing the gene of interest under control of the elongation factor-1 α (EF1α) promoter, we substituted the human CMV immediate early promoter of the pcDNA3.1(+) plasmid (Invitrogen) with the 1.2 kb human EF1α promoter (GenBank accession number J04617). A plasmid expressing antiapoptotic genes, Bcl-XL (pEF1-BclXL), under the control of the EF1α promoter, was constructed by engineering Bcl-XL cDNA (Kim et al., 1999) into the multiple cloning site of the pEF1 plasmid using EcoRI restriction enzyme.
R1 ES cells were electroporated (0.25 kV, 500 mF) with pEF1-BclXL or pEF1 (mock) and were selected in ES medium containing 200 μg/ml Neomycin (G418 Sulfate; Clontech, Palo Alta, CA). Neomycin-resistant clones were isolated, expanded, and screened for the expression of Bcl-XL by reverse transcription-PCR (RT-PCR) and Western blot analyses.
Immunocytochemistry. Cultured cells were fixed in 4% paraformaldehyde/0.15% picric acid in PBS [for GABA immunostaining, 0.2% glutaraldehyde (Sigma) was included in the fixative] and were incubated with primary antibodies overnight at 4°C. The following primary antibodies were used: nestin polyclonal 130 (1:50; provided by Martha Marvin and Ron McKay, National Institutes of Health, Bethesda, MD), tyrosine hydroxylase (TH) polyclonal (1:250; Pel-Freez, Rogers, AR) or monoclonal (1:1000; Sigma), dopamine β-hydroxylase (DBH) monoclonal (1:100; BD Biosciences/PharMingen, San Diego, CA), serotonin polyclonal (1: 2000; Sigma), GABA polyclonal (1:700; Sigma), neuron-specific class III β-tubulin (TuJ1) monoclonal (1:500) or polyclonal (1:2000; both from Babco, Richmond, CA), GFAP polyclonal (1:400; DAKO, Glostrup, Denmark), Engrailed-1 (En1) monoclonal (clone 4G11; 1:50; Developmental Studies Hybridoma Bank, Iowa City, IA), calbindin-D28K (CaBP) polyclonal (1:250; Chemicon), and dopamine transporter (DAT) polyclonal (1:5000; Chemicon). For detection of primary antibodies, fluorescence-labeled (FITC or Cy3) secondary antibodies (Jackson ImmunoResearch, West Grove, PA) were used according to the specifications of the manufacturer. Cells were mounted in Vectashield containing 4′,6-diamidino-2-phenylindole (DAPI; Vector Laboratories, Burlingame, CA) and analyzed under an epifluorescent microscope (Nikon, Tokyo, Japan).
Cell viability assays. Cell viability was measured by terminal deoxynucleotidyl transferase-mediated dUTP nick end labeling (TUNEL) analysis (Roche, Mannheim, Germany) and by the lactate dehydrogenase (LDH) assay (Promega, Madison, WI). TUNEL reactions were performed according to the manufacturer's instructions, and FITC-labeled TUNEL-positive cells were visualized directly by epifluorescence microscopy. The LDH test was performed as described previously (Shearman et al., 1995). In brief, cells were grown in each media for 2 d. LDH activities in the medium were measured by Cytotox 96, a nonradioactive kit (Promega), following the recommendations of the manufacturer. The results were expressed as percentages of maximum LDH release obtained on complete cell lysis after exposure to 1% Triton X-100. Each culture medium was used as negative control (0%).
The MPP+ cytotoxicity assay was performed by exposing stage 5 cells (day 6 of differentiation) to 2–50 μm MPP+ iodide (Sigma) for a duration of 24 hr. Cultures were subsequently fixed, and the number of TH-immunoreactive cells was counted.
RNA extraction and RT-PCR analysis. Total cellular RNA was isolated using TRI Reagent (Molecular Research Center, Cincinnati, OH), and 5 μg of total RNA was transcribed into cDNA using the Superscript kit (Invitrogen). Conditions for PCR reactions were optimized by varying MgCl2 concentrations and cycle numbers to determine linear amplification range. Amplification products were identified by size and confirmed by DNA sequencing. Primer sequences, cycle numbers, and annealing temperatures were: glyceraldehyde-3-phosphate dehydrogenase (GAPDH) (5′GGCATTGCTCTCAATGACAA3′, 5′AGGGCCTCTCTCTTGCTCTC3′, 25 cycles, 60°C, 165 bp); TH (5′TGTCAGAGGAGCCCGAGGTC3′, 5′CCAAGAGCAGCCCATCAAAG3′, 35 cycles, 60°C, 412 bp); Nurr1 (5′TGAAGAGAGCGGAGAAGGAGATC3′, 5′TCTGGAGTTAAGAAATCGGAGCTG3′, 30 cycles, 57°C, 255 bp); En1 (5′TCAAGACTGACTACAGCAACCCC3′, 5′CTTTGTCCTGAACCGTGGTGGTAG3′, 35 cycles, 60°C, 381 bp); Wnt1 (5′ACCTGTTGACGGATTCCAAG3′,5′TCATGAGGAAGCGTAGGTCC3′, 35 cycles, 62°C, 462 bp); Pax2 (5′CCAAAGTGGTGGACAAGATTGCC3′, 5′GGGATAGGAAGGACGCTCAAAGAC3′, 35 cycles, 58°C, 545 bp); Pax5 (5′CAGATGTAGTCCGCCAAAGGATAG3′, 5′ATGCCACTGATGGAGTATGAGGAGCC3′, 30 cycles, 57°C, 451 bp); Bcl-XL (5′CAAGCTTTCCCAGAAAGG3′, 5′TGAAGAGTGAGCCCAGCA3′, 25 cycles, 57°C, 702 bp); α-fetoprotein (5′AGTGCGTGACGGAGAAGAAT3′, 5′TCTGGAAGCACTCCTCCT3′, 30 cycles, 58°C, 494 bp); aldolase B (5′TCTCCGTCAGGAAGCACCTC3′,5′ATGGCCTCTCTGAACGCTGT3′, 30 cycles, 58°C, 202 bp); transthyretin (TTR) (5′AGTCCTGGATGCTGTCCGAG3′, 5′TTCCTGAGCTGCTAACACGG3′, 30 cycles, 58°C, 440 bp); Flk-1 (5′CCTGGTCAAACAGCTCATCA3′, 5′AAGCGTCTGCCTCAATCACT3′, 35 cycles, 58°C, 599 bp); collagen IV (5′CAAGCATAGTGGTCCGAGTC3′, 5′AGGCAGGTCAAGTTCTAGCG3′, 30 cycles, 58°C, 463 bp); Ptx3 (5′CGTGCGTGGTTGGTTCAAGAAC3′,5′GCGGTGAGAATACAGGTTGTGAAG3′, 35 cycles, 55°C, 257 bp); c-ret (5′GCGCCCCGAGTGTGAGGAATGTGG3′, 5′GCTGATGCAATGGGCGGCTTGTGC3′, 30 cycles, 58°C, 442 bp); l-aromatic amino acid decarboxylase (AADC) (5′CCTACTGGCTGCTCGGACTAA3′, 5′GCGTACCAGTGACTCAAACTC3′, 30 cycles, 58°C, 163 bp); DAT (5′GGACCAATGTCTTCAGTGGTGGC3′, 5′GGATCCATGGGAGGTCCATGG3′, 30 cycles, 58°C, 289 bp); GAD67 (5′AATTGCACCCGTGTTTGTTCTTAT3′, 5′AGCGCAGCCCCAGCCTTCTTT3′, 30 cycle, 56°C, 338 bp); glutamate transporter (GluT) (5′AAAGTTCAGAGCCTCACCAAG3′, 5′GATCAAATCCAGGAAGGCATC3′, 30 cycle, 56°C, 486 bp); vesicular monoamine transporter 2 (5′CTTTGGAGTTGGTTTTGC3′,5′GCAGTTGTGGTCCATGAG3′, 33 cycle, 55°C, 301 bp).
Real-time PCR was performed on an iCycler iQ (Bio-Rad, Hercules, CA) using SYBR Green (Molecular Probes, Eugene, OR) according to the manufacturer's instructions. For quantification of relative gene expression, PCR products intercalated with SYBR fluorescence were measured in real time during the extension step, and all gene expression values were normalized to those of GAPDH.
Western blot analysis. Cultured cells were lysed in 50 mm Tris, pH 7.5, 150 mm NaCl, 1 mm EGTA, 1 mm EDTA, 0.5% NP-40, 1% Triton X-100, 1 mm NaF, 1 mm PMSF, 1 mm DTT, 10 μg/ml aprotinin, and 10 μg/ml leupeptin. Protein concentration was determined using a commercial kit (Bio-Rad). A total of 10 μg of protein each was run on a 10% SDS-polyacrylamide gel and transferred to a nitrocellulose membrane (Amersham Pharmacia Biotech, Uppsala, Sweden). The blot was probed with an anti-Bcl-XL mouse antibody (1:80; Sigma), anti-TuJ1 mouse antibody (1:1000; Babco), anti-TH mouse antibody (1:2000; Sigma), or anti-β-actin mouse antibody (1:1000; Sigma), followed by anti-mouse IgG conjugated to peroxidase (1:2000; Cell Signaling Technology, Beverly, MA). Bands were visualized with ECL (ECL detection kit; Amersham Pharmacia, Buckinghamshire, UK).
DA determination by reverse-phase HPLC. DA levels were determined at day 14 of stage 5 cells in conditioned medium (48 hr after the last medium change), in HBSS (15 min, basal release) and in HBSS plus 56 mm KCl (15 min, evoked release). All samples were stabilized immediately with orthophosphoric acid (7.5%)/metabisulfate (0.22 mg/ml) and stored at –80°C before analysis (Studer et al., 1996). Proteins and other macromolecular components were removed from the sample at 1500 gm using a YM-10 Microcon centrifugal filter unit (Millipore, Bedford, MA). DA was extracted by aluminum adsorption and eluted in 0.1 m perchloric acid. Samples (20 μl) were injected with a Rheodyne injector and separated with a reverse-phase μ-Bondapak C18 column (150 × 3.0 mm; Eicom, Kyoto, Japan) maintained at 32°C with a column heater (Waters, Cotland, NY). The mobile phase consisted of 0.05 m citric acid, 0.05 m disodium phosphate, pH 3.1, 3.2 mm 1-octanesulfonic acid (sodium salt), 0.3 mm EDTA, and 12% methanol and was pumped at a flow rate of 0.5 ml/min using a solvent delivery system (Waters). Electroactive compounds were analyzed at +650 mV using an analytical cell and an amperometric detector (model ECD-300; Eicom). DA levels were calculated using external standards injected immediately before and after each experiment.
Surgical procedures and behavioral testing. Animals were housed and treated following National Institutes of Health guidelines. Adult male Sprague Dawley rats (220–250 gm) were lesioned by unilateral stereotactic injection of 4 μl of 6-hydroxydopamine (6-OHDA, 3 μg/μl; Sigma) into the substantia nigra [coordinates: anteroposterior (AP), –4.8 mm; mediolateral (ML), 1.5 mm; dorsoventral (V), 8.2 mm] and the median forebrain bundle (AP, –1.8 mm; ML, 1.8 mm; V, 8.0 mm). The incisor bar was set at –3.5 mm; AP and ML coordinates are given relative to bregma.
Three weeks after the 6-OHDA lesioning, the animals were tested for rotational asymmetry after intraperitoneal injection of 3 mg/kg d-amphetamine sulfate (Sigma). Animals with an average of five or more turns per minute over a 30 min interval were selected and assigned randomly to treatment or control groups.
Forelimb akinesia was assessed by the “stepping test” (Olsson et al., 1995). Animals were adapted to the test conditions 5 d before the actual test. Both hind limbs as well as one forelimb were fixed by the investigator, whereas the unrestrained forepaw was touching the table. The number of adjusting steps was counted while the rat was moved sideways along the table surface (90 cm in 10 sec). Each stepping test consisted of three trials for each forepaw, alternating between forepaws. In all experiments, the average of the three trials for each forepaw was used for analysis. The results were expressed as a percentage of steps performed with the lesioned side compared with the unlesioned side. The test was performed three times before grafting and repeated in weekly intervals for 8 weeks after cell transplantation. The absolute number of adjusting steps in each group of animals before transplantation were: intact paw: 18.4 ± 1.4 (control-ES grafted), 18.3 ± 1.7 (Bcl-ES grafted), 19.9 ± 1.0 (sham operated), and 19.8 ± 1.2 (sham operated with cyclosporine treatment); lesioned paw: 2.5 ± 0.4 (control-ES grafted), 2.1 ± 0.2 (Bcl-ES grafted), 2.2 ± 0.3(sham operated), and 2.1 ± 0.3 (sham operated with cyclosporine treatment).
For transplantation, cells (day 2 of stage 5) were dissociated by trypsinization and resuspended in normal saline. Using a 20 gauge needle, 5 μl of the cell suspension (105 cells/μl) were injected over a 5 min period into the ipsilateral striatum (AP, +0.2 mm; ML, 3.0 mm; V, 5.5 mm; incisor bar set at 3.5 mm). The needle was left in place for 3–5 min after the completion of each injection. The rats received daily injections of cyclosporin A (10 mg/kg, i.p.) starting 24 hr before grafting and continuing for 3 weeks, followed by a reduced dose of 5 mg/kg for the remaining in vivo period.
Histological assessment for grafted TH-immnoreactive cells. Four or 6 weeks after transplantation, animals were anesthetized (50 mg/kg penobarbital) and perfused intracardially with 4% paraformaldehyde in PBS. Brains were removed and immersed in 30% sucrose in PBS overnight and sliced on a freezing microtome (CM 1850; Leica, Wetzlar, Germany). Free-floating brain sections (35 μm thick) were subjected to TH immunohistochemistry as described above.
Confocal image stacks of the graft were obtained (LSM510; Zeiss, Feldbach, Switzerland), and the morphometric assessment for neurite outgrowth was performed from uniform areas selected randomly across the cell graft using Axiovision image analyzer (Zeiss, Zena, Germany), as described previously (Oh et al., 1996). All quantitative analyses were confirmed by independent investigators (J.-W.S., M.-Y.C., and E.R.). The length of the primary neurite was defined as the distance from the soma to the tip of the longest branch. The combined neuritic length was defined as the total lengths of all neurites per cell combined.
TH-immunoreactive cells in the graft were counted by analyzing every sixth uniform section (35 μm thick) selected randomly. Graft areas were determined using an image analyzer (AnalySIS, version 3.2; Soft Imaging System, Munster, Germany), and the Cavalieri estimator was used to calculate graft volumes. TH-immunoreactive cell bodies with DAPI nucleus counterstaining were counted within the outlined graft area used for volume estimation. The total number of TH-immunoreactive cells in the graft was estimated by multiplying the number of TH+ cells/section by the number of sections counted and the section interval. The Abercrombie correction factor [N = n × T/(T + D)], where N is the actual number of cells, n is the number of nuclear profiles, T is the section thickness (35 μm), and D is the average diameter of nuclei, was used to compensate for double counting in adjacent sections. No difference in the nucleus diameters of grafted TH+ cells was observed in the animals grafted with control-ES and Bcl-ES in the present study (4.68 ± 0.13 vs 4.76 ± 0.11 μm; p = 0.332).
Cell counting and statistical analysis. Cell counting was performed in uniform microscopic fields, chosen randomly across the area where cells were grown, using an eye piece grid at a final magnification of 200× or 400×. In case of stages 4 and 5 ES cultures, cells were counted in 5–10 microscopic fields of each well, and 3–6 culture wells were analyzed in each experiment. Data are expressed as mean ± SEM. Statistical comparisons were made by ANOVA with Tukey post hoc analysis (SPSS 11.0; SPSS, Chicago, IL) when more than two groups were involved.
Results
Bcl-XL overexpression enhances the efficiency of neuronal differentiation from ES cells
We previously developed a five-stage EB-based differentiation protocol for the generation of ES-derived midbrain DA neurons (Lee et al., 2000). However, the efficiency and reproducibility of the neural differentiation response using this protocol can be hampered by extensive cell death typically occurring at stage 3 of differentiation (selection of ectodermal/neuroectodermal precursors). We hypothesized that expression of Bcl-XL might prevent cell death and improve efficiency of the neural differentiation.
First, we examined the endogenous expression of Bcl-XL in ES cells during each of the five stages of differentiation using semi-quantitative RT-PCR. Bcl-XL expression, barely detectable at the undifferentiated ES cell state (stage 1), gradually increased up to stage 4 (neural precursor stage) and remained at that high level during neuronal differentiation in stage 5 (Fig. 1A). This finding is consistent with the in vivo expression patterns showing increased expression of Bcl-XL from the time of early neural tube formation [embryonic day (E) 8] to its highest levels reached at E12 to postnatal days 5–10, followed by high levels maintained to adulthood (Krajewska et al., 2002).

A, In vitro Bcl-XL expression along the developmental stages of ES cells. R1 ES cells were induced to differentiate into neuronal lineage by a five-stage EB-based differentiation protocol. RNAs were prepared from each differentiation stage of ES cells, and Bcl-XL expression was analyzed by RT-PCR. Bcl-XL expression increased progressively in the ES cells by undergoing the neuronal differentiation. B, C, Construction of ES cell clones that express exogenous Bcl-XL. R1 ES cell were transfected with either Bcl-XL-expressing vector pEF-BclXL or with empty vector pEF as a negative control. Four pEF-BclXL-transfected clones and one mock-transfected clone were assessed for Bcl-XL expression using RT-PCR (B) and Western blot analysis (C). C1, Untransfected R1 cell; C2, pEF-transfected clone; #, clones selected for additional analysis.
We subsequently generated R1 ES cells that stably overexpress Bcl-XL under the control of the EF1α promoter, a promoter used previously for efficient transgene expression in ES-derived neurons (Chung et al., 2002). We obtained 15 G418-resistant clones and detected high levels of Bcl-XL expression in four of four clones tested compared with wild-type or mock (empty pEF1 vector)-transfected control R1 ES cells (Fig. 1B,C). The properties among all four Bcl-XL-expressing clones (Bcl-ES) were undistinguishable with regard to proliferation, survival, and efficiency of neuronal differentiation. Similarly, there was no difference in these parameters between mock-transfected and nontransfected control clones. Thus, all subsequent comparisons between Bcl-XL-expressing and control cells were based on using Bcl-XL clones 2 or 4 compared with the mock-transfected clone (control-ES).
Bcl-ES cells exhibited significantly less cell death during neural differentiation compared with control-ES cells. Using the LDH test at stages 3, 4, and 5, the percentage of dead cells for control-ES and Bcl-ES were: 75.5 ± 4.6% in control-ES versus 48.5 ± 2.7% in Bcl-ES cultures (stage 3), 49.1 ± 3.9 versus 33.4 ± 1.8% (stage 4), and 55.8 ± 2.8 versus 40.2 ± 3.6% (stage 5) (Fig. 2B) (p < 0.001 for all stages). Similarly, there were significant decreases in TUNEL-positive cells (Fig. 2C) (p < 0.001) and cells with apoptotic nuclei (Fig. 2D) (p < 0.001) in Bcl-ES cultures at stage 4 and 5 cells. The overall yield of stage 5 cells was 150 ± 15 cells for every undifferentiated control-ES cell plated at stage 1 compared with 360 ± 18 for Bcl-ES cells (Fig. 2A) (p < 0.001)

Effect of Bcl-XL on survival of ES cells during in vitro neuronal differentiation. A, Yields in total cell numbers during in vitro differentiation from ES cells. Each value represents mean ± SEM (n = 4) of fold increase in cell number relative to that of undifferentiated ES cells before the expansion of undifferentiated ES cells (stage 1). B, Cytotoxicity estimated by LDH test. The results are expressed as the percentage of maximal LDH release activity that was obtained after complete cell lysis. C, D, Apoptotic cell death assays as assessed by the TUNEL labeling test (C) and direct counting cells with apoptotic nuclei (D). C, Bottom, Representative TUNEL stains in stage 5 control-ES and Bcl-ES cultures. The images in phase and TUNEL fluorescence (arrow) are merged. Fragmented or condensed nuclei characteristics of apoptotic cells (D, bottom, arrow) were visualized by DAPI nuclear staining. Scale bar, 20 μm. Data are shown as mean ± SEM. *Significantly different from control-ES at p < 0.001 by one-way ANOVA.
The percentage total (DAPI+) of cells that expressed nestin, an intermediate filament specific to neural precursors, at stage 4 was 70.4 ± 6.8 and 80.0 ± 9.5% for control and Bcl-XL-expressing cells, respectively (Fig. 3A) (p < 0.05). After 6 d of differentiation (stage 5; bFGF withdrawal), 58.1 ± 5.2 and 70.0 ± 7.6% of all cells expressed TuJ1 in control and Bcl-ES cells, respectively (Fig. 3B) (p < 0.001). No significant differences were observed in the number of GFAP+ astrocytes (13.7 ± 4.3 in control-ES vs 12.8 ± 4.8 in Bcl-ES cultures; p = 0.369). These data demonstrate an effect of Bcl-XL on overall neural yield and an increased percentage of ES-derived neuronal progeny.

Exogenous expression of Bcl-XL in ES cells enhances the yields of neural precursors at stage 4 (A) and neurons at stage 5 (B, C). Neural precursors differentiated from ES cells were proliferated in the presence of bFGF for 4 d (stage 4), and differentiation of the neural precursors was induced by withdrawal of bFGF for 6 d (stage 5). A, B, Top, Representative immunostaining images for nestin (A) at stage 4 and TuJ1(red)/GFAP(green) (B) at stage 5. A, insets, DAPI nuclear staining of the same field. Scale bar, 20 μm. The results shown in the bottom graphs of A and B are mean ± SEM. *p < 0.05 and **p < 0.001, significantly different from control-ES. C, Western blot analysis for TuJ1 protein on stage 5 of control-ES and Bcl-ES.
Neuronal subtype differentiation
Nestin+ precursors at stage 4 express markers of midbrain–hindbrain fate preceding differentiation into midbrain dopaminergic and hindbrain serotonergic neurons (Lee et al., 2000). Bcl-XL overexpression led to an increase in the expression of midbrain–hindbrain genes Pax2, Pax5, Wnt1, and En1. Pax2, Wnt1, and En1 showed the most prominent increases in expression at stage 3, whereas Pax5 expression was increased at stage 4 (Fig. 4). The sequential induction of the midbrain–hindbrain genes by Bcl-XL is consistent with normal development, with Pax-2 being the earliest gene expressed, followed by Wnt1 and En1, followed by Pax 5 expression being the latest among these organizers (Rowitch and McMahon, 1995; Okafuji et al., 1999). These findings suggest that Bcl-XL facilitates ES differentiation into precursors with midbrain and hind-brain characteristics. Interestingly, expression of genes specific to endodermal (α-fetoprotein, aldolase B, and TTR) and mesodermal (Flk-1 and collagenase IV) fate were downregulated in Bcl-ES cells (Fig. 4).

Bcl-XL upregulates the expression of genes characteristic to midbrain and hindbrain fates during in vitro differentiation of ES cells. RT-PCR analyses of the genes specific to midbrain development and endodermal or mesodermal markers were performed at different stages of control-ES versus Bcl-ES cell cultures. A, Ethidium bromide staining of PCR products in control-ES (C) and Bcl-ES (B). These gene expression patterns, consistently obtained in at least two PCR experiments with the series of RNAs, were prepared independently. B, Real-time PCR analyses for identical genes. Each gene expression value was normalized to that of GAPDH and expressed relative to the respective value of the stage 3 control-ES culture. The boxes and bars represent mean and SEM. *p < 0.001 (n = 6).
A specific effect of Bcl-XL on midbrain–hindbrain development was further supported by increased percentages of DA and serotonin neurons at stage 5. Whereas control-ES cells yielded 18.4 ± 3.7% TH-positive neurons, Bcl-XL expression increased this level to 30.9 ± 4.6% (Fig. 5A) (p < 0.001). In agreement of with the immunocytochemical results, Western blot analysis revealed more TH protein in Bcl-ES cultures (Fig. 5B). Similarly, serotonin+ cells were increased from 9.4 ± 3.1% in control-ES to 15.1 ± 3.8% in Bcl-ES (Fig. 5A) (p < 0.001). However, no significant differences between Bcl-ES and control-ES cells were observed for GABA neurons (10.2 ± 4.1% in control vs 10.9 ± 5.7 in Bcl-ES).

Increased yields of DA neurons by Bcl-XL overexpression. A, Double immunocytochemical analysis for TH (red) and serotonin (green). Scale bar, 20 μm. B, Western blot analysis for TH protein. C, Semiquantitative (left) and real-time PCR (right) analyses for the genes specific to general DA [TH, AADC, DAT, and vesicular monoamine transporter 2 (VMAT2)] and midbrain-specific DA phenotypes (Nurr1, Ptx-3, and c-ret). C, Left, Data are mean ± SEM of respective gene expression in Bcl-ES cells relative to that in control-ES cells (n = 4 for all values). The immunostaining, Western blot, and RT-PCR analyses were performed at day 6 of stage 5 in control-ES and Bcl-ES cultures. *p < 0.001, significantly different from control-ES.
Midbrain dopaminergic properties of Bcl-ES-derived TH+ neurons
Semiquantitative and real-time RT-PCR analyses showed increased expression in Bcl-ES-derived neurons for genes related to DA synthesis (TH and AADC) as well as general DA neuronal (DAT) and midbrain DA neuronal (Nurr1, Ptx-3, and c-ret) markers (Fig. 5C). However, no significant difference in GAD67 (GABAergic marker) and GluT (glutamertergic marker) expressions was observed between stage 5 cells in Bcl-ES and control-ES cultures. This suggests that Bcl-XL enhances overall midbrain DA neuron differentiation and is not limited to TH expression.
The dopaminergic nature of the TH+ neurons was further confirmed using immunocytochemical anlaysis by the absence of DBH expression (noradrenergic marker; data not shown) and the presence of the DAT. DAT is a membrane-anchoring protein specifically expressed in postmitotic DA neurons (Fujita at al, 1993). After 6 d of stage 5 differentiation, DAT was colocalized in 46.1 ± 24.3 and 54.5 ± 8.3% of TH+ cells in control-ES and Bcl-ES cultures, respectively. The percentage of total cells coexpressing TH/DAT was significantly increased in Bcl-ES cultures compared with control cultures (Fig. 6A) (10.5 ± 2.5 vs 17.7 ± 2.6%; p < 0.001). En1 is a transcriptional factor specifically expressed in midbrain-specific DA cells from early precursors late to postmitotic neurons (Wallen et al., 1999; Simon et al., 2001). As reported previously (Kim et al., 2002), En-1 was colocalized in over 98% of ES-derived TH+ cells (Fig. 6B), suggesting midbrain identity of the TH+ cell population. Bcl-XL expression led to a threefold increase in En1+ cells at stage 5 (14.5 ± 3.8 vs 43.1 ± 6.6% of total cells; p < 0.001). CaBP protein is a calcium-binding protein expressed in a subset of midbrain DA neurons (for review, see Andressen et al., 1993), and colocalization of CaBP in DA neurons correlates with increased resistance to cell death in Parkinson's disease (Yamada et al., 1990; Gaspar et al., 1994; Damier et al., 1999). Bcl-XL overexpression led to a significant increase in the CaBP+ neuronal population from 11.5 ± 2.2 to 18.3 ± 2.8% (Fig. 6C) (p < 0.001) of the total cell population. The percentage of cells coexpressing TH and CaBP was 1.94 ± 0.4% in control-ES versus 10.5 ± 3.5% in Bcl-ES (p < 0.01) cultures.

A–C, Characterization of TH+ cell derived from control-ES and Bcl-ES cells. Immunocytochemical analyses for TH/DAT (A), TH/En1 (B), and TH/calbindin (C). Shown on the right in A–C are representative images obtained from the respective imminostainings. Scale bar, 20 μm. D, HPLC quantification of DA in conditioned medium (48 hr), released in HBSS for 15 min (HBSS), and released in HBSS with 56 mm KCl for 15 min (HBSS/KCl). After a 14 d differentiation of stage 5, DA levels were determined using reverse-phase HPLC, as described in Materials and Methods. Data represent mean ± SEM (n = 5). *p < 0.001 and **p < 0.01, significant differences from the respective values in control-ES were noted.
Functional characterization of control-ES and Bcl-ES cultures was performed at day 14 of stage 5 via reverse-phase HPLC analysis of DA. Conditioned medium (48 hr after last medium change) from Bcl-ES-derived stage 5 cells showed a marked increase in DA levels (Fig. 6D) (312 ± 40 pg/106 cells in control-ES vs 601 ± 51 pg/106 cells in Bcl-ES cultures; n = 5; p < 0.01). No epinephrine and norepinephrine were detected. Basal DA release in cultures incubated with HBSS for 15 min was 125 ± 12 pg/106 cells in control-ES and 178 ± 13 pg/106 cells in Bcl-ES cultures. Evoked DA release after 15 min of exposure to 56 mm KCl in HBSS yielded 205 ± 15 pg/106 cells in control-ES versus 286 ± 12 pg/106 cells in Bcl-ES cultures (n = 5; p < 0.01).
Bcl-ES-derived DA cells are more resistant to MPP+
Nigrostriatal dopaminergic degeneration in Parkinson's disease is mimicked by exposure to the neurotoxin 1-methyl-4-phenyl-1,2,3,6-tetrahydropyridine (MPTP). MPP+ is the toxic metabolite of MPTP, which selectively kills DA neurons in vitro and in vivo. MPP+ was added at concentrations ranging from 2 to 50 μm to stage 5 ES cell cultures to compare the response of Bcl-ES- and control-ES-derived DA neurons to this cytotoxic stimulus. Control-ES cultures showed a significant (40–85%) dose-dependent reduction in the number of TH+ cells (Fig. 7A). Similarly, the number of cells with apoptotic nuclei in control-ES cultures was gradually increased in a MPP+ concentration-dependent manner (data not shown), suggesting MPP+ induced cell death of DA neurons but not merely downregulation of TH phenotype (Dalia et al., 1996; Ara et al., 1998). In contrast, no significant decrease in TH+ cell numbers was observed at MPP+ concentrations of 2–20 μm in the Bcl-ES cultures. Only MPP+ concentration of 50 μm led to a significant decrease in Bcl-ES-derived TH+ cells.

A, Bcl-ES-derived DA neurons are more resistant to MPP+ cyctotoxicity. MPP+ was added at concentrations ranging from 2 to 50 μm for 24 hr at day 6 of stage 5 in control-ES and Bcl-ES cultures. Cultures were then fixed and immunostained for TH, and the surviving TH+ cells were counted. Data shown in each case are the mean ± SEM of 40–50 counts from three independent experiments and are expressed as the percentage of untreated culture. *p < 0.01, significantly different from the value of control-ES cultures at each MPP+ concentration by one-way ANOVA. B, Extensive neurite outgrowths of the cells differentiated from Bcl-ES cells. After stage 3 of ES cell differentiation, cells were plated on the center region of fibronectin-coated coverslips, as described in Materials and Methods. Inverted microscopic images were obtained from the periphery of the cell clusters in control-ES (left) and Bcl-ES (right) at day 6 of stage 5. Scale bar, 20 μm
Interestingly, Bcl-ES-derived neurons appeared to exhibit more extensive neurite outgrowth particularly in areas of the culture plate with lower cell densities (Fig. 7B).
Transplantation of the DA neurons derived from control-ES or Bcl-ES cells
In vivo function of Bcl-ES-derived DA neurons was tested by intrastriatal transplantation into hemi-parkinsonian rats. Histological analysis 4 weeks after transplantation showed an increased number of TH+ cells in animals that received Bcl-ES-derived neurons (18,309 ± 1357 cells/animal) compared with those grafted with cells derived from control-ES cells (11,284 ± 1147 cells; n = 5 for each group; p < 0.01). However no difference was observed in the ratio of surviving TH+ cells between the Bcl-ES and control groups as estimated by dividing the number of surviving TH+ cells in vivo by the number of TH+ cells counted after 6 d of in vitro differentiation in cultures prepared in parallel to the in vivo study (16.1% in Bcl-ES vs 14.5% in the control group). No significant difference in graft size was observed between the control-ES- and Bcl-ES-grafted groups. The average graft volumes at week 4 of after transplantation were 4.1 ± 0.2 mm3 (control-ES) and 4.3 ± 0.3 mm3 (Bcl-ES), resulting in TH-immunoreactive cell densities of 2752 ± 280 cells per mm3 (control-ES) and 4258 ± 316 cells per mm3 (Bcl-ES).
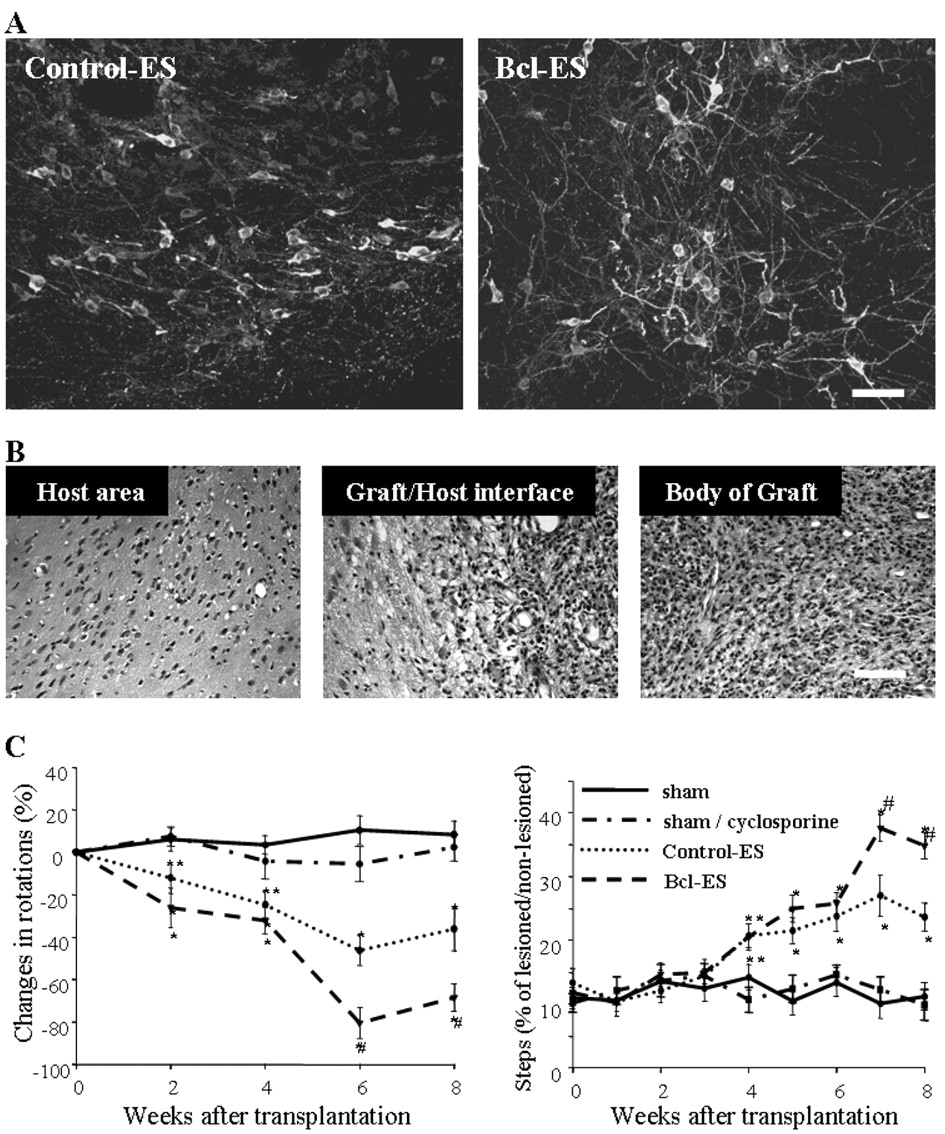
There was a remarkable difference in the morphological maturation of the TH+ cells in Bcl-ES- and control-ES-derived grafts. Bcl-ES-derived TH+ cells exhibited numerous long processes extending into the host striatum (Fig. 8A). Morphometric analyses within the grafts revealed a significant increase in the number of neurites, length of the primary neurite, and total neuritic length of Bcl-ES-derived TH neurons (Table 1). Hematoxylin–eosin staining showed uniform grafts without any indication of teratoma formation in both Bcl-ES and control grafts (Fig. 8B).

In vivo differentiation and function of Bcl-ES- or control-ES-derived DA neurons. A, Confocal microscopic images for TH-stained sections of hemi-parkisonian rats grafted with control-ES cells (left) and Bcl-ES cells (right). Four weeks after transplantation, animals in the control-ES and Bcl-ES cell-grafted groups were killed. Immunostaining for TH was performed, and the TH images shown were obtained by stacking z-series through the thickness of section (35 μm). Note the more and longer TH+ processes that extend from the graft of Bcl-ES cells. Scale bar, 20 μm. B, Microscopic images of hematoxylin–eosin-stained graft of Bcl-ES cells obtained 6 weeks of after transplantation. Scale bar, 40 μm. C, Behavioral analysis. 6-OHDA-lesioned hemi-parkinsonian rats were grafted with differentiated control-ES cells (n = 8) or Bcl-ES cells (n = 8). For the negative controls, 10 animals were sham operated and kept without (sham; n = 5) or with (sham/cyclosporine; n = 5) cyclosporine treatment under the identical schedule with the cell-grafted animals. Amphetamine-induced rotation response (left). Data are given as the mean ± SEM of changes in rotation scores for each animal compared with pretransplantation values. Stepping test (right). The results are expressed as a percentage of the lesioned side relative to the number of steps with the nonlesioned paw. Analysis was by ANOVA, followed by a Newman–Keuls test: *p < 0.01 and **p < 0.05, compared with the sham-operated group; #p < 0.01, compared with the control-ES cell grafted group.
Comparison of neurite outgrowth between control-ES- and Bcl-ES-derived TH + cells in the graft
In vivo function was assessed by amphetamine-induced rotation behavior for 8 weeks after transplantation. The average percentage decrease in rotation scores compared with pretransplantation values were: week 2, 12.2 ± 7.3% (control-ES grafted; n = 8) versus 26.2 ± 9.3% (Bcl-ES grafted; n = 8); week 4, 24.8 ± 6.5 versus 32.2 ± 6.4%; week 6, 46.3 ± 7.2 versus 80.5 ± 7.3%; and week 8, 36.2 ± 10.3 versus 68.5 ± 6.4%, after 2, 4, 6, and 8 weeks of transplantation (Fig. 8C). In addition, akinesia of lesioned forelimb in parkinsonian rats was assessed by the stepping test, a nonpharmacological evaluation. Overall, cell-grafted animals demonstrated significant improvement in the adjusting step of the lesioned paw after 4 weeks of transplantation (Fig. 8C): percentages of steps in the lesioned compared with the nonlesioned sides were 10–14% in sham-operated versus 20–38% in the cell-grafted animals during 4–8 weeks after transplantation. Animals grafted with Bcl-ES cells, compared with those grafted with control-ES cells, showed a more significant recovery in adjusting step number with lesioned forelimb: 27.1 ± 3.2% in control-ES versus 37.6 ± 2.1% in Bcl-ES grafted at week 7 (p < 0.01) and 23.7 ± 2.2 versus 34.9 ± 2.1% at week 8 (p < 0.01).
Discussion
Our data demonstrate that Bcl-XL overexpression promotes differentiation of mouse ES cells into midbrain dopaminergic and hindbrain serotonergic neurons. Differentiation into these specific neuronal subtypes is preceded by an upregulation of genes related to the midbrain–hindbrain organizer and a downregulation of genes related to mesodermal and endodermal development.
There are several possible mechanisms that could account for the selective role of Bcl-XL on neuronal fate specification. It was demonstrated that Bcl-XL can have an antiapoptotic effect on differentiating neuronal progenitors without affecting their differentiation potential (Okazawa et al., 1996; Esdar et al., 2001). In PC12 cells, neuronal differentiation occurs as a result of preventing cell death and Bcl-2 specifically increases their neuronal differentiation (Sato et al., 1994). Considering these previous findings, increased neuronal differentiation in Figure 3B might be attained by an antiapoptotic role of Bcl-XL during the differentiation of neuronal progenitors at stage 5. In addition to enhancing neuronal differentiation from their precursors, Bcl-ES cells also showed an increased yield of nestin+ precursors (Fig. 3A) with enhanced expression of midbrain–hindbrain-specific genes and concomitant downregulation of mesodermal and endodermal genes. These findings suggest that Bcl-XL may also play a role during the generation of neuroectodermal progeny (stage 3 of ES cell differentiation). Extensive apoptotic cell death was observed in the developing brain of Bcl-XL-deficient mice (Motoyama et al., 1995), in contrast to Bcl-2 ablated mice with apparently normal neural development (Nakayama et al., 1993). Interestingly the apoptotic effects observed in Bcl-XL null mutant mice were selective for neurons and hematopoietic cells. It has been postulated that these selective effects of Bcl-XL might be attributable to a lack of other redundant antiapototic mechanisms in these cells. Thus a selective survival for neuroectodermal progeny, rather than an instructive role of Bcl-XL, is likely to be an underlying mechanism of how enhanced yield of neural precursors was obtained by Bcl-XL overexpression. Future studies will have to address systematically which of the reported changes in the current study are attributable to increased survival, increased proliferation, decreased cell death, instructive effects on cell specifications, or combinations thereof. ES cells differentiated by the EB-based protocol spontaneously exhibit midbrain and hindbrain neuronal properties (Lee et al., 2000; Kim et al., 2002), and it has been suggested that midbrain–hindbrain could be a default fate during mouse ES cell differentiation (Bjorklund et al., 2002). Bcl-XL overexpression could enhance this process by increasing survival of the progenitor cells or their signals that direct midbrain–hindbrain-specific differentiation (Fig. 4).
A recent study found increased expression of Bcl-XL in nigral DA neurons of patients with Parkinson's disease (Hartmann et al., 2002). This study suggested that Bcl-XL upregulation might be a neuroprotective strategy used by the brain in response to the disease. Transgenic mice overexpressing Bcl-2 are resistant to MPP+ toxicity in vitro and in vivo (Offen et al., 1998; Yang et al., 1998). Consistent with these previous findings, Bcl-ES-derived DA cells were resistant to parkinsonian toxin MPP+ (Fig. 6A). In view of the ongoing disease in patients with Parkinson's disease, transplantation of toxin-resistant DA cells might improve the long-term function of grafted DA neurons in vivo.
Bcl-XL had a marked effect on neuronal maturation, particularly after transplantation and in vivo differentiation in parkinsonian rats. Similar to results with primary fetal DA neuron grafts (Holm et al., 2001), Bcl-ES grafts yielded highly mature DA cells with long and numerous processes and led to significant functional recovery.
Although additional studies are needed in rodent and primate models to address long-term functionality and safety of Bcl-ES cells, the results presented here demonstrate how genetic engineering in ES cells can be used to facilitate their differentiation into specific cell lineage, to induce resistance against neurotoxic stimuli, and to enhance overall functions of ES-derived progeny in models of neurodegenerative disease.
Footnotes
This work was supported by Grants M1-0318-00-0290 and SC-02-B1 from the Korea Institute of S&T Evaluation and Planning.
Correspondence should be addressed to Dr. Sang-Hun Lee, Department of Biochemistry, College of Medicine, Hanyang University, Seoul 133-791, Korea. E-mail: leesh{at}hanyang.ac.kr.
DOI: 10.1523/JNEUROSCI.3977-03.2004
Copyright © 2004 Society for Neuroscience 0270-6474/04/240843-10$15.00/0


