

Article Figures & Data
Figures
- Figure 1.
PF-induced translocation of GFP-PHD in Purkinje cells. A, Purkinje cells infected with SIN-IRES-GFP-PHD were imaged with TPLSM. GFP-PHD was excited at 900 nm. The right panel shows the high-magnification image of a part of the dendrite in the left panel (indicated by the white box). Twenty images acquired at 2 μm intervals were projected onto a plane for the left panel, and seven images were projected for the right panel. Fragments of adjacent cells made during the slicing procedure are seen as small dots near and over the Purkinje cells. B, Representative line scan image during PF stimulation. The left panel shows the fluorescence image of a Purkinje cell dendrite. The dashed line indicates the location of time-lapse line scanning. The right panel shows a line scan image on repetitive PF stimulations (10 stimuli at 50 Hz, indicated by the horizontal bar). C, Averaged time courses (14 runs from 14 cells) of fractional changes in the fluorescence intensity (ΔF/F0, normalized by the average of 10 line scans taken immediately before PF stimulation) in the cytoplasm and the plasma membrane. PF stimulation (10 stimuli at 50 Hz) is indicated by the gray bar. Averaged time courses of the reduction of fluorescence intensity attributable to photobleaching were subtracted from the traces.
- Figure 2.
Increase in IP3 concentration is necessary for PF-induced GFP-PHD translocation. A, PF-induced GFP-PHD translocation in the R343A mutant IP3 5-phosphatase-expressing cell (left trace) and the wild-type IP3 5-phosphatase-expressing cell (right trace). Averaged time courses of ΔF/F0 (8 runs from 8 cells in each experiment) within the cytoplasm during PF stimulation (10 stimuli at 50 Hz, indicated by the gray bar) are shown. B, Time integrals of ΔF/F0 (measured during 1.5 sec from the onset of PF stimulation) in the traces shown in A (mean ± SEM). PF-induced GFP-PHD translocation was blocked in the wild-type IP3 5-phosphatase-expressing cells compared with the R343A control cells. *p < 0.001 (Student's unpaired t test).
- Figure 3.
Simultaneous measurement of IP3 production, Ca2+ transients and EPSC. A, Representative traces of IP3 production (top traces), Ca2+ transient (middle traces), and EPSC (bottom traces) during PF stimulation (10 stimuli at 50 Hz, indicated by the gray bar). These three measurements were performed simultaneously. PF stimulation with a minimal intensity for inducing a substantial delayed Ca2+ transient (left traces) was followed by PF stimulation at a higher intensity for inducing a substantial initial component in the Ca2+ transient (right traces) in the same preparations. Stimulus artifacts in the EPSC traces were omitted for clarity in this and the following figures. B, Time integrals of IP3 production (during 1.5 sec from the onset of PF stimulation; right graph), time integrals of the initial component of Ca2+ transients (during 200 msec from the onset of PF stimulation; middle graph), and amplitudes of EPSC evoked by the first stimulus pulse of 10 stimuli at 50 Hz (left graph) are shown (mean ± SEM). Results from seven experiments are compiled.
- Figure 4.
Effect of glutamate receptor antagonists on PF-induced response. A, Effects of the group I mGluR antagonist 4-CPG (1 mm) and AMPAR antagonist NBQX (10 μm). Averaged traces (7 runs from 7 cells for the 4-CPG experiment, 6 runs from 6 cells for the NBQX experiment) of IP3 production (top traces), Ca2+ transient (middle traces), and EPSC (bottom traces) during PF stimulation (10 stimuli at 50 Hz, indicated by the gray bar). After the measurement under the control condition, 4-CPG or NBQX was perfused for 4-7 min, and then the measurement was performed at the same location. B, Cooperativity in IP3 production during PF stimulation. The linear sum of the averaged traces in the presence of 4-CPG or NBQX shown in A is compared with an averaged trace under the control condition (13 runs from 13 cells). C, Cooperativity in Ca2+ transient detected using Calcium Green-5N. Averaged time courses (9 runs from 9 cells for the 4-CPG experiment, 8 runs from 8 cells for the NBQX experiment) of the Ca2+ transient on PF stimulation are shown (top traces). The linear sum of averaged traces in the presence of 4-CPG or NBQX is significantly smaller than that of the averaged trace under the control condition (bottom trace).
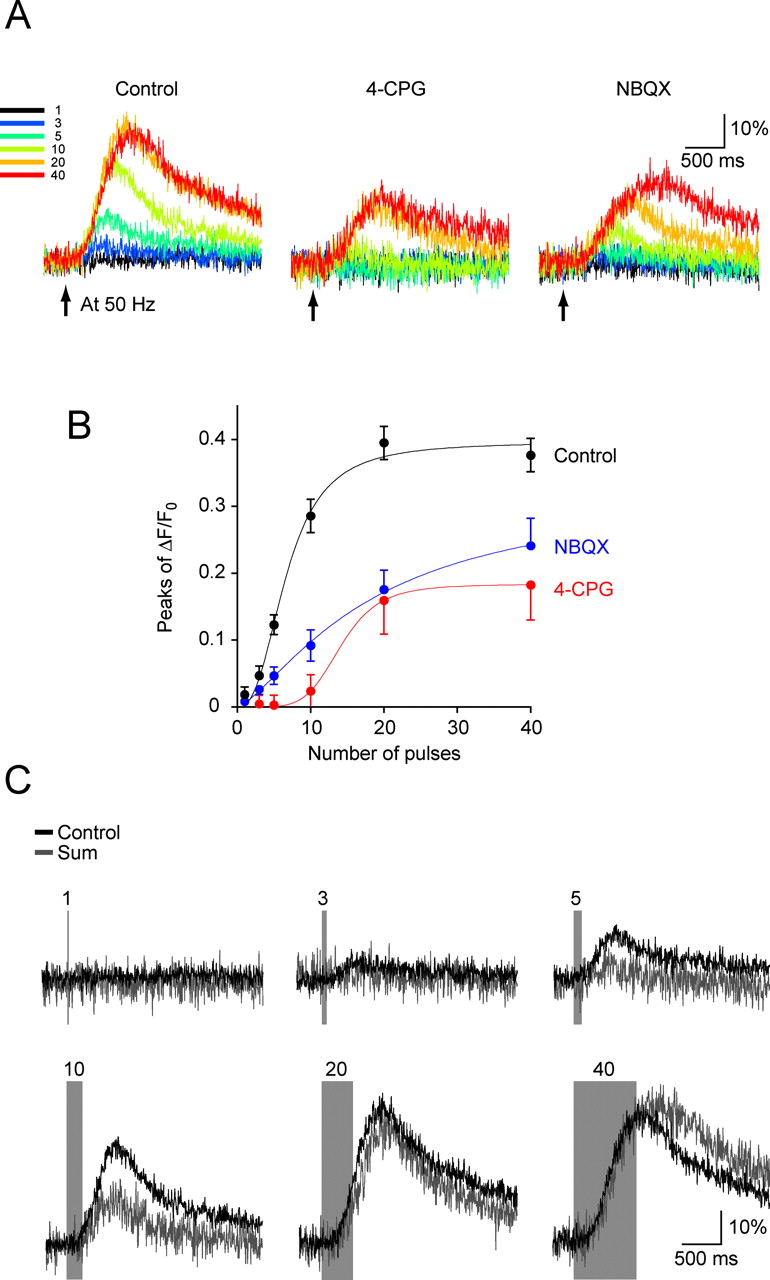
- Figure 5.
Dependence of cooperativity in IP3 production on the number of PF inputs. A, PF-induced IP3 production was measured by varying the number of stimuli (1, 3, 5, 10, 20, and 40 stimuli) at 50 Hz in the absence and the presence of either 4-CPG (1 mm) or NBQX (10 μm). Traces are the averaged time courses of ΔF/F0 within the cytoplasm on PF stimulation. The onset of PF stimulation is indicated by the arrow. B, Peak values of ΔF/F0 (measured during 2.5 sec from the onset of PF stimulation) are plotted against the number of stimuli (mean ± SEM; n = 9-11). Data points were fitted using Hill's equation. C, Cooperativity in IP3 production during varying numbers of PF stimulation. The linear sums of the averaged traces in the presence of 4-CPG or NBQX are compared with averaged traces under the control condition. PF stimulation (1, 3, 5, 10, 20, and 40 stimuli at 50 Hz, from top left to bottom right) is indicated by the gray bar. Results from 11 experiments (control), 9 experiments (4-CPG), and 9 experiments (NBQX) are summarized.
- Figure 6.
PF-induced IP3 production depends on G-protein and intracellular Ca2+. Averaged traces (6 runs from 5 cells for the GDP-βS experiment, 7 runs from 6 cells for the BAPTA experiment) of IP3 production, Ca2+ transient, and EPSC during PF stimulation (10 stimuli at 50 Hz, indicated by the gray bar) are shown. PF-induced IP3 production was completely blocked by the intracellular delivery of 2 mm GDP-βS (left traces) or 20 mm BAPTA (right traces).


