

Abstract
Insect metamorphosis is a compelling example for dendritic and synaptic remodeling as larval and adult behaviors place distinct demands on the CNS. During the metamorphosis of the moth, Manduca sexta, many larval motoneurons are remodeled to serve a new function in the adult. During late larval life, steroid hormones trigger axonal and dendritic regression as well as larval synapse elimination. These regressive events are accompanied by stereotypical changes in motor behavior during the so-called wandering stages. Both normally occurring changes in dendritic shape and in motor output have previously been analyzed quantitatively for the individually identified motoneuron MN5. This study tested whether activity affected steroid-induced dendritic regression and synapse disassembly in MN5 by means of chronically implanted extracellular electrodes. Stimulating MN5 in vivo in intact, normally developing animals during a developmental period when it usually shows no activity significantly slowed the regression of high-order dendrites. Both physiological and anatomical analysis demonstrated that reduced dendritic regression was accompanied by a significant reduction in larval synapse disassembly. Therefore, steroid-induced alterations of dendritic shape and synaptic connectivity are modified by activity-dependent mechanisms. This interaction might be a common mechanism for rapid adjustments of rigid, inflexible, hormonal programs.
Introduction
The postembryonic acquisition of behavior requires alterations in neuronal circuitry, which comprise specific changes in neuronal structure, membrane properties, and synaptic connectivity. Insect metamorphosis is a compelling example for dendritic and synaptic remodeling as larval and adult behaviors place distinct demands on the CNS (Consoulas et al., 2000; Tissot and Stocker, 2000). Because metamorphosis is controlled by ecdysteroids [including 20-hydroxyecdysone (20HE)], holometabolous insects have proven useful model systems to analyze steroid effects on dendritic shape (Weeks and Truman, 1986; Truman, 1990; Levine et al., 1995, 1996; Levine and Weeks, 1996). Steroids also affect dendritic outgrowth in hypothalamic slice cultures (Toran-Allerand et al., 1999), cyclical alterations in dendritic spine density on rat hippocampal pyramidal cells during the estrous cycle (Woolley, 1998), and the maturation of the song-control system in birds (Bottjer and Arnold, 1997). Because dendritic shape is affected by activity in many systems (McAllister, 2000; Cline, 2001; Wong and Gosh, 2002; Libersat and Duch, 2004), a possible functional interplay between hormonal cues and neural activity seems logical, but only few studies have addressed this interaction (Woolley and McEwen, 1994; Woolley et al., 1997). An attractive hypothesis is that activity might serve as a modulator of rigid, nonflexible hormone actions.
During the metamorphosis of the moth, Manduca sexta, many larval motoneurons are remodeled to serve a new function in the adult (Consoulas et al., 2000). A surge in the 20HE titer during the prepupal peak (see Fig. 1C) triggers dendritic (see Fig. 1A) and axonal regression as demonstrated by hormonal manipulation experiments (see Fig. 1B) (Weeks and Truman, 1985, 1986; Levine and Weeks, 1989; Fahrbach and Weeks, 2002; Knittel and Kent, 2002). During the loss of larval behaviors, dendritic regression is accompanied by larval synapse elimination (Streichert and Weeks, 1995; Gray and Weeks, 2003). During pupal life, the formation of adult dendrites serves the integration into newly formed networks (Duch and Levine, 2000). Such changes in dendritic shape have been analyzed quantitatively throughout metamorphosis in the individually identifiable flight motoneuron, MN5 (Libersat and Duch, 2002).

Regression of MN5 dendrites and axons, developmental changes in hormone titers, and stereotypical changes in MN5 spiking activity during the larval-pupal transformation of Manduca. A, Projection views from confocal image stacks of MN5 at larval day V3 (left), the third day of wandering (W3; middle), and the first day of pupal life (P0; right) showing MN5 dendritic retraction. B, Schematic summary of motoneuron-muscle remodeling during the developmental time relevant to this study. Larval (V) muscle fiber innervation retracts during wandering stages (W), degenerating muscles, myoblasts accumulate. At the first day of pupal life (P0), the adult muscle anlagen is formed by the fusion of myoblasts with the remnants of larval muscle fibers. During later pupal life, new motor terminals grow over the developing muscle (Duch et al., 2000). C, The timeline relevant to this study illustrates changes in relative hemolymph levels of ecdysteroids (solid line) and juvenile hormone (dashed line) from second day of the fifth larval instar (V2) to second day of pupal life [hormone titers redrawn from Bollenbacher et al. (1981) and Riddiford and Truman (1994)]. A small rise in ecdysteroids (20E) occurs on day V3, the commitment pulse, and a larger rise in 20E spans days W1 to P0, the prepupal peak. The rise of the prepupal peak of 20E triggers dendritic regression in motoneurons (Weeks and Truman, 1985, 1986; Weeks et al., 1992). V2, V3, Day 2, 3 of the fifth larval instar; W0 to W4, days of the wandering fifth instar; P0, day of ecdysis to the pupal stage; P1, next day of pupal life; bold black arrow signifies the time period of in vivo mesothoracic nerve 1 stimulation. D, Summary of the activity of motoneurons with their axon in the mesothoracic nerve 1, as recorded with chronically implanted electrodes in vivo in normally developing animals (Duch and Mentel, 2003). The graph relates to the same time scale as the hormone titers in C and shows activity of the MN1-5 as recorded in vivo. Representative bouts of activity as recorded from nerve 1 in vivo are shown for selected developmental stages. Motor spike amplitudes of MN1-5 are marked by arrows. Scale bars: A, 50 μm; D, 20 sec.
During late larval life, structural changes of MN5 are accompanied by a defined sequence of motor behaviors. Five days before pupal ecdysis, wandering starts with the cessation of feeding (day W0). This is followed by crawling and burrowing at W1 and W2 and a phase of reduced movement that leads into a quiescent period underground at W3 and W4 (Reinecke et al., 1980; Dominick and Truman, 1984a,b). Pupal ecdysis occurs at W4 (Reinecke et al., 1980; Truman et al., 1980; Miles and Weeks, 1991). By means of chronically implanted extracellular electrodes at selected nerves in intact, freely moving, and normally developing animals, we demonstrated recently that the activity of MN5 is regulated in a stereotypical manner during the wandering stages (see Fig. 1C,D), and that stage-specific activity patterns induce axonal outgrowth (Duch and Mentel, 2003).
This study tested whether dendritic shape was also affected by neural activity. The results showed that steroid-induced dendritic regression and larval synapse elimination were modulated by increased neuronal activity.
Materials and Methods
Animals. Manduca sexta (L) obtained from a laboratory culture were reared on artificial diet (Bell and Joachim, 1976) under a long-day photoperiod regime (17/7 hr light/dark cycle) at ∼26°C. Both chronological and morphological criteria were used for staging of animals (Nijhout and Williams, 1974; Bell and Joachim, 1976; Dominick and Truman, 1984a). For the prepupal stages, W0 signifies the first day of wandering, and W1-W4 the remaining larval days (see Fig. 1C). Pupal ecdysis occurs at day W4. Dendritic regression of MN5 starts at W2 and is continuous until the third day of pupal life, stage P2 (Duch and Levine, 2000; Libersat and Duch, 2002). Chronic extracellular recordings can be conducted throughout the life of the fifth larval instar (V) until the first day of pupal life (P0), because the wires are lost during the pupal molt (see below). Therefore, this study examined animals during the last 3 d of larval life, W2 to P0. Stage W3 was defined by the eversion of the head revealing a characteristic triangle on the posterior edge of the head. Stage W3 lasted ∼24 hr and was subdivided by chronological criteria into three substages [W3 early (W3e), W3 mid (W3), and W3 late (W3l)] of equal duration. Depending on how long the development from stage W3 to W4 lasted, these substages were adjusted into three subsequent periods, each of which lasted between 6 and 10 hr. W3 never lasted <18 hr, and animals that remained in stage W3 for longer than 30 hr were regarded to be developmentally delayed and discarded. Stage W4 was defined by the appearance of the brown bar on the dorsal metathoracic segment and lasted ∼24 hr (Truman et al., 1980). Stage W4 was subdivided into stage W4 early (W4e), W4 mid (W4), and W4 late (W4l). W4e and W4 were defined as subsequent substages of equal duration covering the period between the appearance of the brown bar and the first sign of cuticular shrinkage on the first abdominal segment [anterior shrinkage (Truman et al., 1980); corresponding to W4a (Consoulas et al., 1996)] and lasted ∼8 hr each. W4l was the remaining time until pupal ecdysis occurred, lasted 4-8 hr, and corresponded to stage W4b as published by Consoulas et al. (1996). Motor activity was recorded continuously from animals that developed from W2e to W3l or W4e. Then, chronic extracellular stimulations were conducted during stage W4 or W4l. Animals were put on ice for further dissection 5 hr after the onset pupal ecdysis.
Chronic extracellular recordings. Bipolar hook electrodes for chronic implantations were manufactured from steel wires of 25 μm diameter insulated to the tip. Two wires were aligned parallel to each other and fixed on a coverslip by complete coverage with Kwik-Cast/Kwik-Sil two component silicon glue (World Precision Instruments, Sarasota, FL). Subsequently, the silicon and the insulation at the very tips were removed only on the upper side of the wires, and the half-blank tips were bent to form fine hooks of ∼100 μm length, with the blank part on the inside. The silicon cover of the electrode wires was 3 cm long, and the wires were left an additional 30 cm long to connect them to an amplifier (model 1700; A-M Systems, Carlsborg, WA). Extracellular signals were differentially amplified 1000-fold, digitized with an analog-to-digital converter (Digidata 1320A; Axon Instruments, Foster City, CA) and recorded continuously for several days at a sampling frequency of 10 kHz with pClamp8 software (Axon Instruments) on a personal computer. The continuous data trace was broken into subsequent periods of 1 hr to minimize file size (137 MB/hr).
Electrode implantations. Animals were anesthetized by chilling on ice for 3 hr. The following electrode implantations were conducted in the cold room at 4°C to minimize bleeding and to prevent movement. Animals were placed ventral side up in a large sylgard dish. The four anterior-most legs were held with lassos made from stainless steel wire, and the animal was slightly stretched to visualize mesothoracic nerve 1 from the outside. A large trachea served as landmark to record the same site of nerve 1 in different animals (Duch and Mentel, 2003). A fine cut of ∼200-300 μm length was made just above the nerve into the larval cuticle. Then, the nerve was lifted with a glass hook, and the electrode was placed under the nerve with a micromanipulator. Subsequently, the electrode was slightly lifted to remove surrounding hemolymph. The nerve was fixed to the hooks with a 1:3 mixture of Kwik-Cast/Kwik-Sil that hardened within 20 sec to completely insulate the hooks and the nerve. Then, the electrode was pushed back through the incision into the thorax, the wound was closed with tissue glue, and the silicon part of the electrode was glued to the lateral side of the animal toward the abdomen. Implanted animals were placed into cylindrical wooden chambers of 10 cm length and 2 cm diameter as in normal laboratory culture conditions. These were placed into a faraday cage to decrease electrical noise. Recordings were stable throughout the 3 d between stage W2 and larval-to-pupal ecdysis. Animals attempted complete ecdysis but were unable to shed the larval cuticle at the insertion site of the silicon electrode. Therefore, recordings were terminated after 2 hr of ecdysis behavior. Staging of animals by external criteria was conducted every 8 hr.
At the recording site, nerve 1 contained the axons of the motoneurons MN1-MN5, the larger diameter axon of a motoneuron with its soma located in the midline of the prothoracic ganglion and the axons of six smaller motoneurons, two of which were located in the prothoracic ganglion and four of which were located in the mesothoracic ganglion, and the very thin axons of an octopaminergic ventral unpaired median neuron located in the mesothoracic ganglion (Duch and Mentel, 2003).
Chronic stimulation of motoneurons. To determine the effects of spiking activity, stimulation of nerve 1 was conducted with an A-M Systems stimulus generator (model 2100). Individual pulses were set to 0.1 msec duration and 8 V amplitude for antidromic in vivo stimulation of the motoneurons MN1-MN5 during normal development. These pulse parameters induced no current spread and were also used in previous studies for antidromic identification of the motoneurons MN1-MN5 in the isolated ganglion preparation. By simultaneous intracellular recording in animals with chronically implanted extracellular electrodes, we have shown previously (Duch and Mentel, 2003) that each extracellularly applied stimulus resulted in one spike in MN5. Therefore, the stimulation protocol resembled the induced spiking activity in MN5. Stimulation amplitude and duration were just above threshold for inducing spikes in the large-diameter motoneuron axons, which makes it unlikely that other axons were also stimulated (Duch and Levine, 2000, 2002). To test the role of motoneuron activity for their structural remodeling nerve 1 was stimulated for 12 hr with bursts of 1 sec duration, 10 Hz frequency, and an interburst period of 10 sec. Individual pulses within each burst were of 0.1 msec duration and 8 V amplitude.
Intracellular identification of MN5. In all preparations, chronic recordings and stimulations were followed by intracellular recordings and staining of MN5. Animals were dissected carefully, dorsal side up, to prevent destruction of the nerve with the electrode implant. The mesothoracic ganglion was placed on a wax-coated platform, a suction electrode was placed on nerve 1 far more proximal than the site of the chronic electrode, and MN5 was impaled as described previously (Duch and Levine, 2000).
Intracellular recording and staining and synaptotagmin immunocytochemistry. A glass microelectrode (20-25 MΩ with dye solution) was filled with 7% neurobiotin in 2 m potassium acetate to fill the MN5 intracellularly by injection of 3 nA depolarizing current for 30 min. Before dye fills impaled motoneurons, MN5s were recorded in situ in bridge mode (Axoclamp 2B) from their somata to measure resting membrane potential, input resistance, and spontaneously occurring postsynaptic potentials (PSPs) resulting from spontaneous spiking of unidentified neurons presynaptic to MN5. The ganglia were fixed with 7°C cold 4% paraformaldehyde for 2 hr and rinsed for 1 hr in PBS. Then, dehydration in an ascending ethanol series (50, 70, 90, 100%; 15 min each) was followed by lipid extraction in three steps. First, an ethanol/methylsalicylate mixture (1:1) was applied for 10 min. This was followed by 10 min methylsalicylate and 10 min methylsalicylate/xylene (1:1) to increase antibody permeability and reduce background staining. Subsequently, these steps were conducted in reverse order. After rehydration in a descending ethanol series, ganglia were bathed in 0.5% Triton X-100 PBS for 2 hr. If immunolabeling was performed, the ganglia were preincubated in 10% normal goat serum, 0.5% Triton X-100 PBS (0.1 m) for 1 hr, incubated in primary antibody (rabbit anti-synaptotagmin) for 2 d, and washed in PBS for 1 hr. The synaptotagmin antibody was a gift from Dr. L. P. Tolbert (ARL Division of Neurobiology, University of Arizona, Tucson, AZ). It had been raised against the unique N terminus of Manduca sexta synaptotagmin and has been shown to specifically detect Manduca synaptotagmin (Dubuque et al., 2001). The neurobiotin staining was visualized by coupling to cyanine 3 (Cy3)-streptavidin (1:750 streptavidin-Cy3 in 0.05% Triton X-100 PBS). In case of previous treatment with primary antibodies, Cy5-coupled mouse anti-rabbit (Jackson ImmunoResearch, West Grove, PA) secondary antibody was coapplied in 1:200 concentration. After washing in PBS for 1 hr, the preparation was dehydrated, thereafter cleared in a mixture of ethanol and methylsalicylate (1:1) for 10 min, and mounted in 100% methylsalicylate. Acquisition of confocal image stacks was done immediately.
Confocal microscopy. Digital images were captured on a Leica (Bensheim, Germany) TCS SP2 scanning confocal microscope. All scans were conducted with a Leica HCX PL APO CS 40× oil immersion objective (numerical aperture, 1.25). Optimal physical resolution with the 40× oil lens used is 0.1 × 0.1 × 0.28 μm. At 3.5× zoom and a z-step increment of 0.3 μm, the resulting voxel resolution was 0.1 × 0.1 × 0.3 μm, thus matching the optimal physical resolution. However, optical resolution is also limited to approximately half excitation wavelength but may further be degraded to some degree by inhomogeneous tissue properties. All images were obtained in simultaneous acquisition mode (i.e., the emitted fluorescence light of both synchronously excited dyes was divided by an acoustic-optical beam splitter to be detected by two separate photomultipliers). Thus, no image misalignment occurred as a result of an error in scan mirror positioning. Images were further processed using Amira (TGS, San Diego, CA) and Corel Draw 8 software (Corel, Ottawa, Ontario, Canada). All original images shown are the projections of all optical planes of a given stack into one focal plane to visualize all dendrites of MN5 in one two-dimensional image.
Correction for chromatic aberration. To correct for chromatic aberration, a neuron was filled with biotin and double labeled with Cy3- and Cy5-coupled streptavidin (Jackson ImmunoResearch). An image stack was obtained as described above. The misalignment between both structures was measured and applied onto later acquired image stacks of equally treated specimens (Wouterlood et al., 1998).
Three-dimensional reconstructions of dendritic structure and morphometric analysis. To obtain quantitative data on dendritic morphology, the arborizations of MN5 were reconstructed from confocal image stacks. Confocal image stacks were acquired as described above and analyzed with Amira software. A semiautomatic tool to create three-dimensional reconstructions in the Amira environment with higher accuracy compared with conventional automatic or manual method was recently developed and described in detail by Schmitt et al. (2004). Briefly, a semiautomatic reconstruction procedure is realized by adapting the snake algorithm (Kass et al., 1988) to trace approximately tubular neuronal structures in confocal image stacks. User interaction is needed to define branch point hierarchy, whereby the algorithm automatically determines the midlines and diameters of interconnecting link segments at a user-predefined step size. This step size was set to 0.5 μm in all reconstructions conducted. The resulting tubular reconstruction of the neuronal tree contains precise information on length, diameter, orientation, and branching pattern. To access exact surface and volumetric measures, an adapted geodesic active contour algorithm (Caselles et al., 1997) is used to fit the idealized tubular reconstruction to actual image data, resulting in precise boundary definition.
Analysis of labeled presynaptic protein distribution along motoneuronal dendritic surfaces. The exact surface definitions obtained by fitting the tubular reconstructions to the actual image data with an adapted geodesic contour algorithm allow analysis of labeled molecule distribution along neuronal surfaces in submicron resolution (Schmitt et al., 2004). Briefly, all anti-synaptotagmin label image intensities more distant than 0.3 μm from the dendritic surface were set to zero. The remaining synaptotagmin label was located within 0.3 μm from the dendritic surface of MN5 and was used to calculate the mean staining density around each patch of the triangulated surface reconstruction. The calculated synaptotagmin staining intensities can be visualized as a color code by projecting each patch of the surface reconstruction onto the individual cylindrical compartments. This enables analysis of geometrical relationship between staining distribution and the morphology of the neuron. Warmer colors represent highest synaptotagmin staining intensity localized in the terminals of unidentified presynaptic neurons, which are located 0.3 μm or closer to the dendritic surface of the motoneuron (see Fig. 5). Because synaptic protein markers like synapsin 1 and synaptotagmin can be used to mark the sites of synapses in the insect CNS, and electron micrographs have shown that presynaptic vesicles are found in distances up to 0.2-0.3 μm from the postsynaptic membrane (Peters et al., 1985; Watson and Schurmann, 2002), this offers a method to assess putative synapse distribution throughout entire dendritic trees on the light microscopy level (Schmitt et al., 2004) (J. F. Evers and C. Duch, unpublished data).

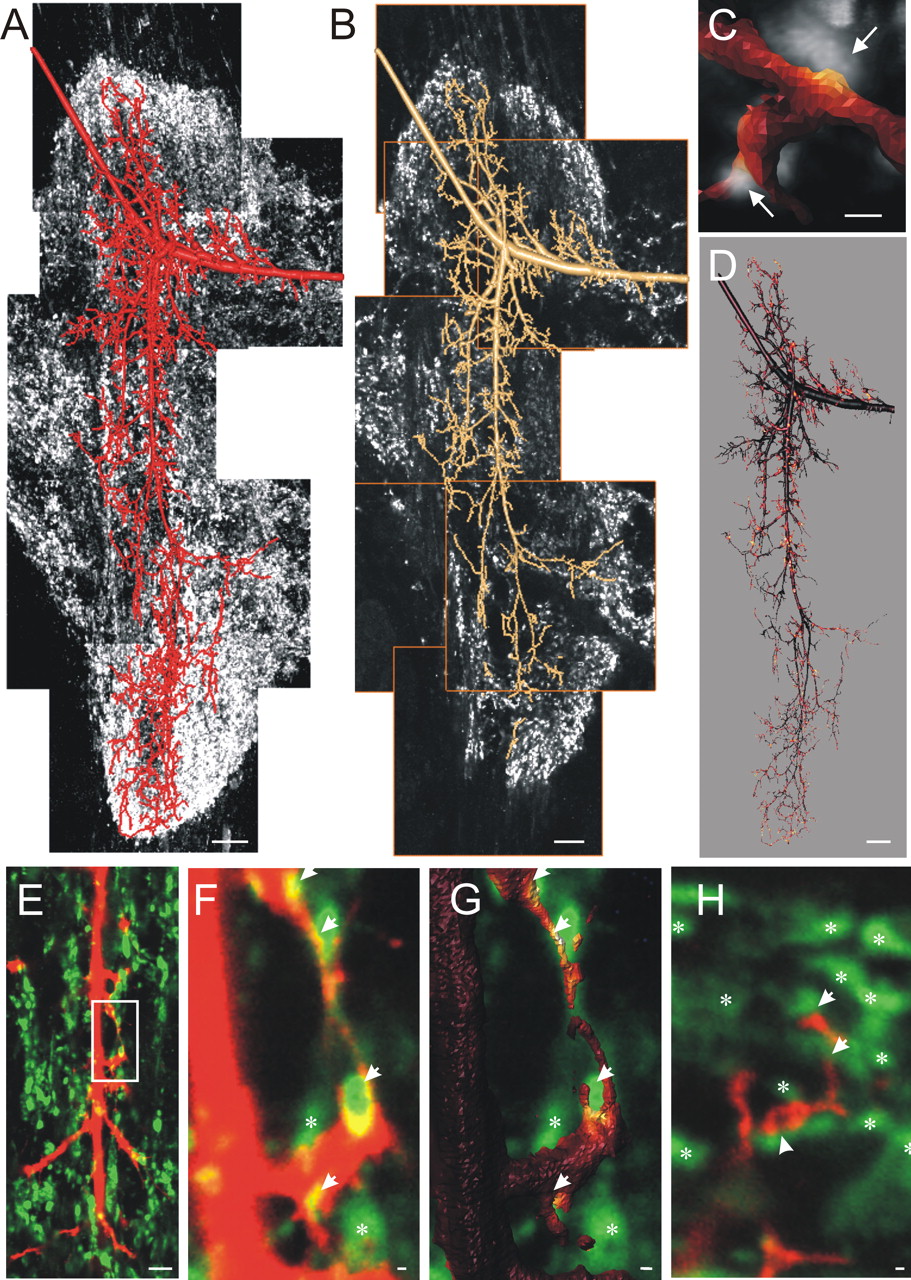
Localization of immunolabeled synaptotagmin profiles around the dendritic surface. A, Projection view of synaptotagmin immunocytochemistry around a geometric reconstruction of dendritic field of MN5 from a stimulated stage P0. Synaptotagmin label was found exclusively in neuropile regions. B, Single optical sections show that individual synaptotagmin-immunopositive dots could easily be distinguished from each other. The geometric reconstruction provides very precise surface definitions (Schmitt et al., 2004) and is used to estimate the distribution of synaptotagmin protein-containing putative input synapses throughout the entire dendritic tree of MN5 (see Materials and Methods). C, Selective enlargement of a single dendritic node in close association to two immunocytochemically stained synaptotagmin profiles. Synaptotagmin immunocytochemistry staining intensity within 0.3 μm from the dendritic surface was used to calculate the mean staining density around each patch of the triangulated surface reconstruction. The resulting intensities were visualized with warmer colors representing higher staining intensities of synaptotagmin-immunopositive label. D, Application of the method shown in C for the entire reconstruction shown in B. E, Unprocessed images of labeled dendrites (red) and nearby synaptotagmin-positive spots (green) in a single optical section. The white box indicates an area selectively enlarged in F. Arrowheads mark synaptotagmin spots (green), which are in contact with the labeled dendrite (red). The white asterisks mark synaptotagmin spots located further than 0.3 μm from the labeled dendrite. G, Surface reconstruction of the dendrite shown in F color coded for synaptotagmin-staining intensity. H, Additional high-resolution single optical section of labeled dendrites (red) and synaptotagmin (green). Arrows indicate synaptotagmin spots associated with labeled dendrites. Asterisks indicate synaptotagmin spots not in contact with the labeled dendrites. Scale bars: A, B, D, 10 μm; C, 1 μm; E, 5 μm; F-H, 0.3 μm.
Statistics. For paired statistical comparison of two independent groups, one-sided paired Student's t tests were conducted. All morphometric parameters obtained from pairs of stimulated and nonstimulated motoneurons, with each pair derived from the same animal were tested in this way. Physiological parameters like the amplitude and the frequency of postsynaptic potentials derived from two different experimental groups (stimulated and nonstimulated animals) were tested by one-sided unpaired Student's t tests. Differences were judged statistically significant at p ≤ 0.01. t tests were conducted with Microsoft (Seattle, WA) Excel. To test for statistically significant differences within more than two experimental groups, one-way ANOVA was conducted (significance level, p ≤ 0.01). If ANOVA revealed significant differences within the data, the individual experimental groups were compared by post hoc comparisons between means by the Newman-Keuls test (Zar, 1984) (significance level, p ≤ 0.05). ANOVA and post hoc Newman-Keuls tests were conducted with Statistica (StatSoft, Tusla, OK).
Solutions. Saline consisted of the following (in mm): 140 NaCl, 5 KCl, 4 CaCl2, 28 d-glucose, 5 HEPES, pH was adjusted to 7.4 using 1 m NaOH.
Results
Stimulation of MN5 during the normal decline of activity affects dendritic shape
During the wandering stages W3 and W4, a marked decline of motor activity in vivo coincides in time with a number of structural modifications that are important for the normal development of the adult neuromuscular system (Fig. 1C) (Duch and Mentel, 2003). During this time, the motoneuron MN5 undergoes drastic regression of its dendritic (Fig. 1A) (Duch and Levine, 2000; Libersat and Duch, 2002) and axonal arborizations (Fig. 1B) (Duch et al., 2000). Shortly after pupal ecdysis and, thus, after the motoneurons have participated in ecdysis behavior, motor terminals start to grow onto the developing adult muscle anlagen (Duch et al., 2000), and within the CNS, the formation of prominent dendritic growth cones precedes the sprouting and growth of new adult dendrites (Duch and Levine, 2000; Libersat and Duch, 2002). The normal decline in firing activity is important for the retraction of the axon terminals of MN5, and ecdysis-like activity patterns are sufficient to induce axonal outgrowth (Duch and Mentel, 2003). To test whether activity may also affect steroid-induced dendritic regression and larval central synapse elimination, MN5 was stimulated in intact normally developing animals between the stages W3 and W4. A total of 15 such stimulation experiments were conducted. In all animals, chronic recording electrodes were implanted at stage W2l or W3e. Recordings were maintained in unrestrained animals until the typical cessation of motor activity between stages W3l and W4 occurred (Fig. 1D) (Duch and Mentel, 2003). External staging criteria were used to confirm that the animals had developed to stage W3l or W4e. Then, nerve 1 was stimulated for 12 hr with bursts of 1 sec duration, 10 Hz frequency, and an interburst period of 10 sec. Stimulation was terminated at stage W4l (Fig. 1C). All animals attempted pupal ecdysis and were put on ice for intracellular staining of MN5 5 hr after the onset of ecdysis motor patterns (Fig. 1D). In 12 experiments, the stimulated MN5 was recorded and stained intracellularly at stage P0. In three experiments, MN5 was stained on both sides of the ganglion at stage P0. Because nerve 1 was stimulated on one side of the animal only, the contralateral side served as an internal control having the same hormonal state as the experimental side. In addition, the comparison of MN5 on the stimulated and the control side of the same animal ensured that putative structural differences were not attributable to developmental differences among animals.
Induced activity of MN5 at W3l/W4e, when no natural activity was observed in vivo, clearly affected dendritic structure (Fig. 2). Although overall dendritic shape appeared rather similar in stimulated dendritic trees compared with control dendritic trees, many more fine branches were present in the stimulated versus the control trees (Fig. 2A). However, all 12 stimulated motoneurons clearly showed dendritic regression despite the stimulation experiment, because their dendrites contained fewer branches and showed a smaller total length compared with stage W3l or stage W4e dendritic trees. This was not the case in electrode implanted but nonstimulated control animals (data not shown). To visualize the dendritic tree from different perspectives and to quantify the effects of activity on dendritic branching, geometric reconstructions were conducted. Representative examples for three-dimensional reconstructions of the dendritic trees of MN5 from two animals on the stimulated side and on the contralateral internal control side are depicted in Figure 2B (i, animal 1; ii, animal 2). For better visualization, each dendritic tree is shown as a xy-view and xz-view (Fig. 2B). The basic dendritic tree structure was similar on the control and stimulated side, but the stimulated trees contained more fine branches. This became particularly obvious in the xz-views. Geometric reconstructions of stimulated and control dendritic trees were used also for a quantitative analysis of the effects of activity on dendritic shape. In total, three control neurons at stage W4e (the stage when stimulation was started), three unstimulated control neurons from implanted animals at stage P0, and four stimulated neurons from stage P0 were reconstructed. In addition, the morphometric parameters from three stage P0 neurons from nonimplanted animals, which were reconstructed in a previous study (Libersat and Duch, 2002), were used for quantitative comparison among different groups. During normal development, the number of dendritic branches and the total dendritic length (TDL) decreased significantly between stages W4 and P0 (Fig. 3A,B) (one-way ANOVA; post hoc Newman-Keuls test; p < 0.01). This decrease in dendritic complexity was reduced but not stopped by the stimulation of MN5, because the number of branches and TDL were significantly smaller in stimulated P0 motoneurons than in stage W4 motoneurons (Fig. 3A,B) (one-way ANOVA; post hoc Newman-Keuls test; p < 0.01). In fact, in stimulated P0 motoneurons (TDL, 7189 ± 1276 μm), only 40% of the normal decrease in TDL between W4 (10,010 ± 1459 μm) and P0 (5474 ± 744 μm) occurred. The same was the case for the number of dendritic branches (Fig. 3A,B). The decrease in the amount of dendritic regression in stimulated motoneurons was statistically significant, because both the number of branches and TDL were significantly larger in stimulated compared with control stage P0 motoneurons (Fig. 3 A, B) (one-way ANOVA; post hoc Newman-Keuls test; p < 0.01). To exclude the possibility that the observed differences in morphometric parameters between the groups might be attributable to stage-specific differences in the histological procedures or to other artifacts, we also tested for differences in a parameter that usually stayed constant among the stages under investigation. One such parameter was the mean dendritic length (MDL; average length of all individual dendritic segments of a tree), which had been shown previously to remain constant between the onset of wandering and P0 (Libersat and Duch, 2002). MDL was similar in all three experimental groups: W4 (4.7 ± 0.1 μm), P0 control (4.6 ± 0.2 μm), and P0 stimulated (Fig. 3C) (4.6 ± 0.3 μm; one-way ANOVA, p = 0.94). Thus, the observed differences in TDL and in the number of branches (Fig. 3A,B) were not caused by artificial differences among the different groups.

Dendritic shape in stimulated versus control MN5. A, Projection views from confocal image stacks of MN5 fixed and stained 5 hr after the onset of pupal ecdysis. Shown are four representative dendritic trees from the stimulated MN5 (left) compared with four dendritic trees from control motoneurons (right). More fine high-order branches were presented in the stimulated (left) versus the control trees (right). B, Three-dimensional reconstructions of the dendritic trees of MN5 from two animals each on the stimulated side (left) and the contralateral internal control side (right) allow visualization of the dendritic tree from different perspectives. The basic dendritic tree structure was similar on the control and the stimulated side, but the stimulated trees contained more fine branches, as particularly obvious in the xz-views. For a comparison of the effects of stimulation on dendritic and axonal shape, the axonal projection patterns of the motoneurons MN1-MN5 are depicted from the stimulated (C) and the control side (Ci) of one animal (modified from Duch and Mentel, 2003). Scale bar, 50 μm.

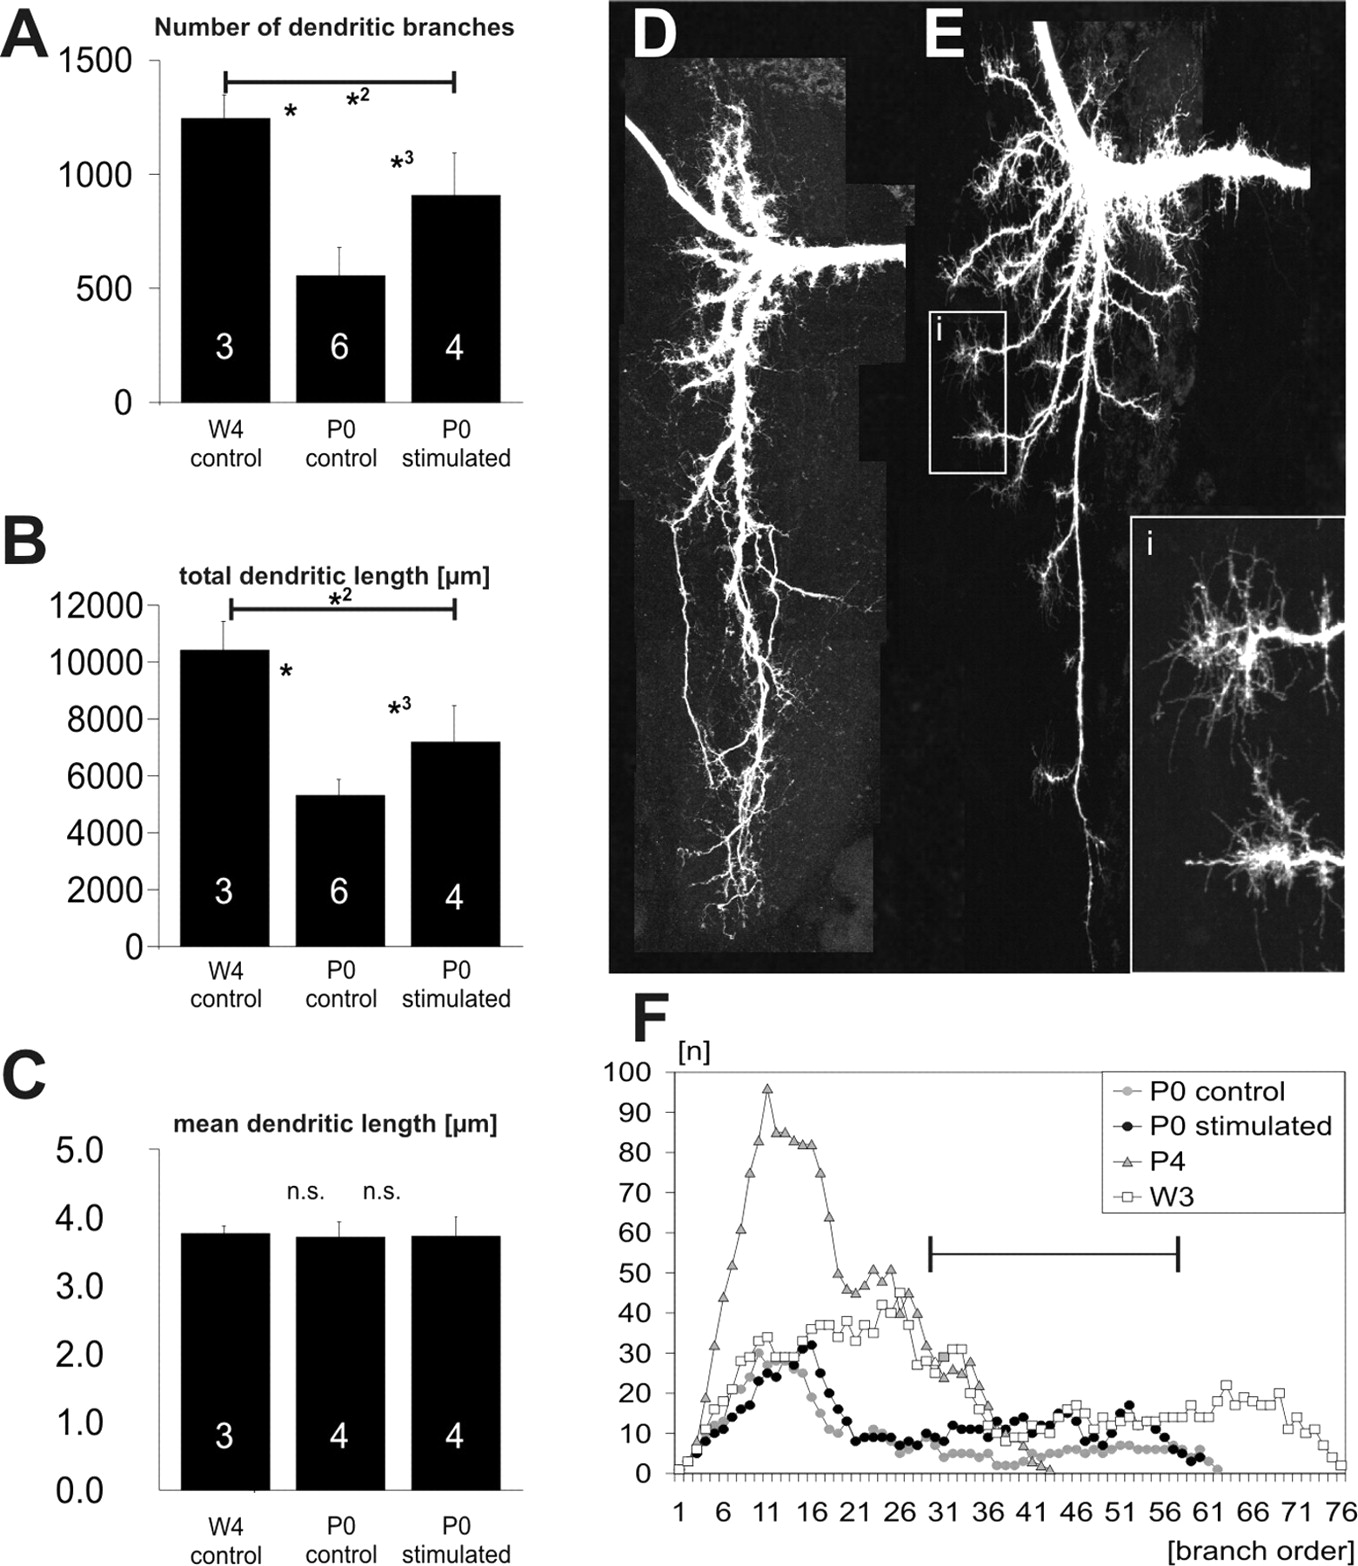
Quantification of dendritic shape in stimulated versus control MN5. A-C, The number of dendritic branches (A), the total dendritic length (TDL; B), and the mean length of all dendritic segments (MDL; C) of MN5 were compared between control neurons at stage W4, control neurons at stage P0, and stimulated neurons at stage P0. The number of branches decreased significantly between stages W4 and P0 (A, asterisk). This decrease was not stopped by the stimulation, because the number of branches was significantly smaller in stimulated P0 motoneurons than in stage W4 motoneurons (A, asterisk 2). Dendritic regression was decreased by stimulation, because stimulated P0 motoneurons had significantly more branches than control P0 motoneurons (A, asterisk 3). The significant decrease in TDL between stages W4 and P0 (B, asterisk) was also not stopped but decreased by stimulation, because TDL was significantly smaller in stimulated P0 motoneurons than in stage W4 motoneurons (B, asterisk 2) and significantly larger in stimulated P0 motoneurons than control P0 motoneurons (B, asterisk 3). C, MDL served as a control to account for putative differences in the histological procedure among the different groups, because it was previously shown to remain constant between W4 and P0 (Libersat and Duch, 2002). n is indicated by the numbers in the bars. Asterisks indicate statistical significance (1-way ANOVA; post hoc Newman-Keuls test; p < 0.01). D, Projection view of the dendritic tree of MN5 at an early stage W4. E, Projection view of the dendrites of MN5 at pupal stage P4 when dendritic growth started during normal development. Prominent growth cones were located at the tips of all dendrites (see inset i). F, Branch-order analysis for stages control W3 (open squares), control P0 (gray circles), stimulated P0 (black circles), and control P4 (gray triangles). The black bar signifies the branch orders for which stimulation increased the number of dendrites at stage P0. These branch orders were present at the earlier stage W3 but not during the first days of dendritic growth during normal development (stage P4).
An increased number of high-order branches and a larger TDL in stimulated dendritic trees compared with internal and stage-matched controls could in principle have two causes, either reduced dendritic regression or premature outgrowth. Several lines of evidence indicated that imposed activity slowed dendritic regression but most likely did not cause premature outgrowth. First, in stimulated animals, no obvious dendritic branches or subtrees were found, which were not present at earlier stages before stimulation. Dendritic tree shape in control stage W4 early animals (Fig. 3D) was very similar compared with stimulated stage P0 dendritic trees (Fig. 2A). In contrast, dendritic trees from later control stages, when normal dendritic growth had occurred (Fig. 3E), showed many new dendritic branches that could easily be distinguished from those present at stage W4. The high constancy of dendritic shape in individually identified insect neurons like MN5 among animals (Libersat and Duch, 2002) allowed a good judgment on whether new branches were formed in the dendritic field. On this basis, we claim that stimulation induced reduced dendritic regression but no obvious new branch formation. Second, during normal development, dendritic outgrowth is preceded by the formation of prominent growth cones at the tips of all dendrites (Fig. 3E) (Duch and Levine, 2000; Libersat and Duch, 2002). These growth cones were not found after stimulating MN5 during late larval life. Therefore, imposed activity did not lead to the formation of dendritic growth cones, which were a prerequisite for outgrowth during normal development. Third, metric measures like TDL and the number of branches of stimulated MN5 at stage P0 laid between those of control developed stage W4 and stage P0 dendritic trees. This showed that regression had not stopped but strongly indicated that regression was slowed down. To further support this finding, branch-order analysis was conducted. This demonstrated that control trees at W3 late contained many more high-order branches compared with P0 trees (orders 20-70) (Fig. 3F). Stimulated P0 trees also contained more high-order branches compared with control P0 trees (orders 30-60) (Fig. 3F), but in no order more branches than W3 late trees (Fig. 3F), indicating that no new branches were formed in any specific branch order. However, control stage P4 trees showed strongly increased branching in the lower orders up to 40 (Libersat and Duch, 2002). Therefore, during normal development, new branching occurred at lower orders, but stimulation led to the maintenance of the number of high-order branches as occurring during earlier stages. Therefore, we concluded that stimulation induced reduced dendritic regression but not premature outgrowth. This also agreed with the finding that stimulation did not induce additional dendritic branches at earlier larval stages before dendritic regression started (data not shown). This was in contrast to previous findings on the effects of imposed activity on axonal structure, where stimulation induced significant new outgrowth (Duch and Mentel, 2003) (Fig. 2C). Therefore, dendrites and axons of the same motoneurons were affected differently by increasing activity in stimulation experiments with chronically implanted electrodes.
Stimulation of MN5 during the normal decline of activity affects larval synapse elimination
It is plausible to assume that dendritic regression might be accompanied by synapse elimination. For Manduca accessory planta retractor motoneurons, it has been demonstrated recently that steroid-induced dendritic regression physically disconnects the motoneurons from the synaptic terminals of sensory neurons, producing synaptic weakening (Streichert and Weeks, 1995; Gray and Weeks, 2003). This agrees with our findings on dendritic regression and synapse elimination in motoneuron MN5 (Evers and C.D., unpublished data). However, if dendritic regression was functionally linked to synaptic weakening, stimulation might have caused not only decreased dendritic regression but also decreased synapse elimination. We tested this hypothesis physiologically and anatomically.
At stage P0, spontaneous PSPs resulting from the activity of unidentified neurons presynaptic to MN5 in the in situ preparation occurred at a higher frequency and showed a larger amplitude in stimulated compared with control motoneurons (Fig. 4). As an example, Figure 4A shows traces of spontaneous activity recorded from a control and stimulated MN5 from the same ganglion. Although IPSPs occurred much more frequently than EPSPs (Fig. 4A) at all larval and early pupal stages, which were subjected to this study, both were included in the analysis. Stimulation did not change the ratio between spontaneously occurring IPSPs and EPSPs. Pooling the data from five stimulated and five control motoneurons clearly demonstrated that the frequency (control, 7.1 ± 4.2 Hz; stimulated 14.0 ± 6.9 Hz) and the amplitude (control, 1.43 ± 0.40 mV; stimulated, 1.92 ± 0.39 mV) were significantly increased after in vivo stimulation (Fig. 4B) (Student's t test; p < 0.01). A quantitative comparison of PSP amplitude from a stimulated and contralateral control MN5 from the same animal further confirmed this result. Cumulative probability plots of individual postsynaptic potentials showed that there was an increase in larger amplitude potentials in the stimulated compared with the control MN5 from the same animal (Fig. 4C). Differences in PSP amplitude were not attributable to differences in input resistance (58 ± 2 MΩ), membrane potential (-48 ± 3 mV), or time constant, because these parameters were similar in the stimulated and control MN5 (Student's t test; p > 0.2). The same was the case for shape and amplitude of both the orthodromically and antidromically evoked action potential (data not shown). The larger PSP amplitude in MN5 on the stimulated side was also not caused by differences in passive conduction resulting from changes in dendritic architecture. Dendritic diameter is a crucial parameter for passive conduction of voltage signals. Plotting the diameters of all dendritic branches as a function of branch order for the stimulated and unstimulated control MN5 from the same animal showed that stimulation induced no changes in the diameters (Fig. 4C). Because the dendritic tree of the stimulated MN5 contained significantly more dendrites, shunting of PSP amplitude at branch points should have been stronger but not smaller compared with the control MN5. Therefore, the larger PSP amplitude in the stimulated motoneuron was most likely caused by more synaptic input compared with the control MN5. Both PSP amplitude and frequency of stimulated stage P0 motoneurons lay between those of control W4 (stage before stimulation) and control P0 animals. In contrast, in later stages when dendritic growth occurred during normal development, fewer and lower amplitude PSPs occurred compared with control P0 animals. This indicated that stimulation-induced decreases in dendritic regression were accompanied by a decrease in larval synapse disassembly.

Quantification of PSP amplitude and frequency in stimulated versus control MN5. A, Recordings of spontaneously occurring PSPs in a control (left) and a stimulated (right) MN5 from the same animal. Both PSP amplitude and frequency were greater on the stimulated side. B, Quantitative comparison of PSP frequency (left) and PSP amplitude (right) averaged for five control and five stimulated MN5 seconds. Error bars represent SDs. Both parameters were significantly larger in the stimulated MN5 (Student's t test; p < 0.01). C, Cumulative probability plots of individual postsynaptic potentials (left) and dendritic diameters as a function of their branching order (right) for a control versus a stimulated MN5 from the same animal. Dendritic diameters were similar, but there was an increase in larger amplitude potentials in the stimulated MN5.
We further tested whether there was an anatomical correlate to the physiological finding of reduced larval synapse elimination after in vivo stimulation. All spontaneously occurring PSPs were counted to compare synaptic input between stimulated and unstimulated neurons. The anatomical correlate would be the input synapse distribution throughout the entire dendritic tree. An exact analysis of the distribution of all input synapses throughout the dendritic tree could only be achieved by serial section Immunocytochemistry-electron microscopy studies, but this was not feasible for the dendritic trees of MN5 on both sides of the ganglia in unilaterally stimulated animals. However, in insects, the distribution of synapsin I-protein or synaptotagmin-protein is correlated with clustered synaptic vesicles at synaptic sites and is, therefore, useful in pinpointing synaptic loci in some neuropiles at the light microscopic level (Watson and Schurmann, 2003). We paired all intracellular stainings of MN5 with synaptotagmin immunocytochemistry in the same preparations. Synaptotagmin immunocytochemistry labeled the neuropile region around the dendritic field of MN5 (Fig. 5A). Moreover, single optical sections showed that individual synaptotagmin-immunopositive dots could easily be distinguished from each other (Fig. 5B). It has been shown previously that at the Manduca neuromuscular junction, the distribution of distinct synaptotagmin-immunopositive dots was almost identical to the distribution of activity-dependent synaptic vesicle recycling sites in motor terminals (Consoulas and Levine, 1998). Therefore, it was likely that most synaptotagmin-positive dots (Fig. 5A,B) indicated putative presynaptic sites in the CNS. This is further supported by the finding that synaptotagmin spots in the neuropile show on average the same size that was reported for putative sensorimotor synapses described in Manduca abdominal ganglia at the same stages, based on contacts identified in confocal images (Gray and Weeks, 2003). Because the three-dimensional reconstructions used to analyze the structure of MN5 were conducted with a new method that provided very precise surface definitions (Schmitt et al., 2004), we could use the double stainings of MN5 and synaptotagmin profiles to estimate the distribution of putative input synapses throughout the entire dendritic tree of MN5 (see Materials and Methods) (Evers, S. Schmitt, M. Sibila, and Duch, unpublished data). The staining intensity of all synaptotagmin-positive dots within 0.3 μm from the surface of the dendrites was used to calculate the mean staining density around each patch of the triangulated surface reconstruction. The resulting intensities were visualized as a color on the surface reconstruction. Warmer colors represented higher staining intensities of synaptotagmin-immunopositive label located 0.3 μm or closer to the dendritic surface (Fig. 5C). Visual inspection of the surface reconstruction within the stack of images for synaptotagmin label confirmed that sites of the dendritic surface signified by warm colors were, in fact, in close proximity to synaptotagmin-immunopositive profiles (Fig. 5C). This was further confirmed by visual inspection of single, unprocessed optical sections of double stainings of MN5 dendrites and synaptotagmin (Fig. 5E-H). At high scanning resolution, synaptotagmin spots could clearly be distinguished from each other, but only some were in close contact with the labeled dendrites (Fig. 5F,H). We found only very few synaptotagmin-immunopositive dots inside the dendritic surface reconstruction, which is typical for efferent insect neurons (Watson and Schurmann, 2003). These were neglected in this type of analysis. Therefore, dendritic surface sites marked by warm colors were interpreted as sites of putative synaptic input. We do not claim that each of these sites represented an input synapse, but rather that a close spatial association between the dendritic surface and synaptic proteins indicated a high likelihood for a synaptic connection, which we visualized as a color code on the surface reconstruction. This procedure was then applied for entire dendritic trees (Fig. 5D).
When applying this analysis to the dendritic trees from the stimulated and contralateral unstimulated MN5 from the same ganglion, many more putative synaptic input sites were marked on the surface reconstruction of the stimulated motoneuron (Fig. 6 A). For better visualization of the color code, selective enlargements of comparable dendritic areas from the stimulated and the control dendritic tree are depicted in Figures 6 D-G. White arrowheads point at sites with high synaptotagmin staining intensities within a 0.3 μm vicinity of the dendritic surface (Fig. 6 D, F). Throughout all parts of the dendritic field and dendrites of almost all orders, many more putative sites of input synapses were detected at the dendritic tree of the stimulated compared with the control motoneuron (Fig. 6 A, D-G). Each three-dimensional reconstruction of the dendritic field consisted of reconstructed compartments with 0.5 μm length (see Materials and Methods). To address the distribution of putative synaptic input sites throughout the dendritic tree, all reconstructed compartments with high synaptotagmin staining intensities within a 0.3 μm vicinity of their surface were counted in stimulated and in contralateral, nonstimulated motoneurons from the same preparations. Plotting the number of compartments with high synaptotagmin staining intensities in their close vicinity as a function of branch order for a representative animal showed that in the stimulated dendritic tree in all branch orders above 10 more putative sites of input synapses occurred compared with the control dendritic tree (Fig. 6 B). In contrast, stimulation led to an increased number of dendritic branches only in the higher branch orders (between branch order 30 and 60) (Fig. 6C). Therefore, dendritic regression was decreased mostly in fine high-order branches (Figs. 2, 6 F), whereas elimination of putative input synapses was decreased throughout almost the entire dendritic field. Comparing the number of reconstructed compartments with high synaptotagmin staining intensity within a 0.3 μm vicinity of their surface in three pairs of control and stimulated dendritic trees, each pair derived from a single preparation (stimulated MN5 and nonstimulated internal contralateral control MN5) revealed that stimulated motoneurons received significantly more putative input synapses compared with nonstimulated internal controls (Fig. 6 I) (paired Student's t test; p < 0.01). During normal development, the number of putative input synapses decreased significantly between the stages W2 and P0 (data not shown), corresponding to the physiological findings in this study and earlier findings on synapse elimination in Manduca during late larval life (Streichert and Weeks, 1995; Gray and Weeks, 2003). The anatomical observation of more putative input synapses on the surface of the dendrites of the stimulated MN5 compared with the internal control corresponded to physiological measurements from the same neurons. Cumulative probability plots of individual postsynaptic potentials showed that there was an increase in larger amplitude potentials in the stimulated compared with the control MN5 (Fig. 6 H).
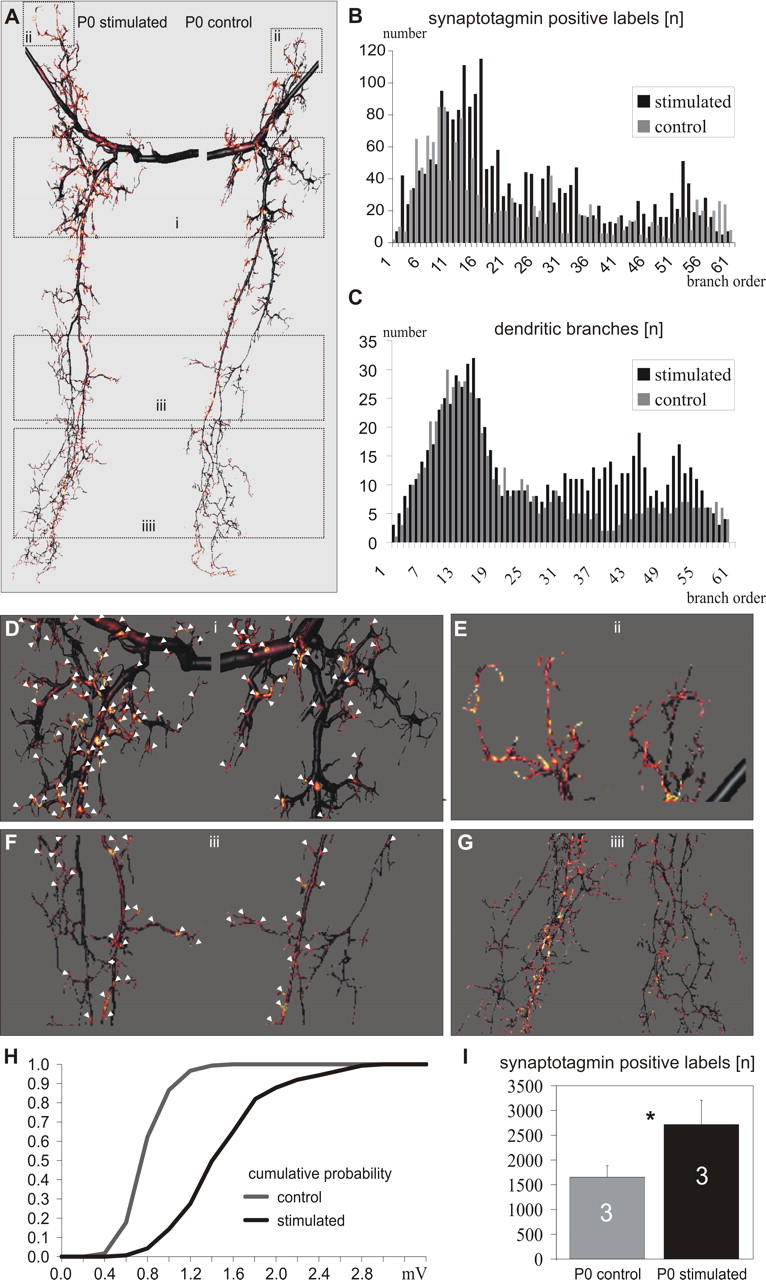
Effects of stimulation on distribution of putative input synapses. A, The intensity of synaptotagmin immunostaining within 0.3 μm distance from the dendritic surface is shown as a color code throughout the entire dendritic tree of the stimulated (left) and the control (right) MN5 from the same ganglion. Warmer colors represent a higher probability for putative input synapses. The stimulated dendritic tree (left) shows more spots with warmer colors compared with the control tree (right). Selective enlargements of the parts of the dendritic trees surrounded by the boxes i-iiii are shown in D-G. In D and F, spots with a high probability for putative input synapses are marked by arrowheads. The stimulated dendritic tree showed more sites of high-input synapse probability than the control tree on both high-order dendrites, which are not present only in the stimulated tree, and low-order dendrites, which are present in both trees. B, All three-dimensional reconstructions were composed of multiple compartments of 0.5 μm length each. The number of compartments with a high probability for putative input synapses plotted as a function of branch order for the stimulated versus the control MN5. The stimulated dendritic tree received more putative input synapses in all branch orders larger than 10. C, The number of dendritic branches as a function of branch order for the stimulated versus the control MN5. The stimulated MN5 contains more branches in the orders 30-60. H, Cumulative probability plots of individual postsynaptic potentials for the control versus the stimulated MN5. The increase in larger amplitude potentials in the stimulated compared with the control MN5 corresponded to the higher number of putative input synapses detected anatomically (B, D-G). I, The average number of reconstructed compartments with a high probability for putative input synapses counted in three pairs of control and stimulated dendritic trees, each pair derived from a single preparation. Error bars represent SDs. Asterisk indicates significance (paired Student's t test; p < 0.01).
Discussion
During the metamorphosis of amphibians (Alley and Omerza, 1998) and holometabolous insects (Consoulas et al., 2000; Tissot and Stocker, 2000), reutilization of motoneurons for new adult behaviors is characterized by the retraction of axonal processes from degenerating larval muscles followed by outgrowth on the newly formed adult muscles and by retraction of larval dendrites followed by the maturation of the adult dendritic architecture. In holometabolous insects, dendritic regression is dependent on hormonal cues (Weeks et al., 1992; Weeks, 1999; Williams and Truman, 2004). Manduca proleg motoneurons are one of the rare systems in which it has been shown that dendritic retraction is accompanied by synapse elimination and, thus, the dismantling of larval motor circuits (Streichert and Weeks, 1995; Gray and Weeks, 2003). The present study supports this view by showing that regression of MN5 dendrites went along with a marked reduction in the number of putative input synapses, most likely resembling the dismantling of the larval crawling circuits.
During normal development, larval circuit dismantling is accompanied by a phase of reduced movement after the animals burrowed underground awaiting pupation (Reinecke et al., 1980; Dominick and Truman, 1994a). During this phase, the spiking activity of MN5 ceases significantly (Duch and Mentel, 2003). We used chronically implanted extracellular electrodes to test whether changes in the normal decrease in spiking activity in MN5 would interfere with dendritic regression and larval circuit dismantling. This approach had two important advantages. First, we were able to manipulate the activity of a subset of identified motoneurons during selected periods of development only, whereas all other neurons were unaffected and the animals developed normally. In genetic model systems, this is only possible by the expression of mutant alleles that cause hyperexcitability or hypoexcitability in subsets of neurons and can be controlled in a temporal manner (Rubin, 1988). Second, we could manipulate spiking activity on the basis of our knowledge of the alterations in activity during normal development (Duch and Mentel, 2003). The results clearly showed that stimulating MN5 during a developmental time when it usually showed only few spikes did not stop but significantly decreased dendritic regression and synapse elimination. This agreed with steroid control of dendritic regression (Weeks et al., 1992; Knittel and Kent, 2002), but it also clearly showed that activity significantly decreased both dendritic regression and synapse elimination. The possibility that motoneuron activity might, in turn, be controlled by steroid hormones or downstream peptide cascades is discussed previously (Duch and Mentel, 2003). However, it appeared unlikely that steroid control of dendritic regression might entirely be mediated via changes in activity, because stimulation experiments did not stop but reduced dendritic regression, even at higher stimulation frequencies (data not shown).
Dendritic regression and the effects of induced spiking activity were quantified by geometric reconstructions of the dendritic field of MN5. The effects of activity on synapse elimination were analyzed physiologically and anatomically. The results demonstrated that amplitude and frequency of spontaneously occurring PSPs, as recorded from the soma of MN5, were significantly increased in stimulated neurons. Because neither physiological parameters like spike shape and input resistance nor geometric parameters like dendritic diameters were affected by the stimulation, increased PSP amplitude most likely resembled increased synaptic input. This was further supported by anatomical results showing more immunocytochemically labeled synaptotagmin profiles in close proximity to the dendritic surface of the stimulated compared with the control MN5. Electron microscopy in other insects demonstrated that the distribution of synapsin I-protein and synaptotagmin-protein is useful in detecting synaptic loci at the light microscopic level (Watson and Schurmann, 2003). Paired with the precise surface definitions of our geometric neuron reconstructions, synaptotagmin profiles can be used to estimate the distribution of putative input synapses throughout the entire dendritic tree of MN5 on the light microscopy level (Schmitt et al., 2004). We do not claim that every synaptotagmin label within 0.3 μm of the dendritic surface resembles an input synapse, but rather that a close spatial association between the dendritic surface and synaptic proteins indicates a high likelihood for a synaptic connection. Corresponding to the physiological results, this “synaptic contact probability” was strongly increased in stimulated versus control motoneurons. This suggested that activity decreased steroid-induced synapse elimination in the CNS.
In vivo stimulation of nerve 1 led to antidromic action potentials in MN5 and few other efferent neurons (see Materials and Methods) (Duch and Mentel, 2003). Because most efferent insect neurons contain no, or only very few, central output synapses (Burrows et al., 1989; Watson and Schurmann, 2003) decreased dendritic regression in MN5 was most likely caused by intrinsic activity and not by synaptic activity, although we cannot fully exclude the possibility of increased synaptic activity in the motor networks resulting from the stimulation experiments. The mechanism by which increased activity mediated decreased dendritic regression remains to be investigated. Although at current speculative, it seems logical that common cell biological mechanisms might be co-opted by hormonal signals and activity-dependent programs (Eaton and Davis, 2003). Antidromically induced spiking activity in the developing MN5 induced calcium elevations in the soma and possibly also in large parts of the dendrites, depending on developmental changes in the ion channel distribution (Duch and Levine, 2002). Alterations in somatic calcium concentration can affect gene transcription (Hardingham et al., 1997; West et al., 2002), which in turn can affect dendritic shape. In cortical slice culture, dendritic shape is dependent on CaM kinase IV activity and the cAMP-responsive element-binding protein (Redmond et al., 2002). Therefore, activity and steroid hormone action might converge on the level of gene transcription.
The observation that dendritic regression was reduced, but no dendritic growth was induced, by activity contrasted with earlier results on stimulation-induced axonal outgrowth of MN5 (Duch and Mentel, 2003). This is not surprising because axons and dendrites clearly differ in their patterns of growth and in their molecular composition (Ramakers et al., 2001; Nikonenko et al., 2003; Tashiro et al., 2003). Similarly, hormonal manipulation studies have shown that axonal and dendritic regression occurred independently from each other in heterochronic mosaic animals (Knittel and Kent, 2002), suggesting a different set of signals for regressive events in the periphery nervous system and the CNS. These findings also concur with the events occurring during Wallerian degeneration in the mouse, where synaptic degeneration may be mediated by different mechanisms than axon and soma degeneration (Gillingwater and Ribchester, 2001).
The elimination of previously functional synaptic connections has been demonstrated in the vertebrate (Purves and Lichtman, 1980; Nguyen and Lichtman, 1996; Colman et al., 1997; Sanes and Lichtman, 1999; Chen and Regehr, 2000) and in the invertebrate CNS and peripheral nervous system (Sonea and Rheuben, 1992; Streichert and Weeks, 1995; Truman and Reiss, 1995; Consoulas and Levine, 1998; Duch et al., 2000; Eaton et al., 2002; Gray and Weeks, 2003). However, the mechanisms that regulate circuit dismantling are not well understood (Goda and Davis, 2003). Many studies in the CNS and the periphery nervous system support the conclusion that synapse elimination is mediated by activity-dependent competition mediated through the postsynaptic cell (Katz and Shatz, 1996; Sanes and Lichtman, 1999). The postsynaptic cell as intermediary is further supported by differential synapse elimination of a single motor neuron at the vertebrate neuromuscular junction, arguing for local control at each muscle fiber (Keller-Peck et al., 2001). For Manduca proleg motoneurons, it has been suggested recently that steroid-induced dendritic regression physically disconnected dendrites from the synaptic terminals of sensory neurons, producing synaptic weakening (Gray and Weeks, 2003). In contrast, this study suggests at least in part a differential effect of induced activity on dendrites versus synapses, because synapse elimination was decreased in all branch orders above 10, whereas dendritic regression was decreased only in high branch orders above 30. Although the mechanisms for either process remain speculative at present, the results strengthen the role of the postsynaptic cell for synapse elimination because alterations were induced by stimulating the postsynaptic neuron.
In wandering Manduca larvae, activity-dependent modulation of dendritic regression and synaptic weakening is most likely of behavioral importance. Despite the ongoing degeneration of the larval target muscle of MN5, neuromuscular transmission and muscle contraction remain functional until pupal life (Duch et al., 2000), and MN5 participates in crawling, burrowing, and ecdysis behavior (Duch and Mentel, 2003). In case of delayed wandering, motoneuron activity will remain higher compared with normal development. This increased activity will then most likely delay dendritic regression and synapse elimination so that the adequate performance of larval behavior will not be impaired too early by an inflexible hormone program. Activity-dependent modulation of steroid-induced developmental programs was also shown for programmed cell death (PCD). Motoneuron PCD could be delayed by ligating connectives in Manduca (Fahrbach and Truman, 1987) or by forcing emerging flies to show prolonged ecdysis behavior (Kimura and Truman, 1990).
In conclusion, our findings represent the first demonstration of activity-dependent modulation of steroid-induced dendritic regression and synapse elimination. Chronic extracellular recordings and stimulation make holometabolous insects suitable to further elucidate the concerted interplay between hormonal signals and activity-dependent mechanisms for structural and physiological changes of motoneurons.
Footnotes
We gratefully acknowledge the support by the Deutsche Forschungsgemeinschaft to C.D. (DU 331/2-3; SFB 515, A7). We thank Dr. R. B. Levine (ARL Division of Neurobiology, University of Arizona, Tucson, AZ) for many helpful comments on this manuscript. We thank J. F. Evers (Institute of Biology and Neurobiology, Free University Berlin, Berlin, Germany) for his expert help with the reconstruction tools for quantitative evaluation of neuronal shape and labeled protein distribution.
Correspondence should be addressed to Carsten Duch, Institute of Biology and Neurobiology, Free University Berlin, Koenigin-Luise Str. 28-30, 14195 Berlin, Germany. E-mail: duch{at}neurobiologie.fu-berlin.de.
Copyright © 2004 Society for Neuroscience 0270-6474/04/249826-12$15.00/0


