

Article Figures & Data
Figures
- Figure 1.
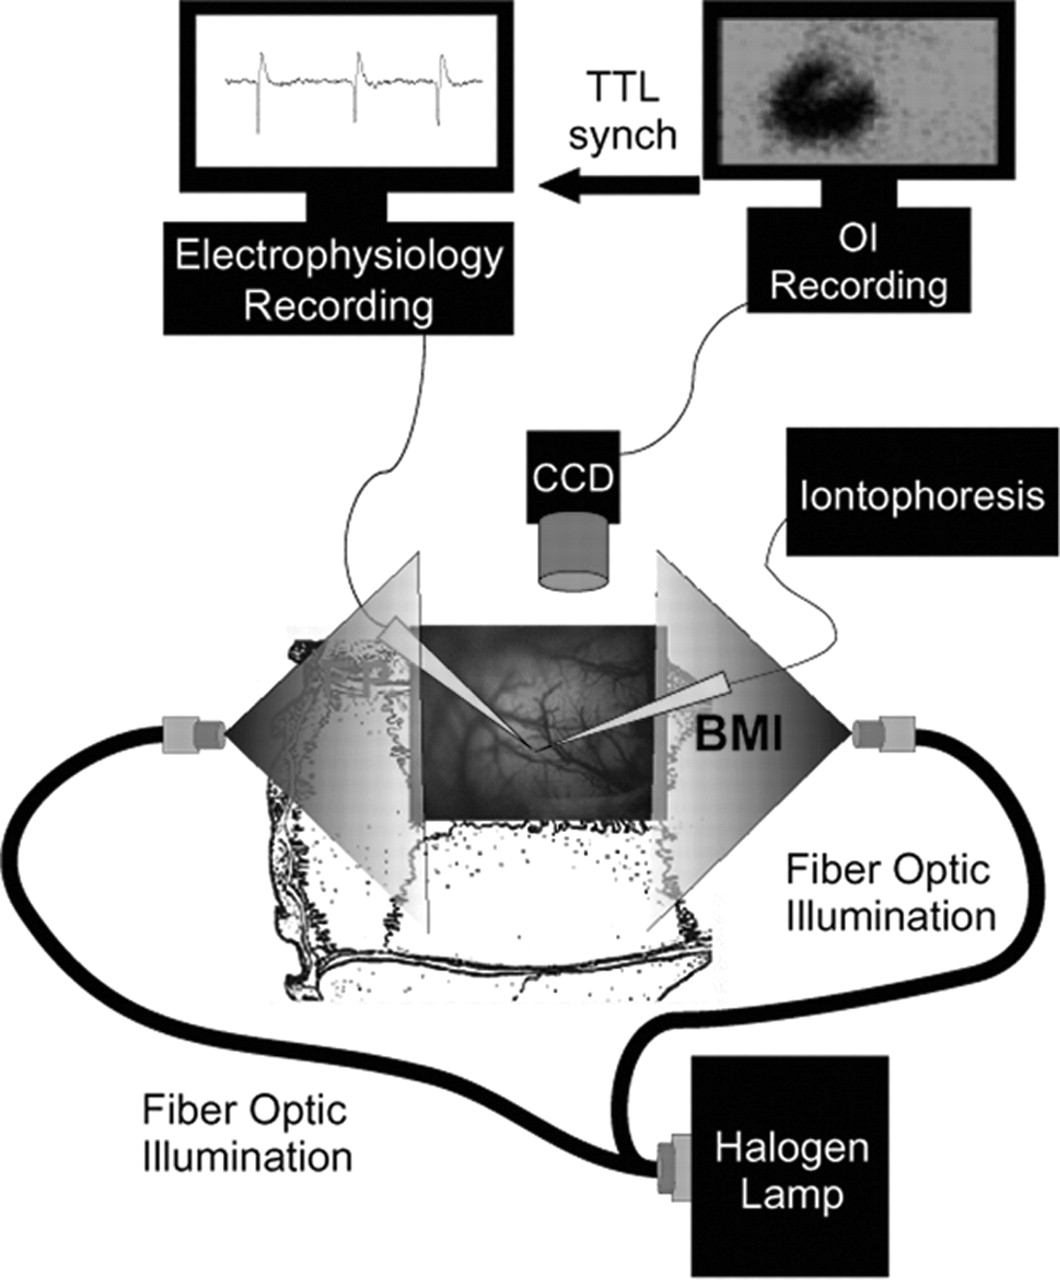
Simultaneous ORIS-electrophysiology set up. Two fiber-optic light guides illuminate the exposed cortex through the thinned skull between lambda and bregma. F.P. and iontophoresis electrodes penetrate the skull and are advanced into the cortex. A time stamp for each frame acquisition with the optical imaging (OI) computer is recorded on the electrophysiology computer for later correlation with the IISs. TTL synch, Transistor-transistor logic synchronization.
- Figure 8.
Spatial extent of excitatory IOS as a function of time and wavelength. A, Each panel depicts a contour plot of the spatial extent of an average spike-triggered map at different wavelengths and thresholds. Although the absolute area and shape change with the threshold, the relative size remains stable. Scale bars, 1 mm. B, Time course of spatial extent at 5, 10, and 15% threshold in one animal. The temporal dependence on the relative sizes is apparent regardless of threshold. C, The average extent of spread (area) of the change in reflectance in the focus in all animals (n = 10) is both temporally and wavelength dependent. The slope of the graph in the first 1 sec demonstrates the rate of propagation of the signal.
- Figure 2.
Spike-triggered image division averaged over multiple spikes. IIS epilepsy maps can be generated using spike-triggered image division from either a single IIS or multiple IISs. A, Image obtained at 546 nm shows blood vessel pattern seen through a thin layer of skull. B, Stable, well-formed, biphasic IISs were induced at regular intervals with focal iontophoresis of BMI. Simultaneous ORIS and F.P. recordings show that each IIS induces a change in reflection of light. C, ORIS spike-triggered map at 605 nm was generated by dividing each single frame after the IIS (black bars) by the single frame (gray bar) that preceded the IIS (frame duration, 100 msec). D, To increase the signal-to-noise ratio, we averaged over multiple spikes (n = 185). Each IIS crosses a certain threshold within the first 100 msec, but the timing of the peak is variable. Frame rate and images are identical to C in the same animal. Scale bar, 1 mm.
- Figure 3.
ORIS at multiple wavelengths. A-D, Spike-triggered image division at 546 ± 10 nm (A) (n = 208 spikes), 605 ± 10 nm (B) (n = 185 spikes), 630 ± 10 nm (C) (n = 218 spikes), and 700 ± 10 nm (D) (n = 215 spikes) demonstrate the wavelength dependence of the optical signal (see Discussion). E, Magnified example of spike-triggered image divisions at four wavelengths at 0.3 sec (early) after IISs. F, Magnified example of spike-triggered image divisions at four wavelengths at 2.5 sec (late) after IISs. G, The amplitude and time course of the intrinsic signal change was measured from a single ROI in the focus (dark blue) and multiple, symmetric ROIs in the surrounding cortex (red, orange, light blue, yellow). H, Inverted optical signals recorded from the surrounding cortex are smaller in amplitude than signals recorded from the focus, regardless of wavelength, and appear in all directions. The amplitude of the signals decreases with increasing wavelength. Scale bars, 1 mm
- Figure 4.
Monophasic CBV signal and biphasic oxygenation signal. A-D, Multiwavelength ORIS in another animal at 546 ± 10 nm (A) (n = 134 spikes), 605 ± 10 nm (B) (n = 125 spikes), 630 ± 10 nm (C) (n = 75 spikes), and 700 ± 10 nm (D) (n = 73 spikes) highlights the reproducibility and variability of our results. Note the late inverted IOS at 605 and 630 nm begins focally and then propagates in the draining veins. E, The image at 546 nm shows a blood vessel pattern of an imaged region covered with thin skull. The blue box is an ROI in focus measured in F. Scale bars, 1 mm. Time course of superpixel in the focus measured at each wavelength. G, Magnified example of spike-triggered image divisions at four wavelengths at 0.3 sec (early) after IISs. H, Magnified example of spike-triggered image divisions at four wavelengths at 3.0 sec (late) after IISs. Scale bars, SEM.
- Figure 5.
Spatial extent of IOS as a function of wavelength. Spatial extents were calculated by thresholding pixels as described in Materials and Methods. A, Spatial extents of both excitatory IOS in focus and inverted IOS in surround have wavelength dependence. The white area indicates pixels for which values are below (decrease in reflection of light) or above (increase in reflection of light) the threshold for excitatory and inverted signals, respectively. Early excitatory IOS was chosen 0.3 sec after the IIS, whereas late excitatory IOS was chosen at the peak of spatial extent at each wavelength. The inverted IOS was thresholded at the maximum of the early and late peaks; in this example, these peaks occurred at 1.5 and 3 sec after the IIS, respectively. The timing of images is denoted by arrows in B-E. Note the focality of the IOS in the focus recorded early and the inversion of the inverted optical signal in surround comparing early to late images. Scale bars, 1 mm. The time course of spatial extent for both excitatory (closed circle) and inverted (open circle) IOS is demonstrated at 546 nm (B), 605 nm (C), 630 nm (D), and 700 nm (E).
- Figure 6.
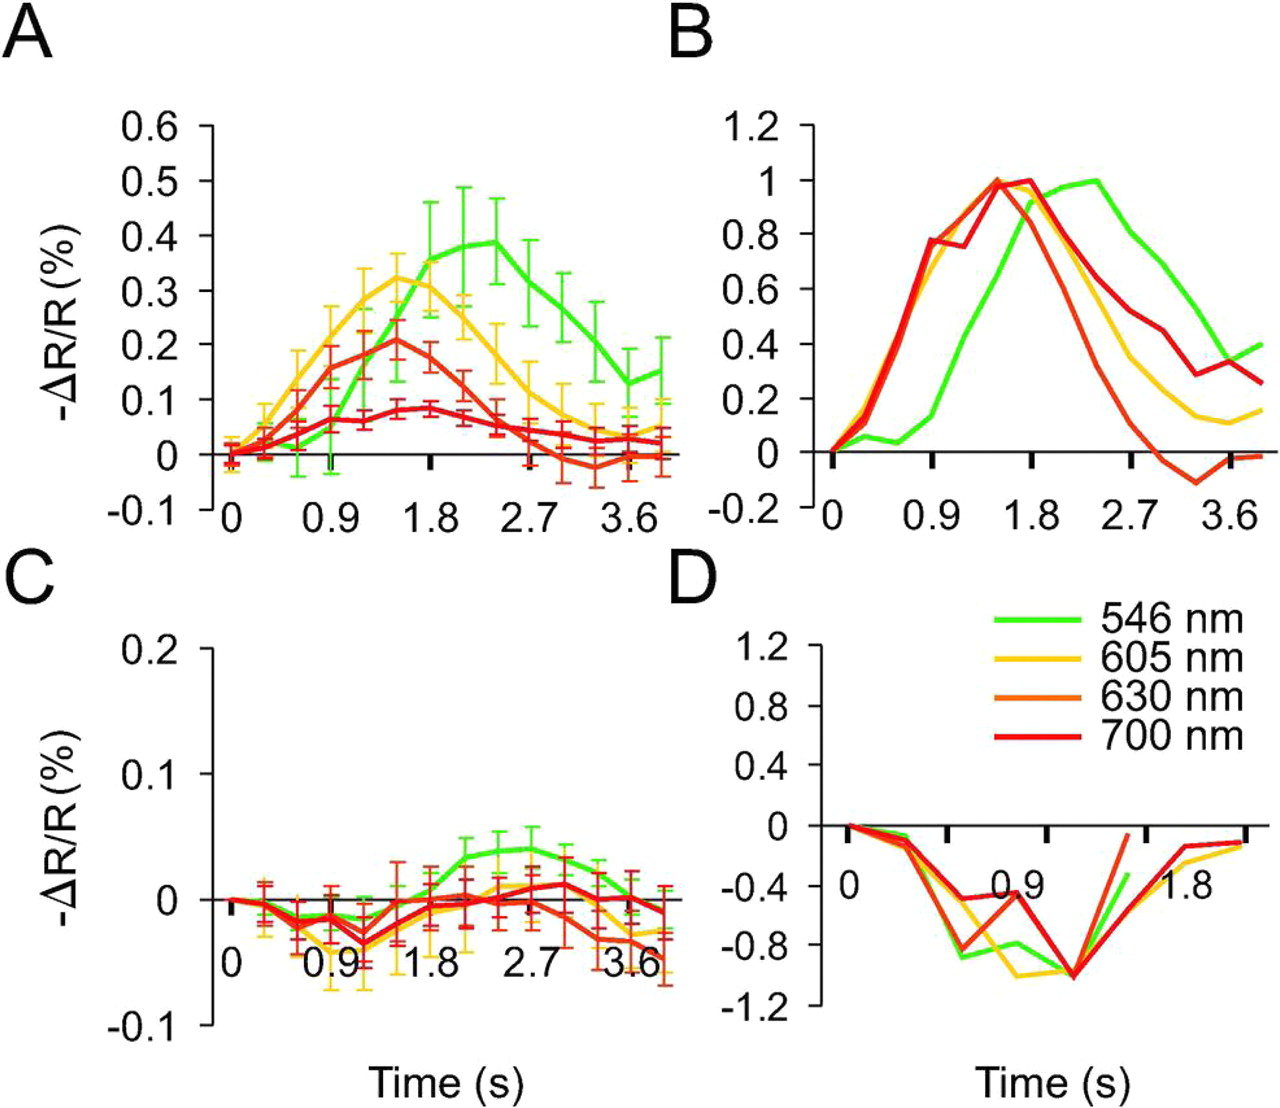
Average results of changes in reflectance as a function of time. A, Percentage of change in reflection of light in the focus as a function of time and wavelength after each IIS. The amplitude of the IOS is clearly greatest when recorded at 546 nm, followed by 605, 630, and 700 nm. B, Data are normalized to the maximum change in -ΔR/R (%) to show that the rise in the signal is fastest at higher wavelengths. C, Percentage of change in reflection of light from the surround as a function of time and wavelength after each IIS. An inverted optical signal is seen in all wavelengths, and the amplitude of this inverted IOS is equivalent, regardless of wavelength. D, Data are normalized to the maximum negative change in -ΔR/R (%) to show that, temporally, there is no wavelength dependence in this signal.
- Figure 7.
Earliest significant change in light reflection. A, The earliest statistically significant change (paired t test; p < 0.05) in reflectance of light was seen at 100 msec at all wavelengths, although more commonly at wavelengths sensitive to oxygenation of hemoglobin. B, The earliest statistically significant (paired t test; p < 0.05) inverted change in reflectance of light in the surround was seen at 100 msec, regardless of the wavelength. Again, the oxygenation signal is more commonly seen at 100 msec than the CBV signal. In several cases, the inverted signal in the surrounding cortex was delayed compared with the positive signal in the focus for all wavelengths tested.


Tables
Time Wavelength 0.3 sec 0.6 sec 0.9 sec 1.2 sec 1.5 sec 1.8 sec 2.1 sec 2.4 sec 2.7 sec 3.0 sec 3.3 sec 3.6 sec 3.9 sec 546 versus 605 nm X X X X X X X X 546 versus 630 nm X X X X X X X X 546 versus 700 nm X X X X X X X 605 versus 630 nm 605 versus 700 nm X X X 630 versus 700 nm X X X -
Summary of ANOVA (post hoc SNK) test of spatial extent of excitatory IOS. X denotes statistical significance (p < 0.05).
-


