

Abstract
Mutations in the potassium channel gene Kv1.1 are associated with human episodic ataxia type 1 (EA-1) syndrome characterized by movement disorders and epilepsy. Ataxic episodes in EA-1 patients are often associated with exercise or emotional stress, which suggests a prominent role for the autonomic nervous system. Many of these alterations are reproduced in the Kv1.1-null mouse. Kv1.1 also regulates excitability of sensory neurons essential in cardiovascular and respiratory reflexes. We examined the neural control of the respiratory system of littermate wild-type (control) and Kv1.1-null mice during low O2 (hypoxia). Immunohistochemical studies demonstrated Kv1.1 in the afferent limb of the carotid body chemoreflex (the major regulator in the response to hypoxia), consisting of the carotid body, petrosal ganglion, and nucleus of the solitary tract (NTS). Respiration was examined by plethysmography. Null mice exhibited a greater increase in respiration during hypoxia compared with controls. In vitro carotid body sensory discharge during hypoxia was greater in null than control mice. In the caudal NTS, evoked EPSCs in brainstem slices were similar between control and null mice. However, the frequency of spontaneous and miniature EPSCs was greater in null mice. Null mice also exhibited more asynchronous release after a stimulus train. These results demonstrate the important role of Kv1.1 in afferent chemosensory activity and suggest that mutations in the human Kv1.1 gene have functional consequences during stress responses that involve respiratory reflexes.
Introduction
Potassium (K+) channels are vital for information transfer in the nervous system because of their ability to set the resting membrane potential (RMP), control action potential duration, terminate periods of activity, and time the interspike intervals during repetitive firing (Pongs, 1999; Hille, 2001). The contribution of these channels to neuronal activity depends not only on the current subtype (i.e., voltageor calcium-dependent, etc.), but also on where the channels are expressed (Pongs, 1999). Kv1.1 is a voltage-gated dendrotoxin (DTX)-sensitive potassium channel that is present in axons, dendrites, and nerve terminals where it significantly modulates neuronal activity and neurotransmitter release (Wang et al., 1993, 1994; Smart et al., 1998; Chiu et al., 1999).
Missense mutations in the Kv1.1 channel gene are associated with episodic ataxia type 1 (EA-1) syndrome in humans. This syndrome is characterized by continuous myokymia, exercise, and stress-induced episodic attacks of ataxia, spastic contractions of skeletal muscles, and partial epilepsy (Zuberi et al., 1999; Benatar, 2000). The functional basis for the EA-1 phenotype has been investigated using the Kv1.1-null mouse (Smart et al., 1998; Zhou et al., 1998) and, more recently, a mouse carrying the V408A EA-1 mutation (Herson et al., 2003). We previously demonstrated the presence of Kv1.1 in visceral sensory neurons (Andrews and Kunze, 2001; Glazebrook et al., 2002) associated with cardiorespiratory reflexes that are essential to cardiovascular and respiratory homeostasis. Using both experimental and modeling approaches, we showed elimination of Kv1.1 increased excitability of these neurons. Kv1.1 activates sufficiently rapidly that its block reduces the depolarizing current necessary to elicit an action potential near threshold. Block of Kv1.1 also reduces the afterhyperpolarization, thus contributing to repetitive discharge (Glazebrook et al., 2002). These effects on visceral sensory neurons predicted that alterations in the autonomic nervous system may occur in Kv1.1-null mice and, possibly, in EA-1 individuals.
We examined the effects of Kv1.1 deletion on a major autonomic reflex, the respiratory response to hypoxic stress. This response is mediated by the carotid chemoreceptor reflex, the primary reflex response that increases breathing during hypoxia (Eyzaguirre and Zapata, 1984; Prabhakar, 2000) and modulates respiration during exercise (Ward et al., 1987). The afferent activity of this chemosensory pathway is initiated at oxygen-sensitive cells in the carotid body that lies in the bifurcation of the common carotid artery. These cells release neurotransmitters that activate the peripheral axons of neurons lying in the petrosal ganglion. The petrosal neurons project their central branches to the caudal nucleus of the solitary tract (NTS) in the brainstem (Finley and Katz 1992; Andresen and Kunze, 1994). Here, the activity is integrated and ultimately transmitted to neurons regulating respiratory rate and volume. Activity in the nerve fibers is directly related to the degree of hypoxia at the chemosensory cells. We hypothesized that deletion of Kv1.1 would significantly increase the excitability of the chemosensory pathway and augment respiration during hypoxia. To test this hypothesis, we examined the electrophysiological properties of the carotid body, petrosal neurons, and NTS cells in mice lacking Kv1.1 and compared them with control mice.
Materials and Methods
Experiments were performed on littermate control (Kv1.1+/+), heterozygous (Kv1.1+/-), and null (Kv1.1-/-) mice. Breeding pairs were purchased from The Jackson Laboratory (Bar Harbor, ME), and offspring were genotyped as previously described (Zhou et al., 1998). All of the experimental protocols were in compliance with the Case Western Reserve University Institutional Animal Care and Use Committee guidelines.
Measurement of respiratory variables. In unanesthetized animals, respiration was monitored by whole-body plethysmography as previously described (Kline et al., 2002a). Briefly, animals were placed in a 600 ml Lucite chamber that contained an inlet port for gas administration and an outlet port for airflow and gas sampling. The chamber was connected to a high-gain differential pressure transducer (Valydine MP45; Validyne, North Ridge, CA). As the animal breathed, changes in pressure were converted to signals representing tidal volume (VT), which were amplified (BMA 830; CWE, Ardmore, PA), recorded on a strip-chart recorder, and stored in a computer with respiratory acquisition software for analysis. Oxygen consumption (V̇O2) was determined by the open-circuit method using a Beckman OM-14 analyzer. V̇O2 was determined from the product of the flow and the inflow-outflow concentration difference in oxygen.
Animals were placed in the plethysmograph chamber and acclimated for 60 min in room air. In the first set of experiments, the hypoxic ventilatory response (HVR) was determined. Mice (n = 6 for each genotype) were exposed to 100, 21, and 12% O2-balance N2 for 5 min each. These gas mixtures typically produce arterial pO2 values of ∼240, 105, and 70 mmHg, respectively (Kline et al., 1998). The protocol was repeated after a 20 min interval. In the second set of experiments, the hypercapnic ventilatory response (HCVR) was examined. Mice inspired 100% O2 for 5 min followed by 5% CO2-balance O2. After a 20 min interval, the protocol was repeated.
The variables analyzed in unanesthetized mice were respiratory rate (RR) (breaths/minute), VT (microliters), and minute ventilation [V̇E (milliliters/minute) = RR × VT]. Respiratory variables (RR and VT) were averaged for 15 consecutive breaths over each minute of inspired O2 and CO2 challenge. VT, V̇E, and V̇O2 were normalized to body weight. Results are expressed as mean ± SEM. Respiratory differences among genotypes were analyzed by ANOVA.
In vitro carotid body activity. Carotid body activity was monitored as previously described (Kline et al., 2002a). Mice were anesthetized and intubated, and the carotid bifurcation was carefully excised and placed in ice-cold medium containing the following (in mm): 125 NaCl, 5.3 KCl, 1.8 CaCl2, 2.0 MgSO4, 1.2 NaH2PO4, 25 NaHCO3, 10 d-glucose, and 5 sucrose, pH 7.4. The carotid body and sinus nerve were isolated, transferred to a recording chamber, and superfused with medium at a flow rate of 2 ml/min. The medium was saturated with 95, 21, 12, or 1% O2, which equated to pO2 of ∼430, 140, 65, and 32 mmHg, respectively. All of the gas mixtures contained 5% CO2 to maintain the pCO2 at ∼36 mmHg. The partial pressures of O2 and CO2 were measured from the solution reservoir using a blood gas analyzer (ABL5; Radiometer, Copenhagen, Denmark). These gas mixtures approximate arterial pO2 measurements observed in vivo during 100, 21, 12, and 5% O2 inspiration in studies by us (Kline et al., 1998) and others (Tagaito et al., 2001). Discrepant arterial blood versus medium values are attributable to differences in water vapor pressure, temperature, in vivo alveolar-capillary interface, etc. Tissue was randomly exposed to 140, 65, or 32 mmHg pO2 for 3 min, and after these exposures, the medium was returned to 430 mmHg pO2, which served as baseline. All of the experiments were performed at 33-34°C. Carotid sinus whole-nerve activity was recorded with a suction electrode. Electrical signals were amplified, passed through a window discriminator, summed every second, and expressed as impulses per second. Inevitably, the occurrence of compound action potentials at higher discharge frequencies in control and null mice may underestimate the firing rate, and thus underestimate the magnitude of increases in discharge during hypoxia. Differences between genotypes were analyzed by ANOVA or t test.
Isolation, culture, and electrophysiology of petrosal ganglia neurons. Petrosal ganglia were excised from adolescent (postnatal day 14-21) mice. Tissue was collected after ether anesthesia and decapitation. The ganglia were incubated in Earle's balanced saline solution containing 5 mg/ml trypsin, 0.2 mg/ml cysteine, 0.5 mm EDTA, and 1.5 mm CaCl2, for 30 min at 37°C. The enzyme-containing medium was then replaced with 3 ml of DMEM/F-12 with 5% fetal bovine serum, 0.1% serum extender, and 1.5 mg/ml albumin. The tissue was triturated to disperse the cells and subsequently placed into 35 mm Petri dishes containing poly-d-lysine-treated glass coverslips.
Electrophysiological experiments were performed on isolated neurons, 24-72 h after plating, using the whole-cell patch technique under voltage-clamp conditions. Data were digitized and analyzed using pClamp8 software (Axon Instruments, Union City, CA). Capacitance and series resistance (range, 4-12 MΩ) were compensated. Electrodes (0.5-4.0 MΩ) were prepared from 8161 glass (World Precision Instruments, Sarasota, FL). For isolation of K+ currents (IK), the bath solution contained the following (in mm): 140 N-methyl-d-glucamine, 5.4 KCl, 1 MgCl2, 0.02 CaCl2, and 10 HEPES, pH adjusted to 7.3 with NaOH. The pipette solution contained the following (in mm): 145 K-aspartate, 1.95 CaCl2, 2.2 EGTA, 2 MgCl2, 10 glucose, and 5 HEPES, pH adjusted to 7.2 with KOH. α-DTX (Calbiochem; 100 nm) was used to examine IK in control and null mice. α-DTX-sensitive currents were determined from ramp and/or step voltages from -60 to +20 mV from a holding potential of -90 mV. Current-clamp experiments were conducted in the following solution (in mm): 145 NaCl, 5.4 KCl, 1 MgCl2, 2 CaCl2, 10 HEPES, and 10 glucose, pH adjusted to 7.4 (NaOH). The pipette contained the following (in mm): 10 NaCl, 50 KCl, 50 K2SO4, 10 HEPES, and 5 MgCl2, pH 7.2 (KOH). Action potentials were elicited in current-clamp mode by a depolarizing 50 ms step at a frequency of 0.33-20 Hz or by an 800 ms step at 0.33 Hz. Threshold for action potential generation was tested by a step series of 150 ms depolarizing current injections. α-DTX and DTX K (toxin K) (Calbiochem; 100 nm), which specifically blocks Kv1.1, were used to examine the role of Kv1.1 on action potential characteristics.
Brainstem slice preparation and electrophysiology. Brainstem slices containing the NTS were prepared from 4- to 6-week-old mice. Mice were anesthetized with ether and decapitated. The brainstem was removed and placed in ice-cold artificial CSF (ACSF) containing the following (in mm): 125 NaCl, 3 KCl, 1.2 KH2PO4, 1.2 MgSO4, 25 NaHCO3, 10 d-glucose, and 2 CaCl2, saturated with 95% O2-5% CO2 pH 7.4, 300 mOsm. Horizontal slices (180-190 μm) were cut with a sapphire knife (Delaware Diamond Knives, Wilmington, DE) using a vibrating microtome (Leica VT 1000S). Tissue sections were placed in a custom-made lucite superfusion chamber (volume, ∼1.2 ml) that contained inlet and outlet ports for ACSF flow. The submerged sections were secured with a nylon mesh and superfused at a flow rate of 3 ml/min with ACSF at 31-33°C. All of the recordings were made from cells in the caudal NTS, an area with a high density of carotid body afferent fiber termination (Finley and Katz, 1992).
Neurons were visualized using an Olympus microscope (40× magnification) equipped with fluorescence, differential interface contrast, and an infrared-sensitive camera. The pipette was guided using a piezoelectric micromanipulator (PCS-5000; Burleigh, Victor, NY). Recording electrodes (7151 glass; 3.5-5.0 MΩ) were filled with a solution containing the following (in mm): 10 NaCl, 130 K+ gluconate, 11 EGTA, 1 CaCl2, 10 HEPES, 1 MgCl2, 2 MgATP, and 0.2 NaGTP, pH 7.3, 295-300 mOsm. EPSCs were generated by placing a concentric bipolar stimulating electrode (Frederick Haer, Bowdoinham, ME) on the solitary tract (TS) containing chemosensory as well as other visceral afferents (Andresen and Kunze, 1994) and stimulating (0.1 ms duration) at frequencies of 0.5, 1, 5, 10, 20, and 50 Hz with an isolated programmable stimulator (AMPI, Jerusalem, Israel). Stimulus frequencies were determined, in part, from studies showing mouse chemosensory afferent single fibers increase discharge from ∼1 to 20 Hz during hypoxia (Donnelly and Rigual, 2000; Rigual et al. 2002). In experiments in which we wished to record spontaneous miniature EPSCs (mEPSCs), the recording electrodes contained the following (in mm): 5 NaCl, 130 Cs+ methanesulfonate, 10 CsCl, 11 EGTA, 1 CaCl2, 10 HEPES, 1 MgCl2, 2 MgATP, 0.2 NaGTP, and 5 lidocaine N-ethyl bromide (QX-314), pH 7.3, whereas the extracellular solution contained 1.0 μm tetrodotoxin (TTX) and 10 μm bicuculline methobromide. It should be noted that bicuculline salts may block Ca2+-activated K+ channels (Seutin and Johnson, 1999) and potentially alter synaptic transmission by increasing presynaptic action potential duration. We did not see a difference in EPSC amplitude in the presence or absence of bicuculline (see Results). This is consistent with Hu et al. (2001) who demonstrated blockade of BK channels does not alter EPSCs or EPSPs in hippocampal neurons. In all of the protocols, neurons were voltage clamped at -60 mV in the whole-cell configuration. Data was filtered at 2 kHz and sampled at 10 kHz using pClamp8 software (Axon Instruments). Neurons were rejected if resting membrane was more positive than -45 mV.
Data were analyzed via Axon Clampfit, Synaptosoft (Decatur, GA) Mini-Analysis Program, and Origin software. Each data point for a given trial was an average of 10-18 sweeps. Average EPSC amplitudes during 5 and 10 Hz were determined from all of the EPSC sweeps, excluding the first. Synaptic events were compared between control and null mice using an unpaired t test. Data were presented as mean ± SEM. Spontaneous and miniature EPSC distributions were compared using Kolmogorov-Smirnov tests.
Immunohistochemistry. Mice were anesthetized by ether inhalation and decapitated. The carotid artery bifurcation (containing the carotid body), petrosal ganglia, and the brainstem were quickly removed and embedded in OCT compound (TissueTek). The tissue was sectioned at 8-10 μm by cryostat, and the sections were placed in fixative solution (3% paraformaldehyde and 0.1% Triton X-100 in 0.1 m phosphate buffer, pH 7.4) for 5 min. After brief rinses in PBS, the tissue sections were blocked (10% serum, 1% BSA, and 0.1% Triton X-100 in PBS) for 30 min, which was followed by a 14 h incubation with primary antibody at 4°C. The following primary antibodies were used: rabbit polyclonal Kv1.1 (1:200 dilution; Alomone, Jerusalem, Israel), mouse monoclonal Kv1.1 (1:200; Upstate Biotechnology, Lake Placid, NY), mouse monoclonal synaptophysin (1:500; Sigma, St. Louis, MO), mouse monoclonal neurofilament mixture (NFC, consisting of NF68, NF160, and NF200; 1:100; Sigma), mouse monoclonal glial fibrillary acidic protein (GFAP; 1:400; Sigma), rabbit polyclonal tyrosine hydroxylase (TH; 1:200; ABR, Golden, CO), and mouse monoclonal TH (ImmunoStar, Hudson, WI; 1:200). GFAP is a common marker of carotid body type 2 supporting cells, whereas TH delineates the oxygen-sensing glomus cells and sensory afferent fibers (Finley et al., 1992; Chou et al., 1998). Primary antibodies were diluted in PBS containing 1% BSA and 0.1% Triton X-100. After two 5 min rinses in PBS, the sections were incubated with secondary antibodies diluted in blocking solution for 90 min. Secondary antibodies were as follows: donkey rhodamine Red-X-anti-rabbit IgG and donkey FITC-anti-mouse IgG (1:800 dilution; Jackson ImmunoResearch, West Grove, PA). The tissue sections were rinsed in PBS and mounted using Vectashield medium (Vector Laboratories, Burlingame, CA). Images were obtained using a Leica (Nussloch, Germany) TCS SP2 spectral confocal microscope; the image was an average of 12 scans (512 × 512 pixels). Final images were prepared using Adobe Photoshop and Auto-Quant software.
Results
Role of Kv1.1 in respiration
Respiratory responses to hypoxia
Awake, unanesthetized Kv1.1+/+ (control), Kv1.1+/- (heterozygous), and Kv1.1-/- (null) littermate mice were exposed to 100, 21, or 12% O2 for 5 min, while respiration was monitored by plethysmography. Null mice weighed less than control and heterozygous mice (18.3 ± 0.8 vs 28.1 ± 1.7 and 31.3 ± 2.0 g, respectively; p < 0.05; ANOVA). Therefore, VT, V̇E, and V̇O2 were normalized to the body weight of the animal. An example of respiration in a control and null mouse during the fifth minute of O2 exposure is shown in Figure 1A. Decreasing inspired O2 from 100 to 12% resulted in a greater increase in respiration in null mice compared with controls. Mean RR, VT, and VE for the entire O2 exposure is plotted in Figure 1B. During 100 and 21% O2, respiratory parameters were similar among the groups (p > 0.05; ANOVA; n = 6 for each group) (Fig. 1B). Exposure to hypoxia (12% O2) increased respiration in all of the mice; however, V̇E was significantly greater in null compared with control and heterozygous mice (p < 0.05; ANOVA) (Fig. 1B) (i.e., control, 0.61 ± 0.02 ml · min-1 · g-1, vs null, 0.94 ± 0.07 ml · min-1 · g-1). The augmented HVR in null mice was attributable to changes in both RR and VT (p < 0.05; ANOVA) (Fig. 1B). V̇O2 was comparable between control and null mice during 100 and 21% O2 (data not shown). Hypoxic inspiration decreased V̇O2 in both groups of mice to a similar value (control, 0.048 ± 0.006 ml · min-1 · g-1, vs null, 0.045 ± 0.005 ml · min-1 · g-1; p > 0.05; t test). Normalizing ventilation to metabolism (V̇E/V̇O2) demonstrated Kv1.1-null mice hyperventilated significantly more during hypoxia than control mice (control, 14.6 ± 0.8, vs 19.1 ± 2.0; p < 0.05; t test).

Respiratory responses to acute hypoxia. A, Representative example of respiration during the fifth minute of 100, 21, and 12% O2 in an unanesthetized control and null mouse. Upward deflection represents inspiration. Note the greater increase in respiration in null mice during 12% O2. B, Averaged values for respiratory rate (Resp. Rate) (breaths per minute), VT (microliters per gram), and V̇E (Min. Vent.) (milliliters per minute per gram-1) in control (+/+; ▪), heterozygous (+/-; ▴), and null (-/-; ○) mice (n = 6 each group) during 5 min of 100, 21, and 12% O2. Data are expressed as mean ± SEM. *p < 0.05 (ANOVA). The V̇E response to 12% O2 was significantly greater in null than control mice because of increased respiratory rate and VT.
Respiratory responses to hypercapnia
To determine whether the increased respiratory response observed in null mice is specific to hypoxia or whether these mice experience a general hyperexcitability of the respiratory control system, we also examined the respiratory response to hypercapnia (elevated carbon dioxide). Although the HVR is primarily attributable to the peripheral carotid body chemoreceptors, the HCVR is thought to be of central origin (Bisgard and Neubauer, 1995). Thus, we monitored respiration in mice that were exposed to hyperoxic hypercapnia (95% O2 and 5% CO2). Inspiring such a gas mixture would minimize peripheral chemoreceptor activity (because of the elevated O2 levels) yet stimulate breathing, allowing us to examine the excitability of the central CO2 chemoreceptors in Kv1.1 mice. In response to hyperoxic hypercapnia, all of the mice responded with an increase in RR, VT, and V̇E. There were no significant differences in the HCVR among the three groups (data not shown) (p > 0.05; ANOVA). These results suggest a negligible role of Kv1.1 in central chemoreception and/or respiratory motor nuclei under these conditions. However, the enhancement of null mice HVR suggests an alteration in the peripheral chemoreceptor sensory pathway.
Role of Kv1.1 in peripheral chemosensitivity
The carotid body, the primary oxygen-sensing tissue of the body, consists of many receptor complexes that contain glomus cells, supporting cells, and nerve fibers. The O2-sensitive glomus cells form clusters of ∼5 or more cells that are innervated by sensory afferent fibers. These sensory fibers originate from the petrosal ganglion, travel through the carotid sinus nerve (CSN), and enter the carotid body where they branch and form reciprocal synapses with the glomus cells. Supporting type 2 or sustentacular cells envelope the glomus cell clusters and synapses (Eyzaguirre and Zapata, 1984). To colocalize Kv1.1 in the specific cell types, we used antibodies against GFAP to demarcate type 2 cells, TH to distinguish glomus cells and sensory afferent fibers, and NFC to define nerve fibers (Finley et al., 1992; Chou et al., 1998; Buniel et al., 2003). Confocal images of mouse carotid body cross sections are presented in Figure 2. In control mice, Kv1.1 immunofluorescence colocalized with TH- and NFC-positive fibers in the CSN (Fig. 2A,B). In null mice, Kv1.1 immunostaining was not observed in NFC-positive CSN fibers (Fig. 2C). Higher magnification examination of control sections demonstrated Kv1.1 in or near TH-containing glomus cells (Fig. 2D, arrowhead) and GFAP-labeled type 2 cells (E, arrowhead), and in NFC-containing nerve fibers that course throughout the glomus cell clusters (F, arrowhead).

Localization of Kv1.1 in the carotid body. Confocal images of control (A, B) and null (C) mouse carotid bodies. Kv1.1-like immunoreactivity (red) is shown in the left panel. TH- or NFC-like immunoreactivity (green) is shown in the middle panel. The right panels are an overlay of the two images. The CSN (arrow) is identifiable via TH (A) and NFC (B, C) immunofluorescence. In control mice, Kv1.1 colocalized with TH (A, right, yellow)- and NFC (B, right, yellow)-positive CSN fibers. In cross sections from control mice, TH also labeled glomus cell (GC) clusters within the carotid body (A, middle, arrowhead). However, in null mice, Kv1.1 was not observed in NFC-positive CSN fibers. Magnified single-scan confocal images of a control mouse carotid body are shown in D-F. Bright-field (BF) scans are shown in the leftmost panels. The broken line delineates glomus cell clusters. Red immunofluorescence represents Kv1.1. Green immunofluorescence depicts TH (D), GFAP (E), or NFC (F). The rightmost panels show an overlay of the fluorescent images. In control mice, Kv1.1 colocalized (arrowhead) with TH-positive glomus cells (D), GFAP-containing type 2 cells that surround the glomus clusters (E), and NFC-positive fibers that enter and course throughout the glomus receptor complex (F). Scale bars: A-C, 50 μm; D-F, 10 μm.
To establish a functional role for Kv1.1, chemosensory afferent nerve activity was recorded in vitro from control and null mice tissue. Medium equilibrated with 95% O2 served as baseline, and carotid bodies were randomly exposed to 21, 12, or 1% O2 for 3 min. Medium bubbled with these gases resulted in a pO2 of ∼430, 140, 65, and 32 mmHg. An example of chemosensory activity during 430 and 32 mmHg in a control and null mouse is shown in Figure 3A. Exposure of carotid bodies to 32 mmHg (filled bar; 3 min) resulted in a greater increase in sinus nerve activity in null compared with control mice. Averaged data of chemosensory activity versus medium pO2 for control, heterozygous, and null mice are presented in Figure 3, B and C. Medium pO2 was comparable among groups (p > 0.05; ANOVA). There were no significant differences among genotypes in the number of neural impulses during pO2 values of ∼430 or 140 mmHg (Fig. 3B,C)(p > 0.05; ANOVA). On reducing pO2 to 65 and 32 mmHg, peak (30 s apex of entire hypoxic exposure) (Fig. 3B) and mean (entire 3 min hypoxic exposure) (C) sinus nerve activity were significantly greater in null compared with control and heterozygous mice (p < 0.05; ANOVA).

Response of isolated carotid bodies to hypoxia. A, Representative example of in vitro chemosensory activity during 430 and 32 mmHg pO2 (3 min; closed bar) from control (left) and null (right) mouse tissue. Imp/sec (impulses per second), Rate meter output. AP, Whole-nerve action potential discharge. Note in null mice the greater increase in sinus nerve discharge during 32 mmHg compared with controls. B, C, Averaged sinus nerve activity during medium pO2 values of ∼430, 140, 65, and 32 mmHg is plotted as either the peak (B) (30 s apex of exposure) or mean (C) (entire exposure) response. The medium pO2 is comparable among all of the groups. Control mice (+/+; ▪), heterozygous mice (+/-; ▴), null mice (-/-; ○). *p < 0.05 (ANOVA). Data are expressed as mean ± SEM (n = 6 each group). Note the greater chemosensory response during 65 and 32 mmHg pO2.
In separate experiments, the effect of 200 nm α-DTX (which blocks Kv1.1) on chemosensory discharge was examined in control and null mouse tissue. If the augmented hypoxic discharge in null mice is attributable to lack of Kv1.1 channels in the carotid body complex, then application of α-DTX in control tissue should significantly increase the hypoxic sensory response. In contrast, α-DTX should have little or no effect in null tissue. α-DTX did not alter discharge frequency during baseline pO2 values of 430 mmHg in either mouse group. Conversely, α-DTX significantly increased sensory discharge during 32 mmHg in control (+44.2 ± 12.9%; n = 3; p < 0.05; t test) but not null mice (+7.6 ± 7.3%; n = 4; p > 0.05; t test). These findings demonstrate Kv1.1 located in glomus cells and/or afferent fibers modulates chemosensory activity in the carotid body.
Because of the comparable responses between control and heterozygous mice in their respiratory responses to hypoxia and in vitro chemosensory discharge, only control and null mice were further studied.
Role of Kv1.1 in petrosal ganglia
The somas of the chemosensory afferent fibers lie in the petrosal ganglion. The TH-containing cells in the ganglion project to the carotid body and account for ∼40% of the total chemosensory neurons (Finley et al., 1992). We performed immunohistochemistry on sections of petrosal ganglia to confirm the presence of Kv1.1. Immunofluorescence for Kv1.1 was present in the total cell population, albeit at variable fluorescent intensity, in control mouse sections (Fig. 4A). A portion of Kv1.1-containing cells colocalized with TH, consistent with our previous report in rats (Andrews and Kunze, 2001). In contrast, Kv1.1 immunoreactivity was not observed in the null mice (Fig. 4A).

Localization and role of Kv1.1 in petrosal neurons. A, Confocal images of petrosal cross sections from a control mouse. Kv1.1 (red) is expressed in the total cell population, including TH (green)-positive neurons. Kv1.1 was not observed in null mice. Scale bar, 25 μm. B, Example of petrosal K+ currents recorded from a control mouse in control solution, in the presence of DTX (100 nm), and the recovery after washout. The DTX-sensitive current was obtained by subtraction of current in the presence of DTX from the control current. The example shows the current response to 150 ms depolarizing steps from -60 to +20 mV in 5 mV increments from a holding potential of -90 mV. C, Averaged DTX-sensitive currents (mean ± SEM; black and gray lines, respectively; n = 12 each group) of control and null mouse cells in response to depolarizing ramps from -60 to +20 mV at 0.25 mV/ms. Current elicited during the ramp in the presence of DTX was subtracted from control current and plotted as DTX-sensitive current. Note that there is more DTX-sensitive currents in control mice compared with null mice. D, Effect of toxin K (TxK) on an action potential elicited by step depolarization at 0.33 Hz. The solid line represents control conditions, whereas the dotted line presents the action potential in the presence of toxin K (100 nm). Toxin K minimally prolongs the action potential. Calibration: 50 mV, 5 ms. E, Step depolarizing current pulses (800 ms, 100 pA) were applied to examine the change in excitability in the presence of DTX or toxin K. The responses are shown as five superimposed traces for each set as the neuron is exposed to control solution, toxin K, and DTX, and then returned to control solution. Note the increase in excitability in TxK and DTX.
Block of Kv1.1 (toxin K-sensitive current) eliminates ∼60-70% of the α-DTX-sensitive current in visceral sensory neurons, with the remainder of α-DTX current presumably carried by the Kv1.2 and Kv1.6 channels that are also present in these neurons (Glazebrook et al., 2002). To verify that Kv1.1 was not replaced by upregulation of Kv1.2 and Kv1.6 expression, we evaluated the amplitude of the α-DTX-sensitive current in primary cultures from wild-type and null mice. Current in the presence of α-DTX was subtracted from control current to yield α-DTX-sensitive current (Fig. 4B). Depolarizing ramps, used for subsequent analysis, produced outward IK in cells from both groups of animals. Application of α-DTX (100 nm) reduced total IK in both groups; however, the amount of current that was blocked by α-DTX in null mice was only 30% of the α-DTX current observed in control mice (p < 0.05; t test) (Fig. 4C). This is consistent with a previous report (Smart et al., 1998) showing that Kv1.2 was unchanged in Kv1.1-null hippocampal regions.
We were interested in whether Kv1.1 might serve as a significant repolarizing current during the action potential; thus its absence would prolong the action potential and possibly neurotransmitter release at the central presynaptic terminal. Previous studies in rats showed that there was only a small effect on the duration or amplitude of the action potential when α-DTX-sensitive channels were blocked (Glazebrook et al., 2002). This reflected the short duration of the action potential relative to the activation time of Kv1.1. In those studies, the most notable effects were a decrease in the amplitude of the afterpotential and an increased depolarization in response to sustained current injection in the range of Kv1.1 activation (Glazebrook et al., 2002). We determined in the present study the effect of toxin K, specific for Kv1.1, on membrane properties and action potentials elicited in response to depolarizing stimuli delivered at 0.33 Hz (50 ms) in primary petrosal cultures from control mice. Input resistance measured during a step from -70 to -60 mV, outside the range of activation of Kv1.1, was unchanged (in control, 516.7 ± 67.4 MΩ, vs in DTX, 522.1 ± 74.2 MΩ; n = 10; p > 0.05). However, input resistance increased from 511 ± 144 MΩ in control to 586 ± 163 MΩ in DTX (p < 0.05; n = 8) when measured during depolarizing current steps that brought the membrane potential into the range in which Kv1.1 is activated. Toxin K did not significantly depolarize petrosal neurons (-62.2 ± 1.6 vs -61.7 ± 1.7 mV; p > 0.05; paired t test), nor was peak amplitude changed during toxin K (80.5 ± 2.5 to 81.1 ± 2.4 mV; p > 0.05; paired t test). The half-width of the action potential increased slightly in the presence of the toxin from 2.9 ± 0.2 to 3.1 ± 0.1 ms (n = 19; p = 0.07; paired t test) (Fig. 4D), whereas afterhyperpolarization peak was less after toxin (-17.8 ± 1.4 to -16.1 ± 1.5 mV; p < 0.05; paired t test) (D). Similar results were obtained at 10 and 20 Hz in the presence of toxin K. Overall, these findings are comparable with what we had previously demonstrated in rats (Glazebrook et al., 2002). The increase in excitability we previously documented in rats (Glazebrook et al., 2002) was also present in the murine neurons. In seven of seven neurons, a current injection from the resting potential, which was just subthreshold for generation of an action potential, produced an action potential in the presence of toxin K or α-DTX. This is evident by the significantly decreased rheobase in the presence of toxin K (7.3 ± 1.8 vs 5.5 ± 1.8 pA/pF in toxin; p < 0.001; paired t test). Also, as previously demonstrated in detail in rat sensory neurons, α-DTX and toxin K increased the frequency and number of action potentials elicited in response to a depolarizing current step that produced at least one action potential in control solution (n = 4). An example of the increase in discharge in the presence of α-DTX and toxin K is shown for one neuron in Figure 4E.
Role of Kv1.1 in the NTS
Chemosensory afferent axons enter the brainstem, travel through the TS, and terminate in the NTS. Immunohistochemical examination of the NTS identified Kv1.1 in nerve fibers coursing through the TS as well as within the solitary tract nucleus (Fig. 5A). Synaptophysin, a presynaptic vesicle protein, was used as a marker for synaptic terminal regions (Wiedenmann and Franke, 1985). Kv1.1-positive fibers were localized near terminals and surrounded NTS relay cells (Fig. 5A, inset). Only rarely was Kv1.1 immunoreactivity observed in cell bodies. In null mice, Kv1.1 staining in the TS and NTS was not observed (Fig. 5B).

Localization of Kv1.1 in the NTS. Single-scan confocal images of a control and null mouse NTS cross section. In the left panel, red immunofluorescence depicts Kv1.1, whereas in the middle panel, green immunofluorescence represents the vesicle marker synaptophysin. The right panel shows an overlay of the fluorescent images. A, In control mice, Kv1.1 was found throughout the TS and caudal NTS. Kv1.1-immunopositive fibers readily approach and surround postsynaptic cells (dashed line box, also shown as an enlarged inset). B, Conversely, Kv1.1 was not observed in null mice. Scale bars, 20 μm.
Role of Kv1.1 in postsynaptic properties
We compared electrical properties of the postsynaptic relay neurons of Kv1.1-null with control mice in brainstem slices containing the NTS. Input resistance was comparable (control, 679 ± 150 MΩ, vs null, 915 ± 100 MΩ; p > 0.05). RMP of secondary NTS cells was not different between control and null mice [-58 ± 3 mV (n = 21) vs -60 ± 2 mV (n = 16), respectively; p > 0.05; t test]. Current injection elicited action potentials in control and null mice. Action potential properties were comparable between both groups (control vs null, respectively; amplitude, 80.0 ± 6.7 vs 74.2 ± 4.9 mV; threshold, -36.1 ± 2.2 vs -38.4 ± 2.2 mV; half-width, 1.2 ± 0.2 vs 0.9 ± 0.1 ms; afterhyperpolarization peak, -27.8 ± 3.3 vs -27.5 ± 4.8 mV; p > 0.05; t test). This was expected, because very few cells in the NTS expressed Kv1.1 immunoreactivity, and we have no evidence that those few that possess Kv1.1 are directly innervated by the afferent fibers.
Despite the comparable RMPs, action potentials generated by spontaneous EPSPs were more readily observed in null cells than controls. Action potentials were observed in 10 of 19 cells (53%) in null animals vs 4 of 20 cells (20%; p < 0.05; z test) in controls. These observations led us to examine the properties of the stimulus-evoked EPSCs.
Role of Kv1.1 in TS-evoked synaptic transmission
To characterize synaptic transmission in more detail, whole-cell voltage-clamp recordings were used to examine the effect of Kv1.1 deletion on stimulus-evoked EPSCs of caudal NTS relay neurons in brainstem slices, as previously described (Kline et al., 2002b). Electrical shocks to the TS at 0.5 Hz evoked EPSCs that were abolished by the non-N-methyl-d-aspartate glutamate receptor antagonist CNQX (10 μm; n = 2) (data not shown). TS-evoked EPSCs were not different between control and null mice. In control slices, EPSC amplitude averaged 99 ± 15 pA (n = 12), whereas EPSCs from null mice averaged 118 ± 27 pA (n = 13; p > 0.05; t test). The mean decay time constant (τ) (peak to end) for EPSCs was fitted to a single exponential and was comparable between groups (control τ, 3.9 ± 1.0 ms, vs null τ, 4.4 ± 0.7 ms; p > 0.05; t test).
We next asked whether increasing the frequency of stimulation, such as occurs during a hypoxia-induced increase in afferent activity, would significantly alter afferent processing. A characteristic feature of sensory afferent processing in the NTS is that, as the frequency of afferent input increases, there is a decrease in the postsynaptic response. This frequency-dependent depression (FDD) in the NTS is thought to be of presynaptic origin (Miles, 1986) and dominated by vesicular dynamics and intracellular calcium (Schild et al., 1995). Increasing the frequency of TS stimulation from 0.5 Hz (taken as baseline) to 1, 5, and 10 Hz produced FDD in both groups of animals. Although failing to reach significance, EPSC depression at 5 and 10 Hz was less in null mice than control mice. EPSCs during 1, 5, and 10 Hz decreased in control mice to 86.7 ± 5.0, 66.7 ± 4.3, and 62.5 ± 3.7% of baseline, whereas in null mice, EPSCs were 94.6 ± 3.2, 77.7 ± 7.3, and 72.4 ± 8.6% of baseline values, respectively (control vs null; p > 0.05; t test). Importantly, there was a significantly reduced failure rate at 1, 5, and 10 Hz (i.e., control failure rate at 10 Hz; 18.9 ± 7.7 vs 5.5 ± 3.3% in null; p < 0.05; z test).
To further investigate transmitter release and afferent processing, we analyzed the paired pulse ratio (PPR) of two consecutive EPSCs. A change in this ratio reflects alterations in presynaptic vesicular transmitter release (Zucker and Regehr, 2002). At a stimulus interval of 20 and 50 Hz, two EPSCs were monitored and the amplitude ratio of the second EPSC to the first was examined (i.e., PPR = EPSC2/EPSC1). TS stimulation at 20 and 50 Hz produced a depression in EPSC2 compared with EPSC1 in both groups of mice. Averaged PPR data from both frequencies were not significantly different in null mice compared with controls (at 20 Hz, control, 0.66 ± 0.07, vs null, 0.77 ± 0.12; at 50 Hz, control, 0.70 ± 0.05, vs null, 0.87 ± 0.08; p > 0.05; t test).
Characterization of the spontaneous activity within the NTS
We characterized the effect of deletion of Kv1.1 on spontaneous EPSC (sEPSC) amplitude and frequency. An example of spontaneous activity in a control and null mouse is shown in Figure 6A. Spontaneous EPSC amplitude of control mice averaged 26.2 ± 4.4 pA, whereas that of null mice was 14.1 ± 2.3 pA (p = 0.059 vs control; t test). Cumulative probability plots of sEPSC amplitudes and interevent intervals illustrated a significant leftward shift in both variables in null mice compared with controls (p < 0.05; Kolmogorov-Smirnov test) (Fig. 6C,D). In other words, deletion of Kv1.1 produced smaller and more frequent sEPSCs.

Spontaneous EPSCs in control and null mice. A, Representative tracings of sEPSCs from a control (left) and null (right) NTS cell. Five current sweeps are shown for each mouse group. Note the increased frequency of sEPSCs in null mice. The cell was voltage clamped at -60 mV. Calibration: 50 pA, 50 ms. B, Frequency histogram of sEPSC amplitude in control (top) and null (bottom) mice. Bin width is 2 pA. C, D, Cumulative (Cum.) probability distributions of sEPSC amplitude (2 pA bin) (C) and interevent interval (10 ms bin) (D) reveal a shift to the left (smaller amplitudes, increased frequency) in null mice compared with controls.
Previous investigators have demonstrated that Kv1.1-null mice (or mice after toxin blockade of Kv1.1) exhibit increased spontaneous IPSCs (Southan and Robertson, 1998; Zhang et al., 1999). Based on these observations, sEPSC amplitude in null mice may be reduced because of an increase in inhibitory shunting. Application of 10 μm bicuculline did not alter sEPSCs amplitude in control mice (22.6 ± 3.7 to 21.9 ± 4.5 pA with bicuculline; p > 0.05; paired t test) or null mice (17.6 ± 1.3 to 17.5 ± 1.1 pA; p > 0.05; paired t test), suggesting inhibitory shunting did not occur in null mice.
Because deletion of Kv1.1 significantly increased the frequency of sEPSCs in the NTS of null mice, we hypothesized blockade of Kv1.1 with toxin K in wild-type NTS slices would result in a comparable augmentation of activity. As shown in Figure 7, A and B, bath application of toxin K (200 nm; 5 min) increased the frequency of spontaneous events in control mice. The cumulative probability of events of four cells demonstrated toxin K primarily shortened the interevent interval of EPSCs (Fig. 7D) (n = 4 cells; p < 0.05; Kolmogorov-Smirnov test) with a smaller reduction on EPSC amplitude. The weak effect of toxin K on sEPSC amplitude may be attributable to the acute (minutes) effect of Kv1.1 blockade versus chronic deletion. Toxin K did not alter spontaneous events in three cells from null mice (Fig. 7F) (p > 0.05; Kolmogorov-Smirnov test). These results confirm that Kv1.1 modulates spontaneous neuronal activity in the NTS.
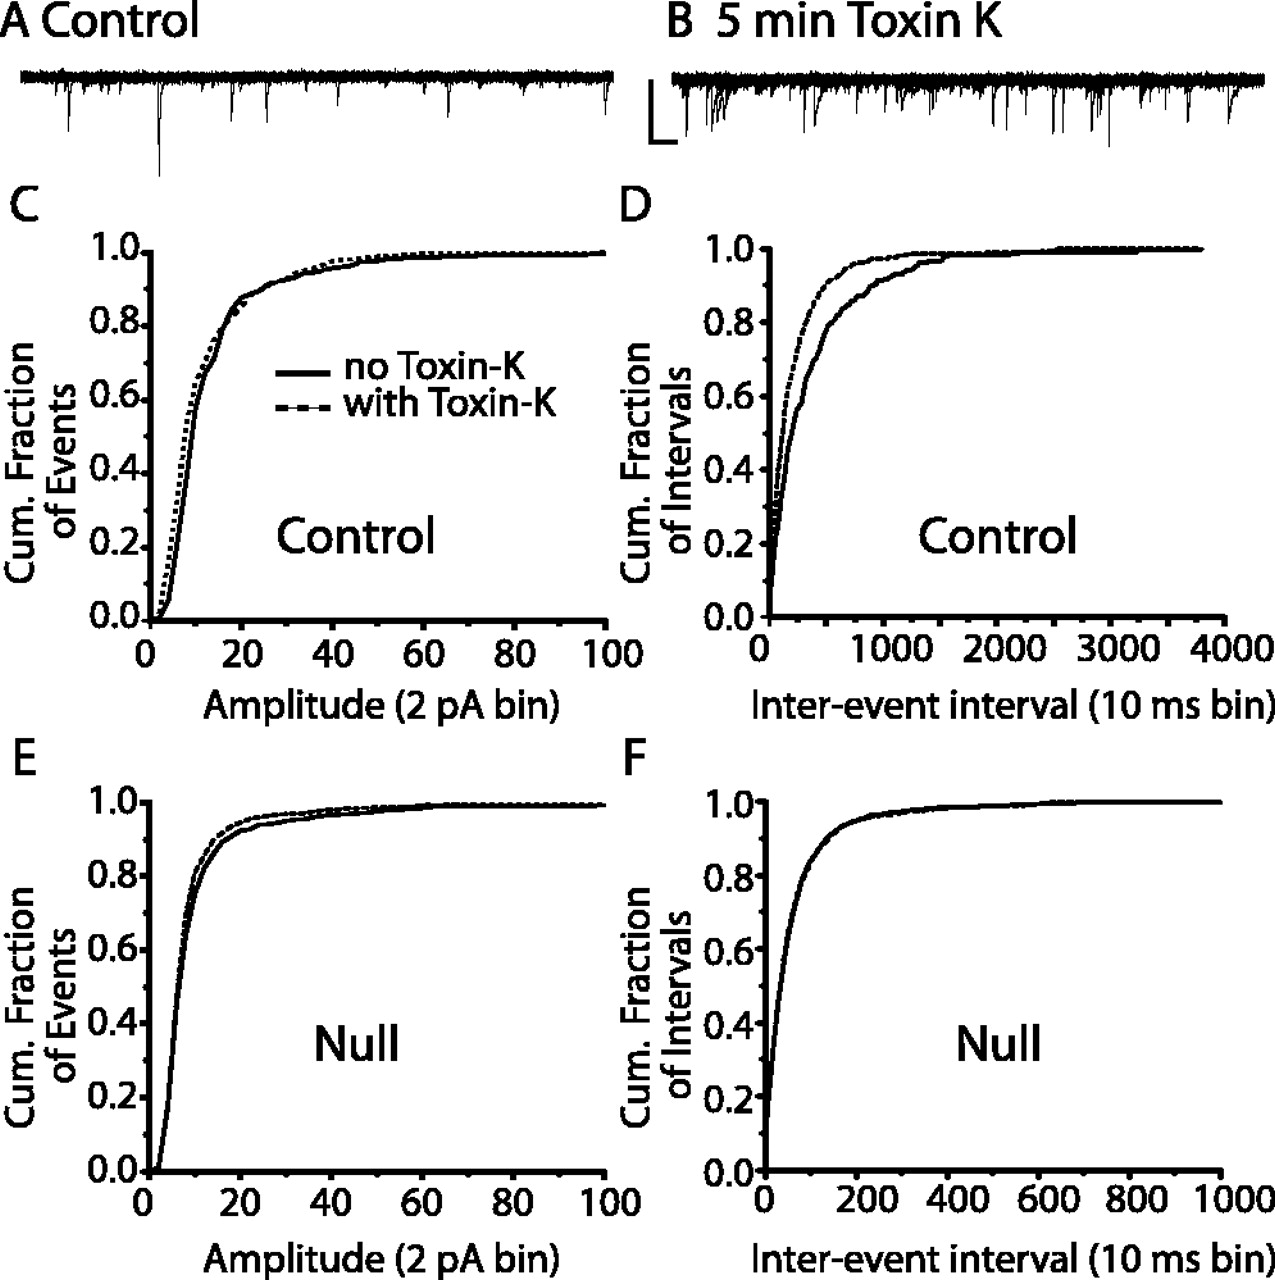
Toxin K increases spontaneous EPSCs in control mice. A, B, Representative tracings of sEPSCs in the absence (A) and presence (B) of toxin K (200 nm). Note the increased number of events after toxin application. The cell was voltage clamped at -60 mV. Examples are the overlay of six current traces. Calibration: 50 pA, 50 ms. C-F, Cumulative (Cum.) probability plots of spontaneous EPSC amplitude (C, E) and interevent interval (D, F) in the absence (solid line) and presence (dashed line) of toxin K. Control mice are plotted in graphs C and D, and null mice in E and F. Note toxin K primarily increased the frequency of events in control mice but not in null mice.
Role of Kv1.1 in mEPSCs within the NTS
mEPSCs represent the random, action potential-independent release of neurotransmitter and provide information about possible changes in the presynaptic release process. To separate activity-dependent from activity-independent release, we recorded mEPSCs in the presence of the Na+ channel blocker TTX (1 μm). An example of spontaneous miniature activity in a control and null mouse is shown in Figure 8A. Kv1.1 deletion increased the frequency of events from 3.1 ± 0.6 Hz (control mice; n = 10 cells) to 6.9 ± 2.5 Hz (null mice; n = 7 cells). Plotting the cumulative interevent intervals of mEPSCs demonstrated a significant leftward shift in null mice, or more frequent miniature events (p < 0.05; Kolmogorov-Smirnov test) (Fig. 8D). The amplitude distribution and mean were comparable between control and null mice (mean amplitude for controls, 11.3 ± 1.6 pA, vs null, 14.5 ± 3.4 pA; p > 0.05; t test) (Fig. 8B,C). Rise time (10-90%; control, 1.35 ± 0.14 ms, vs null, 1.28 ± 0.13 ms) and decay times (10-90%; control, 3.94 ± 0.70 ms, vs null, 3.49 ± 0.56 ms) were similar in both groups of mice, suggesting postsynaptic receptor sensitivity was not changed in null mice. Results from spontaneous and miniature events suggest an increase in terminal excitability.

Miniature EPSCs in control and null mice. A, Representative tracings of mEPSCs from a control (left) and null (right) mouse NTS cell. Ten current sweeps are shown for each mouse group. Note the increased frequency of mEPSCs in null mice. The cell was voltage clamped at -60 mV. Calibration: 50 pA, 50 ms. B, Frequency histogram of mEPSC amplitude in control (top) and null (bottom) mice. Bin width is 2 pA. C, The cumulative (Cum.) probability of mEPSC amplitudes (2 pA bin) illustrates a comparable distribution in null and control mice. D, The cumulative probability of mEPSC interevent interval distribution (10 ms bin) revealed a significant shift to the left (increased frequency) in null mice.
Role of Kv1.1 in asynchronous neurotransmitter release
Stimulus trains have been shown to induce asynchronous transmitter release attributed to presynaptic mechanisms. We hypothesized that, if the absence of Kv1.1 enhances afferent activity as suggested above, then null mice would exhibit synaptic hyperexcitability during and after a train of events at a frequency within the physiological range of chemoreceptor afferents (∼1-20 Hz). We examined evoked EPSCs (eEPSCs) and spontaneous EPSCs before and after a 20 Hz stimulus train.
In control mice, before the stimulus train, there was minimal spontaneous activity (Fig. 9A). TS stimulation (20 Hz; 30 events) resulted in eEPSCs of varying amplitudes including some failures. During and after this train, spontaneous events minimally increased. A single TS stimulation 4 s after the train did not significantly alter the evoked EPSC amplitude when compared with the first EPSC of the 20 Hz train. In contrast to control slices, null slices (Fig. 9B) faithfully produced EPSCs during the 30 episodes evoked at 20 Hz. Spontaneous, asynchronous EPSCs (aEPSCs) dramatically increased during the train and remained elevated during and after the stimulus. Four seconds after the train, TS stimulation resulted in an eEPSC that was considerably greater than the first eEPSC of the train.

Asynchronous release is increased in Kv1.1-null mice. Representation of EPSCs before, during, and after 20 Hz (30 episodes) TS stimulation in control (A) and null (B) mice. The examples shown are overlays of four current sweeps. Cells were voltage clamped at -60 mV. In A and B, an asterisk (*) denotes the 350 ms window in which spontaneous events were counted. Note the increased aEPSCs during and after the stimulus train in null mice compared with controls. Four seconds after the repetitive episodes, when spontaneous activity had returned to prestimulus levels, TS stimulation enhanced eEPSCs in null mouse (B) but not in control (A) slices.
Averaged data from Figure 9 are presented below. In five cells from control animals, the number of spontaneous events 350 ms before and 350 ms after the stimulus train did not change (2.2 ± 0.3 before vs 2.7 ± 0.5 after; p > 0.05; paired t test). The amplitude of evoked EPSCs also did not change between the first event of the train and the one evoked 4 s after the train (1.8 ± 7.3% change; p > 0.05; paired t test). However, in null mice (n = 7 cells), the number of spontaneous events 350 ms before versus after the stimulus train significantly increased (2.5 ± 0.6 before vs 10.8 ± 2.2 after; 481 ± 176% change; p < 0.05; paired t test). The amplitude of the evoked EPSC elicited 4 s after the train was also significantly augmented (47.8 ± 18.3% change; p < 0.05; paired t test). The enhancement of asynchronous EPSCs in null mice after the stimulus train, as well as the augmentation of evoked EPSCs after this train, confirms a greater excitability of sensory afferents in null mice compared with controls.
Discussion
In the present study, we examined the role of Kv1.1 in the afferent pathway of the carotid body chemoreflex. In the carotid body, Kv1.1 was distributed to the oxygen-sensing glomus cells and sensory nerve fibers. Within the NTS, Kv1.1 localized to solitary tract axons. Deletion of Kv1.1 enhanced the respiratory response to hypoxia which was primarily attributed to the following: (1) an increase in carotid body afferent activity during hypoxia that was greater in null mice and (2) a decrease in failures in response to evoked activity and an increase in spontaneous and asynchronous EPSCs in the secondary relay neurons in the NTS of the null mice. These findings illustrate the importance of Kv1.1 in the afferent limb of chemosensory reflex and its subsequent control of respiration.
Deletion of Kv1.1 enhances the respiratory response to hypoxia
Compared with control mice, null mice have a greater HVR but a similar HCVR. Although Kv1.1 could modulate respiration in any respiratory-related nuclei, it is generally believed that the HVR is attributable to the carotid body, whereas the HCVR is from central chemoreceptor activation (Bisgard and Neubauer, 1995), although a number of pathways may be similar in the CNS. Nonetheless, the comparable HCVR suggests Kv1.1 does not significantly modulate central chemoreceptor activity, respiratory motor nuclei, or the pathway(s) between the two, although additional studies are required to confirm such a statement. Accordingly, because null mice primarily exhibit alterations in the HVR, we examined the role of Kv1.1 in the chemosensory afferent pathway.
Kv1.1 deletion increases chemosensory activity
We observed Kv1.1 in the O2-sensitive glomus cells where it has been suggested K+ channels may act as an O2 sensor to initiate cell depolarization during hypoxia, modulate endogenous spiking activity, or regulate membrane potential (Prabhakar, 2000; Perez-Garcia et al., 2004). Although we did not examine the O2 sensitivity of this current, the continued presence of a hypoxic response in null mice suggests that Kv1.1 is not the primary O2 sensor. Kv1.1 is most likely behaving as a typical delayed-rectifier channel that is activated during the hypoxia-induced depolarization of membrane potential, ultimately opposing the depolarization. Deletion of Kv1.1 would allow greater membrane depolarization during hypoxia, or alter action potential behavior that has been observed in some glomus cells (Buckler and Vaughan-Jones, 1994), and result in more neurotransmitter being released and enhanced chemoafferent activity.
Lack of Kv1.1 may also increase the excitability of afferent terminals that receive synapses from glomus cells. Kv1.1 was identified in afferent chemosensory fibers and their cell bodies in the petrosal ganglia. In the rat, the majority of carotid sinus fibers are unmyelinated C-fibers (McDonald, 1983), and data from the mouse indicate the same (Donnelly and Rigual, 2000). In C-type sensory neurons, blockade of α-DTX-sensitive currents (Kv1.1, -1.2, -1.6) increased the number and frequency of action potentials in response to depolarization (Stansfeld et al., 1986; Glazebrook et al., 2002). Similar results were obtained in petrosal neurons in the presence of α-DTX and toxin K (Fig. 4). This suggests that an increase in the excitability of chemosensory C-type terminals contributes to the increased chemosensory activity in null mice. Kv1.1-null mice have been shown to exhibit increased excitability in two other sensory systems, nociceptive signaling (Clark and Tempel, 1998) and the auditory pathway (Brew et al., 2003).
Absence of Kv1.1 increases excitability of presynaptic sensory terminal regions in the NTS
Chemosensory axons terminate in the caudal NTS (Finley and Katz, 1992). In the NTS, postsynaptic IK is important in synaptic integration and regulating action potential frequency (Dekin and Getting, 1987; Bailey et al., 2002). Previous evidence for a functional role of Kv1.1 in the NTS comes from studies showing that microinjection of DTX into the NTS alters the baroreceptor and cardiopulmonary reflexes in the intact animal (Butcher and Paton, 1998). We identified Kv1.1 in nerve fibers of the TS and at nerve terminal regions, but seldom in NTS neurons, indicating that Kv1.1 is primarily presynaptic in the NTS. The Kv1.1 immunofluorescence that did not colocalize with synaptophysin may represent channels concentrated at the axonal terminal, as was observed in the calyx of Held (Dodson et al., 2003), or at axonal branch points (see below).
We observed equivalent EPSCs at 0.5 Hz between control and null mice consistent with reports in which synaptic transmission was not altered after DTX application in the medial nucleus of the trapezoid body (Brew and Forsythe, 1995) or in cerebellar slices of Kv1.1-null mice (Zhang et al., 1999). Measurements of evoked synaptic transmission, including TS activation of synaptic currents at higher frequencies and paired-pulse ratios, revealed responses in null mice in the direction that would tend to promote excitability but that were not significantly different from control. This is not surprising in view of the small effect on action potential duration produced by block of the α-DTX-sensitive current shown previously (Glazebrook et al., 2002) and the toxin K-sensitive Kv1.1 current shown here.
Null mice exhibit a dramatic increase in sEPSCs and mEPSCs in NTS relay neurons. Moreover, the increase in sEPSC frequency in control slices, and lack of this in null mice, in response to toxin K confirms these results. The primary source of the spontaneous synaptic currents is, presumably, the sensory afferent terminals; however, axons of NTS interneurons and those originating from outside the NTS region may also play a role (Fortin and Champagnat, 1993). After α-DTX application in other studies, there is an increase in spontaneous acetylcholine release in the neuromuscular junction (Anderson and Harvey, 1998) and frequency of IPSCs in the cerebellum (Southan and Robertson, 1998). An increase in IPSCs is also observed in cerebellar slices of Kv1.1-null mice (Zhang et al., 1999). If the membrane potential in the terminal lies, or at least fluctuates, in the activation range for Kv1.1 (between -60 and -40 mV) (Coetzee et al., 1999; Glazebrook et al., 2002), deletion of Kv1.1 would allow greater depolarizing fluctuations in the potential in the terminal region and increased probability of calcium entry and spontaneous transmitter release. In null mice, the increased sEPSCs and mEPSCs compounded with augmented afferent activity would render postsynaptic cells more likely to produce activity to be transmitted onward to the respiratory motoneurons. The augmentation of spontaneous action potentials at resting potential in null mice confirms this notion.
The increased EPSC activity is further enhanced during and after a 20 Hz stimulus train, in which null mice exhibited more asynchronous EPSCs compared with controls. Asynchronous release is dependent on residual calcium in the nerve terminal and is important for the continuation of synaptic signaling during frequency-dependent depression of evoked activity (Lu and Trussell, 2000; Otsu et al., 2004). Our results are in agreement with previous work (Hagler and Goda, 2001) in cultured hippocampal neurons, in which tetraethylammonium (1 mm; a concentration that blocks Kv1.1) elevated aEPSCs. The increased asynchronous activity in null mice also enhanced the amplitude of eEPSCs seconds after the train. Similar synaptic properties were observed in the chick nucleus magnocellularis (Lu and Trussell, 2000). The augmented aEPSCs in nulls may increase information transfer across the synapse for a longer amount of time, producing a smoother, more robust physiological response to a hypoxic environment. These aEPSCs and increased eEPSCs would ultimately contribute to the greater HVR in null mice.
In the NTS, afferent axons extensively branch to form daughter branches before forming presynaptic terminals (Felder and Mifflin, 1993). The role of Kv channels at these branch points is of interest, because axonal branching may lower action potential propagation safety by inducing either conduction failures, or differentially conducting activity down a daughter branch to a presynaptic terminal (Chiu et al., 1999). Modeling and experimental data suggest accumulation of K+ in the extracellular space of branch points increases conduction failures (Zhou and Chiu, 2001). Although we cannot determine whether Kv1.1 in the NTS is at branch points, if it is, then deletion of it should increase the reliability of information transfer to the postsynaptic cell (i.e., an evoked EPSC). The observation that null mice have reduced failure rates supports this idea. Thus, Kv1.1 may also influence ventilation by dependably increasing action potential conduction down branch points and terminal beds to faithfully activate respiratory relay neurons.
In conclusion, we demonstrate Kv1.1 channel subunits are integral to the respiratory response during hypoxia through their role in modulating afferent chemosensory activity. The increase in EPSCs in the secondary neurons in the NTS of null mice predicts an additional role for Kv1.1 at sensory presynaptic terminal regions. Whether a similar augmentation in the respiratory chemoreflex occurs in EA-1 patients is an interesting, yet-unexplored, question.
Footnotes
This work was supported by National Institutes of Health Grants HL-25830 and HL-61436. D.D.K. is a Parker B. Francis Fellow in Pulmonary Research.
Correspondence should be addressed to Dr. David D. Kline, Rammelkamp Center for Education and Research, MetroHealth Medical System, Case Western Reserve University, 2500 MetroHealth Drive, Cleveland, OH 44109-1998. E-mail: david.kline{at}case.edu.
Copyright © 2005 Society for Neuroscience 0270-6474/05/253389-11$15.00/0


