

Article Figures & Data
Figures
- Figure 6.
Sustained somatic depolarizations originate in basal dendrites. A, Composite microphotograph of a layer V pyramidal cell injected with the voltage-sensitive dye JPW3028. The schematic drawing indicates the position of the glutamate-filled pipette (160 μm from the center of the soma). T-dend., Target dendrite, the dendrite exposed to glutamate pulse. B, An area indicated by the rectangle in A is captured by an 80 × 80 pixel acquisition camera. The boxes mark four ROIs where optical signals were selected for spatial averaging and display. C, A characteristic electrical signal, composed of two APs superimposed with the somatic plateau potential (PP) was evoked with a single glutamate pulse (duration, 5 ms; Ig = 1.8 μA). Voltage-sensitive dye recordings obtained simultaneously from four ROIs (ROIs 1-4) are aligned with the whole-cell somatic recording (ROI 0). The double-headed arrow indicates the half-width of the plateau depolarization. D, Same as in C, except a negative current pulse (hyper.) was injected into the cell body to suppress firing. glut., Glutamate.
- Figure 8.
Correlation between dendritic and somatic depolarization amplitudes. A, Composite fluorescent image of a layer V pyramidal cell (80 × 80 pixels). The schematic drawing indicates the position of the glutamate-filled pipette (90 μm from the center of the soma). B, Whole-cell recordings from the cell body (ROI 0) are aligned with voltage-sensitive dye recordings obtained from the glutamate stimulation site (ROI 1). Sixteen pixels are spatially averaged in the area marked with the rectangle in A. The vertical dashed line marks the timing of the glutamate pulse (duration, 5 ms; intensity varied from 0.8 to 1.4 μA). TTX, 1 μm. C, The plot of signal amplitudes measured in the cell body (in millivolts; white circles) and in the dendrite [in percentage (ΔF/F); black circles]. glut., Glutamate; T-den., target dendrite.
- Figure 2.
input-output function of basal dendrites-somatic whole cell. A, A coronal slice cut from the rat medial prefrontal cortex was illuminated simultaneously with infrared and excitation light to show the position of the rhodamine-filled neuron with respect to the pia. B, An area indicated by the rectangle in A is increased to show morphological details of the basal dendritic tree. C, An area indicated by the rectangle in B is increased to show the segment of the basal dendrite (85 μm away from the soma) where a glutamate-filled glass pipette (schematic drawing) was positioned during the recordings shown in D. D, The tip of glutamate iontophoretic pipette was kept in a fixed position, whereas the intensity of the glutamate current (Ig) was increased gradually from 0 to 1.6 μA in increments of 0.1 μA and from 1.8 to 4.6 μA in increments of 0.2 μA. Fourteen of 32 steps are displayed. In this and the following figures, “glut.” marks the timing of the glutamate pulse (duration, 5 ms). Left inset, Eleven successive sweeps (glutamate current intensities, 0.6-1.6 μA) are superimposed to show the transition between the subthreshold (sweep 4; Ig = 0.9 μA) and suprathreshold (red sweep 5; Ig = 1.0 μA) stimuli. Right inset, Plateau amplitude was measured as a difference between the peak depolarization after the last AP in the burst and at the baseline (amp.). In trials in which the neuron did not generate any APs (e.g., sweeps 3 and 4), the amplitude of the peak depolarization was plottedin E. Duration of the plateau depolarization was measured at 50% of plateau amplitude (dur.). Vertical scaling applies for all traces in D, including those in the insets. The horizontal calibration bar in the left inset is 100 ms. The somatic response to glutamate stimulation was analyzed in terms of plateau amplitude (E), plateau duration (F), and number of APs per plateau event (G).
- Figure 3.
Regenerative properties of glutamate-evoked plateau potentials. A, A glutamate (glut.)-filled pipette was positioned on a basal dendrite (75 μm from the center of the soma), as indicated in the schematic drawing (inset). Trace 0, Current-clamp recording of the evoked UP state. Traces 1-5, While keeping the intensity (1.5 μA) and duration (5 ms) of the iontophoretic current pulse fixed between trials, the recording configuration was changed to voltage clamp. Glutamate-evoked postsynaptic currents were recorded at different command potentials (from -58 to -88 mV, in steps of 2 mV). Five of 16 voltage-clamp sweeps are selected for display (traces 1-5). The arrow marks an initial spikelet that precedes the plateau phase. B, Three characteristic traces are selected from A and superimposed on a faster time scale to show (1) the voltage-dependent change in the duration of the evoked spike (traces -58 and -80), (2) the residual (foot) current component (-82), and (3) an abrupt transition between -80 and -82 mV. C, The absolute amplitude of the plateau phase of the glutamate-evoked inward current is plotted versus the command potential, for the experiment shown in A. D, A plot of mean normalized amplitudes obtained in eight neurons. The command potential at which the step-like transition occurred is plotted as a zero (0 mV). Other command potentials in the corresponding data set are shifted accordingly. All data points, within a neuron, are first normalized with respect to the amplitude of inward current at the transition point (arrowhead) and then averaged across neurons. E, Same as in D, except instead of amplitude we plotted the duration (half-width) of the spike. The values are normalized with respect to the longest duration in each data set. The error bars in D and E are SDs (n = 8). norm., Normalized.
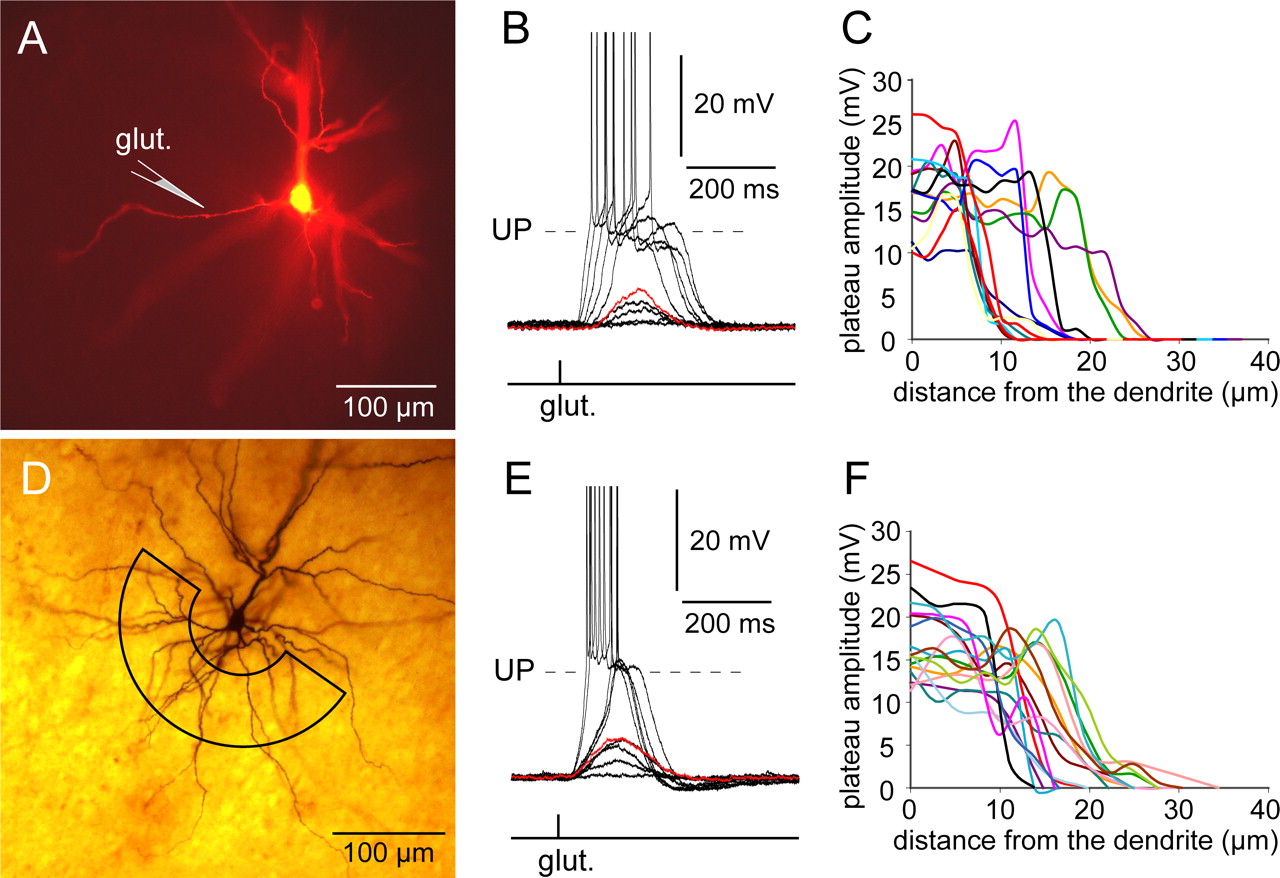
- Figure 1.
Spatial considerations of glutamate microiontophoresis. A, Microphotograph of a rhodamine-filled layer V pyramidal cell. The schematic drawing marks the position of the glutamate pipette 90 μm from the center of the soma, ∼5 μm from the dendritic shaft. B, While keeping the stimulus parameters fixed (intensity, duration, and frequency), the glutamate pipette was withdrawn diagonally away from the basal dendrite in equal steps (3 μm). At each stop, glutamate was iontophoretically ejected and the neuronal response was recorded by a whole-cell pipette. At a distance of 15 μm from the dendrite, a previously suprathreshold glutamate pulse was no longer capable of triggering the UP state (red trace). C, The amplitude of the plateau depolarization is plotted versus the distance between the tip of the glutamate iontophoresis pipette and the dendritic shaft. At a distance of ≥27 μm, a previously suprathreshold glutamate pulse failed to evoke a detectable response (flat recording) in 12 of 12 neurons tested. D, Microphotograph of 1 of 21 biocytin-stained layer V pyramidal neurons obtained in experiments in which glutamate electrodes were positioned blindly (sniffing for dendrites). The black semicircular box marks the area around the cell body (70-120 μm away from the center of the soma) in which glutamate stimulation sites were located. E, A stimulation site found 50 μm below the surface of the slice, 85 μm from the center of the soma. Glutamate ejections (1.6 μA, 5 ms) invariably produced UP states at 1 Hz stimulation frequency (data not shown). The tip of the glutamate pipette was then pulled away diagonally from the original stimulation site in increments of 3 μm, while the intensity and the duration of the iontophoretic current were kept unchanged. At 15 μm from the “optimal” stimulation site, a previously suprathreshold amount of injected glutamate now failed to trigger an UP state (red trace). At a distance of 27 μm, glutamate pulses did not produce a detectable response (flat recording). F, The plot of the amplitude of glutamate-evoked plateau versus the distance from the dendrite, obtained in 16 neurons. glut., Glutamate.
- Figure 4.
Effects of the sodium channel blocker TTX on glutamate-evoked plateau depolarizations. A, Composite microphotograph of a layer V pyramidal cell stained with rhodamine. The schematic drawing marks the position of the glutamate pipette 90 μm from the soma. B, Whole-cell recordings of glutamate-evoked somatic depolarizations in control (normal ACSF) and TTX solution (1 μm). c.i., Current injection (200 pA, 250 ms); glut., iontophoretic ejection of glutamate (Ig = 2.0 μA; duration, 5 ms; frequency, 1 Hz). C, One section from B is displayed at a faster time scale to show the characteristics of the plateau phase. D, Average percentage of change in the amplitude and duration of the somatic plateau depolarization (n = 14). ctrl., Control. The error bars are SDs.
- Figure 5.
Correlation between dendritic and somatic depolarization envelopes. A, Composite microphotograph of a layer V pyramidal neuron injected with the voltage-sensitive dye JPW1114. The schematic drawing indicates the position of the glutamate-filled sharp pipette 155 μm from the cell body (glut.). B, Optical signals from the target dendrite (black trace) and nontarget dendrite (gray trace) are superimposed with the whole-cell somatic recording (soma). In this and following figures, the amplitude of the optical signal is expressed as ΔF/F (%). C, Same as in B, but arbitrary scaling of signal amplitude to show (1) that the depolarization wave in the target dendrite precedes the one in the soma and (2) that the membrane potential change in the nontarget dendrite has dynamics similar to those of the somatic signal. D, Left, Mean plateau duration (half-width) recorded simultaneously in the target dendrite and the soma after suprathreshold glutamate stimulation. Right, For each of the 21 neurons tested, the ratio of dendritic and somatic half-widths (dendrite/soma) was calculated and expressed as a percentage (%). The mean dendrite/soma ratio and SD are displayed in the form of a bar diagram (n = 21).Error bars represent SDs. T-dend., Target dendrite; NT-dend., nontarget dendrite.
- Figure 7.
Saturation of the dendritic membrane potential. A, Composite microphotograph of a layer V pyramidal cell stained with JPW1114. The schematic drawing indicates the position of the glutamate-filled pipette (110 μm from the center of the soma). B, An area indicated by the rectangle in A is captured by an 80 × 80 pixel acquisition camera. The boxes mark two ROIs (ROIs 1 and 2) where optical signals were selected for spatial averaging and display. Each box encompasses 16 pixels. C, The intensity of the glutamate iontophoretic current was increased from 1.6 to 2.2 μA in increments of 0.2, whereas membrane potential changes were recorded optically from the target dendrite (ROI 1) and nontarget dendrite (ROI 2; gray trace) and also electrically from the soma (ROI 0). The concentration of TTX is 1 μm. D, The same data as in C, except somatic whole-cell (top) and dendritic optical (bottom) recordings from four subsequent trials are superimposed to show a gradual increase in the duration of the plateau depolarization in response to a gradual increase in the amount of exogenous glutamate presented to the basal dendrite. E, The same sweep as in C is displayed at a faster time scale to show that glutamate-evoked depolarization in the target dendrite (ROI 1) precedes the signal obtained from the soma (ROI 0) and nontarget branch (ROI 2; gray trace) by 5 ms (measured at 50% plateau amplitude). glut., Glutamate.


Tables
- Table 1.
All pyramidal cell types in the rat prefrontal cortex generate the plateau potentials after single glutamate pulses delivered on their basal dendrites
Intrinsic bursting Intermediate Regular spiking Oscillatory bursting n % Vr (mV) n % Vr (mV) n % Vr (mV) n % Vr (mV) Layer V 20 62.5 59.8 ± 3.7 7 21.9 61.4 ± 6.1 5 15.6 58.1 ± 2.7 0 0.0 Layer II/III 7 58.3 64.3 ± 4.9 2 16.7 68.0 ± 1.4 2 16.7 63.1 ± 2.6 1 8.3 68 -
n, Number of cells; %, percentage of the total sample; Vr, resting membrane potential (mean ± SD).
-
Supplemental data
Files in this Data Supplement:
- supplemental material - Supplemental Figure S1. Plateau potentials in different pyramidal cell types Electrophysiological profiles of visually identified pyramidal neurons were determined (Column A) before single glutamate pulses (arrowhead) were delivered on basal dendrites using the �sniffing� method (Column B). The distance from the tip of the glutamate stimulation pipette to the center of the cell body, as well as the intensity of the glutamate iontophoretic current are displayed in boxes. All neurons in this figure were patched in Layer V except the oscillatory bursting neuron (panel d) which was found in Layer II/III. Arrow marks a characteristic depolarizing afterpotential (DAP).
- supplemental material - Supplemental Figure S2. Input-output function of basal dendrites (group data). Glutamate pulses, of gradually growing intensity, were delivered on visually identified basal dendrites (70-100 ?m away from the cell body, mean=80.5+7.6 ?m, n=15) and somatic plateau depolarizations were recorded in current clamp, as described in Fig. 2D. Absolute values of plateau amplitude (A), plateau duration (C), and number of action potentials per plateau (D), were plotted against the intensity of the glutamate iontophoretic current, for each neuron. In panel B, the mean plateau amplitude was calculated for each stimulation intensity, across 15 data sets obtained in 15 neurons.
- supplemental material - Supplemental Figure S3. Temporal relation between dendritic and somatic plateau depolarizations. Same data as in Fig. 5B, was temporally filtered (low-pass Gaussian, 25 Hz cut-off, high-pass Butterworth, 0.4 Hz) and superimposed with unfiltered whole-cell recording (5 kHz). Red trace - optical signal from the target dendrite (filtered). Blue trace - whole cell somatic recording (filtered). Black trace � whole cell somatic recording (unfiltered). Inset: A part of the figure is blown up to show that the front of dendritic depolarization precedes the somatic signal by 8.5 ms, measured at 50% plateau amplitude.


