

Article Figures & Data
Figures
- Figure 1.
Probabilistic monetary-incentive delay-task trial structure.
- Figure 2.
Group maps of regions whose activation correlates with the linear model of expected value. Warm colors signify activation, whereas cool colors signify deactivation (threshold, p < 10-5). A, Anterior; L, left.
- Figure 3.
Group maps of contrasts related to distinct terms of expected value. Maps illustrate the interaction of VAL by MAG(V), the main effect of PRB (P), and the interaction of VAL by MAG by PRB (EV). Warm colors signify activation, whereas cool colors signify deactivation (threshold, p < 10-5). A, Anterior; R, right.
- Figure 4.
Peak percentage signal change by gain trial type for right VOIs. Bars represent means ± SEM (n = 14). Trial alignment (left to right) reflects expected value (low to high). Symbols indicate significant difference from the low (+, >$0.00) and middle (++, >$1.00 and >$0.00) magnitude incentive conditions, matched for valence and probability (within-subject pairwise comparisons; p < 0.005, corrected for 9 comparisons). ACing, Anterior cingulate. Error bars represent SEM.
- Figure 5.
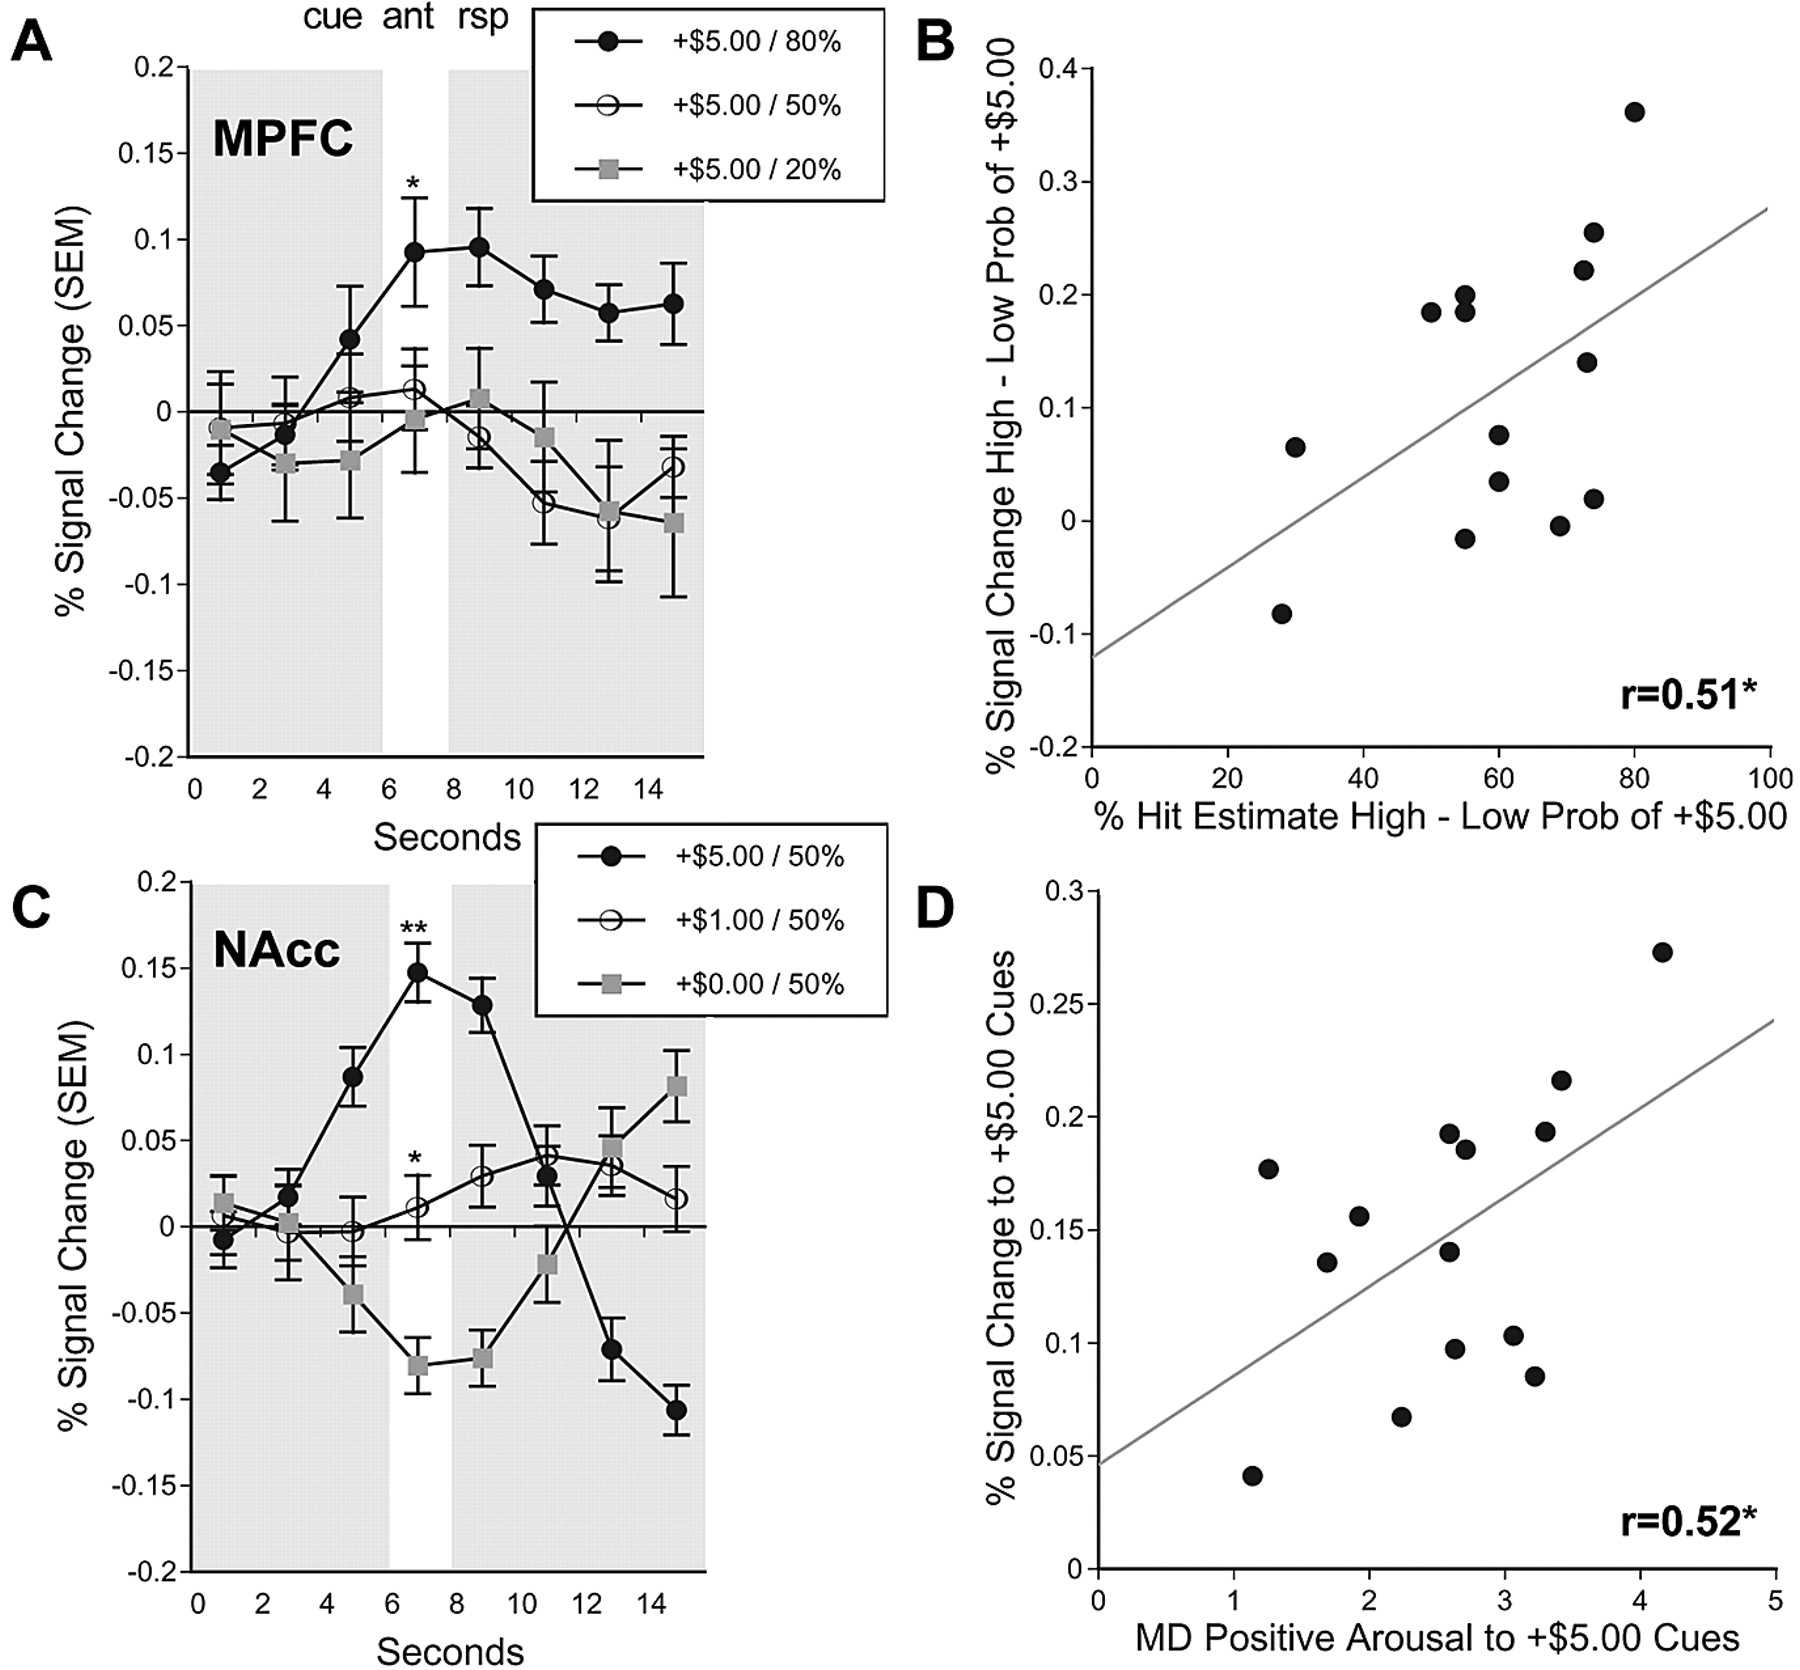
VOI time courses and functional correlations. A, Activation time courses taken from the right MPFC VOI for +$5.00 gain trials of varying probabilities (*, 80 vs 20% probability of success; p < 0.05; two-tailed t test). B, Correlation of percentage hit estimate for high- versus low-probability trials with percentage signal change in the right MPFC VOI for high- versus low-probability +$5.00 gain trials (lag, 4 s; r = 0.51; p < 0.05; one-tailed). C, Activation time courses taken from the right NAcc VOI for gain trials of varying magnitudes (**, +$5.00 vs +$1.00 and +$0.00; *, $1.00 vs $0.00; p < 0.05; two-tailed t test). D, Correlation of self-reported positive arousal in response to +$5.00 cues with percentage signal change in the right NAcc VOI in response to +$5.00 cues (lag, 4 s; r = 0.52; p < 0.05; one-tailed). ant, Anticipation; rsp, response; Prob, probability; MD, mean-deviated. Error bars represent SEM.


