

Article Figures & Data
Figures
- Figure 1.
Intrinsic bursting properties of neonatal CA3 pyramidal neurons. A, In a cell that was quiescent at resting Vm (-76 mV, 0 pA), a slowly increasing positive current (to +9 pA) induces a depolarization that becomes regenerative and triggers spike bursts followed by a sAHP. At a higher current level (+24 pA), the frequency of bursts is enhanced and the amplitude of the slow Vm oscillations (dotted line) decreases, whereas the spike threshold within bursts stays approximately constant (top dotted line). Inset, Typical burst (spikes truncated). Recording was done in the presence of 10 μm NBQX, 40 μm d,l-AP-5, and 100 μm picrotoxin. B, Scatter plot of the mean frequency of bursts as a function of Vm, taken from the negative peak value of the sAHP. C, CV of interburst intervals versus mean frequency of bursts (B, C; data from various levels of injected current from a total of 10 cells). Note the stabilization of interburst intervals at frequencies greater than ∼0.2 Hz. D, Specimen trace of a cell-attached recording of spontaneous bursts in the absence of drugs. E, ISI histogram from the recording in D. In this and other similar plots (see Figs. 2F-H, 6B), the vertical arrow shows the modus of the distribution that provides an estimate of the preferred bursting frequency (0.33 Hz).
- Figure 2.
Temporal relationships between unit activity and GDPs. A, Two simultaneous fp recordings (fp 1 and fp 2; ∼200 μm apart) under control conditions show synchronous activity associated with slow, negative fp shifts (fGDPs) and unit asynchronous bursts (asterisk) (see Results). B, Cross-correlation histograms of slow, negative fp shifts and unit spikes (bin, 10 ms; 56 fGDPs) obtained from fp 1 and fp 2 recordings of the experiment shown in A. C, Cumulative cross-correlation histograms of individual fp recordings (n = 8) and simultaneous fp and cell-attached (n = 6) recordings. D, Intracellular recording showing intrinsic bursts and an intracellular GDP (arrow). Note that in the given recording, the intrinsic bursts and GDPs can be distinguished by eye, but this is not always the case. E, Two simultaneous fp recordings (bandpass, 1-600 Hz) under control conditions show fGDPs (arrows), which are seen at both recording sites, and unit asynchronous bursts detected only at either site. A concentration of 10 μm NBQX and 40 μm d,l-AP-5 blocks fGDP, but unit bursting is still observed. F, Histogram of fGDP intervals (n = 14 recordings; n = 668 fGDPs; bin, 0.5 s). G, ISI histogram of asynchronous spikes (n = 696 spikes from 5 fp and 3 cell-attached recordings). H, ISI histogram of unit activity in NBQX plus AP-5 ([K+]o = 3-5 mm) obtained from four fp recordings (n = 724 spikes). The bin width is 0.5 s, and the first bar related to intraburst spike intervals is truncated in the histograms in G and H. Arrows in F-H indicate preferred frequency.
- Figure 3.
Influence of enhanced tonic excitation on network rhythmicity. A1, fp recording showing an increase in fGDP frequency induced by isoguvacine (isog.; 0.5-1 μm; [K+]o constant at 5 mm; bandpass, 0.1-5 Hz). A2, fGDP interval histograms from the experiment shown in A1. B1, fp recording with fGDPs at varying levels of [K+]o (bandpass, 0.1-40 Hz). B2, Corresponding fGDP interval histograms (101 fGDPs under each condition; bin width, 0.25-2 s). C, Scatter plot showing mean fGDP frequency versus [K+]o from 15 experiments with 56 recordings at different [K+]o and mean fGDP frequency versus [isoguvacine] from four experiments with 14 recordings at different isoguvacine concentrations. D, Scatter plot of the CV of fGDP intervals versus mean frequency from the same experiments as in C.
- Figure 4.
Rhythmic activity of interneurons at the preferred fGDP frequency is entrained by glutamatergic neurons. A, Simultaneous voltage-clamp recordings (0 mV; low-chloride filling solution) and fp recordings in 7 mm [K+]o show bursts of sGABA-PSCs associated with fGDPs and the effect of NBQX and AP-5. The same fp recording is shown at two different bandwidths to illustrate the slow, negative fp shifts (fGDPs) and the associated fp spikes. Note the presence of unit fp bursts and the absence of fGDPs in the presence of the drugs.B, Cross-correlation histograms of sGABA-PSCs versus fGDPs (black line) obtained from seven voltage-clamp recordings and unit spikes versus fGDPs (gray line) based on data from eight fp and six cell-attached recordings. Zero time of x-axis is set at half-maximum of fGDP (see Materials and Methods). C, D, Autocorrelation histograms of sGABA-PSC intervals and their power spectra (black line) in the absence (C1, C2) and presence (D1, D2) of the blockers. The gray lines indicate the surrogate mean (C, D), and the dotted gray lines indicate ±2 SDs (C2, D2).
- Figure 5.
Tonic and phasic GABA actions on immature CA3 pyramidal neurons. A, Voltage-clamp recording (0 mV; low-chloride filling solution) showing a bicuculline-sensitive (10 μm) tonic current (low-pass, 100 Hz). B, All-point histogram computed from the recording in A. The bins encircled with the dotted line were not used for Gaussian fits to reduce the influence of sGABA-PSCs on the estimate of the tonic current (see Materials and Methods). C, Superimposed specimen traces in control and with bicuculline. The dotted lines indicate the level of mean tonic current obtained from all-point histograms of the kind shown in B. The area between the dotted lines represents charge transfer conveyed by the tonic current component, whereas the shaded area reflects the total bicuculline-sensitive charge transfer. D, Voltage-clamp recording under control conditions and in the presence of SR 95331. E, Bar graphs showing the inhibition of tonic current by different concentrations (micromolar) of GABAA antagonists. bic, Bicuculline; SR, SR 95331.
- Figure 6.
Endogenous GABA facilitates unit-bursting activity. A, Simultaneous fp recordings (fp 1 and fp 2; bandpass, 1-600 Hz) in the presence of AP-5 and NBQX showing units bursts that are blocked by picrotoxin. Thereafter, bursts were re-induced by elevating [K+]o in 1 mm steps to 8 mm to reach the threshold for spike activity in the presence of the blockers. B, ISI histogram obtained at a minimum level of elevated [K+]o that induced unit bursting (preferred frequency, 0.21 Hz) in the presence ionotropic glutamatergic and GABAergic antagonists (pooled data from 5 fp recordings; n = 503 spikes). C, Gramicidin perforated-patch recording under control conditions and with the addition of 10 μm bicuculline. Spikes are truncated.
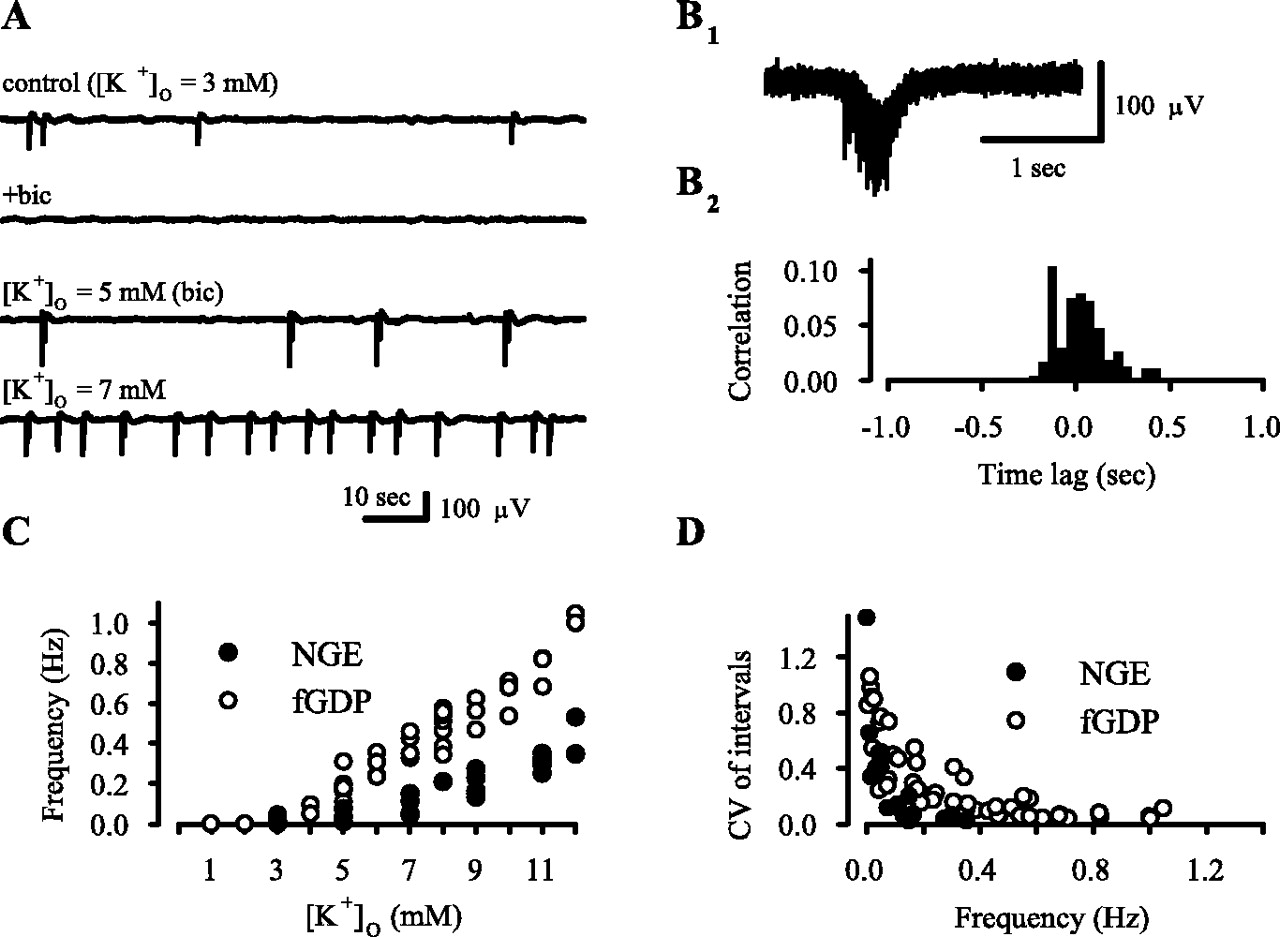
- Figure 7.
Endogenous GABA facilitates network activity. A, fp recording showing a blockade of fGDPs by 10 μm bicuculline (bic). A subsequent elevation of [K+]o induces a recovery of synchronous population activity in the complete absence of GABAA transmission (NGEs; bandpass, 0.2-15 Hz; see Results). B1, fp recording showing a single NGE ([K+]o = 7 mm). B2, Cross-correlation histogram of spikes versus slow, negative fp shifts obtained from four recordings. C, Scatter plot showing mean NGE frequency versus [K+]o(•) from eight experiments with 22 recordings at different [K+]o. To facilitate comparison, data from the corresponding plot related to fGDPs from Figure 3C is also shown (○; from 15 experiments with 56 recordings at different [K+]o). D, Scatter plot of the CV of NGE intervals versus mean frequency (•) from the same eight experiments as in C. Corresponding data from Figure 3D related to fGDPs is also shown (○).
- Figure 8.
Tonic GABA action in the absence of interneuronal input enhances fGDPs. A, Voltage-clamp recording (0 mV; low-chloride filling solution) under control conditions, with the addition of 3 μm SR 95531, with a subsequent addition of isoguvacine (10 μm), and finally with the addition of picrotoxin. B, Traces of an fp recording under similar conditions as in A (bandpass, 0.2-15 Hz). SR, SR 95531; isog., isoguvacine.


