

Abstract
Human sound localization results primarily from the processing of binaural differences in sound level and arrival time for locations in the horizontal plane (azimuth) and of spectral shape cues generated by the head and pinnae for positions in the vertical plane (elevation). The latter mechanism incorporates two processing stages: a spectral-to-spatial mapping stage and a binaural weighting stage that determines the contribution of each ear to perceived elevation as function of sound azimuth. We demonstrated recently that binaural pinna molds virtually abolish the ability to localize sound-source elevation, but, after several weeks, subjects regained normal localization performance. It is not clear which processing stage underlies this remarkable plasticity, because the auditory system could have learned the new spectral cues separately for each ear (spatial-mapping adaptation) or for one ear only, while extending its contribution into the contralateral hemifield (binaural-weighting adaptation). To dissociate these possibilities, we applied a long-term monaural spectral perturbation in 13 subjects. Our results show that, in eight experiments, listeners learned to localize accurately with new spectral cues that differed substantially from those provided by their own ears. Interestingly, five subjects, whose spectral cues were not sufficiently perturbed, never yielded stable localization performance. Our findings indicate that the analysis of spectral cues may involve a correlation process between the sensory input and a stored spectral representation of the subject's ears and that learning acts predominantly at a spectral-to-spatial mapping level rather than at the level of binaural weighting.
Introduction
From the basilar membrane up to the cortex, the auditory system is tonotopically, rather than spatially, organized. As a result, sound localization relies on implicit cues in the sound-pressure wave (Blauert, 1997). Head size and resulting acoustic shadow impose interaural differences in sound-arrival time and level that relate to locations in the horizontal plane (azimuth) (Blauert, 1997). In addition, the pinnae distort the high-frequency sound spectrum, yielding spectral-shape filters that vary uniquely with locations in the horizontal and vertical plane (elevation) (Oldfield and Parker, 1984a; Wightman and Kistler, 1989; Middlebrooks and Green, 1991; Middlebrooks, 1992; Blauert, 1997). It is generally thought that independent binaural and monaural neural pathways process the different localization cues (Oldfield and Parker, 1986; Yin, 2002; Young and Davis, 2002).
Data suggest that correct azimuth localization can only be achieved through binaural hearing, because the unilaterally deaf (Van Wanrooij and Van Opstal, 2004), listeners exposed to ear plugging (Oldfield and Parker, 1984b), or dichotically simulated monaural hearing (Wightman and Kistler, 1997) are very poor in azimuthal localization. Some monaurally deaf listeners, however, can localize elevation with their normal ear (Slattery and Middlebrooks, 1994; Van Wanrooij and Van Opstal, 2004). Although spectral shape constitutes a monaural localization cue, studies have shown that perceived elevation is partly attributable to binaural interactions, in which the contribution of each ear is weighted by stimulus laterality (Fig. 1A,B). For example, monaural pinna occlusion causes elevation deficits, not only on the side of the perturbed ear, but also well into its contralateral hemifield (Oldfield and Parker, 1984b; Humanski and Butler, 1988; Morimoto, 2001; Hofman and Van Opstal, 2003).
The complex relationship between pinna geometry and spectral-shape cues, together with the fact that human ears change size and shape throughout life, suggest that adaptive mechanisms in the auditory system should preserve calibration of sound-source elevation. Indeed, a study in which binaural molds perturbed the spectral-shape cues demonstrated that listeners relearned localization within a few weeks (Hofman et al., 1998). Interestingly, listeners learned the new spectral cues without interfering with the original ones, because they could localize with both their own and with occluded ears.
As outlined in Figure 1, A and B, this remarkable adaptive response can in principle be explained by two different mechanisms. First, the auditory system could have learned new spectral representations, separate for each ear (adaptation at a spectral-to-spatial mapping stage). Alternatively, the binaural weighting could have been adjusted such that one ear dominates both ipsilateral and contralateral space. To dissociate these possibilities, we investigated sound-localization behavior after adaptation to a unilateral mold (FM listening) under four different hearing conditions: normal-ear listening (FF), a unilateral mold left or right (MF, or FM), and listening with binaural molds (MM) (Fig. 1C). Because the normal mappings are not lost, no effect on FF or MF performance would be expected. The performance in the FM case improves on the mold side because of the adaptation for both stages in either scheme. Adjustments at the spatial mapping stage of either scheme in Figure 1, A and B predicts that localization on the adapted side remains accurate under MM listening. In contrast, changes at the binaural weighting stage preclude accurate MM localization, because the increased weighting of the left ear is then based on unknown spectra. Our results demonstrate that the system can cope with monaural spectral perturbations and that plasticity acts predominantly at the spectral-to-spatial mapping stage.

Rationale. A, B, Conceptually, elevation processing consists of two stages (Hofman and Van Opstal, 2003): a spectral-to-spatial mapping stage and a binaural-weighting stage (W) that combines information from both ears. Because both processes are nonlinear, the order in which they occur matters, and adaptation at either stage leads to different predictions for our control experiments. In scheme A binaural weighting acts on monaural elevation estimates, whereas in scheme B it combines spectral shape inputs from the ears into binaural spectral shapes. HRTF, Head-related transfer functions. C, Prediction of elevation performance on the adapted side after complete right-ear mold (FM) adaptation for four different hearing conditions, if adaptation occurred at either the spatial mapping stage (left) or the binaural-weighting stage (right) of either scheme. In the latter case, the contribution of the nonperturbed, left ear has increased and accounts for improved performance on its contralateral, right side. Consequently, an additional mold in the left ear (MM hearing) abolishes elevation performance on the right (right panel). If adaptation occurred at the spatial-mapping stage, MM hearing will not affect localization on the adapted side (left panel). Contra, Contralateral; Ipsi, ipsilateral.
Materials and Methods
Participants
Eleven listeners (ages 21-47 years) participated in the experiments. Three participants (JO, JV, and MW) are from the laboratory and are experienced with sound localization studies. Two of these listeners (JO and MW, the authors) each participated in two adaptation series with different molds that were conducted 2 years apart. The other eight listeners were naive paid volunteers and were given a short practice session to localize sounds with head movements under open-loop conditions (i.e., no feedback was given to the actual performance of the listener), before entering these experiments. All listeners had normal hearing [within 20 dB sound pressure level (SPL) of audiometric zero] as determined by an audiogram obtained with a standard staircase procedure (10 tone pips, 0.5 octave separation, between 500 Hz and 11.3 kHz). None of them had any auditory or uncorrected visual disorder, except for listener JO, who is amblyopic in his right eye.
Apparatus
During the experiments, the listener was seated comfortably in a chair in the center of a completely dark, sound-attenuated room (height × width × length, 2.45 × 2.45 × 3.5 m3). The walls, ceiling, and floor and every large object present were covered with black acoustic foam that eliminated echoes for sound frequencies >500 Hz. The room had an ambient background noise level of 25 dB SPL.
A total of 58 small broad-range loudspeakers (MSP-30; Monacor International, Bremen, Germany) containing light-emitting diodes (LEDs), were mounted on a thin wooden frame that formed a hemispheric surface 100 cm in front of the listener at six eccentricities, R = (0, 15, 30, 45, 60, 75°), relative to the straight-ahead viewing direction [defined in polar coordinates as (R, Φ) = (0, 0°)] and at 12 different directions, Φ= (0, 30,..., 330°), where Φ= 0° is rightward from the center location, and Φ= 90° is upward (for a simple illustration of the stimulus layout, see gray background in Figs. 2, 12 A, B, 13). The lower three speakers [at R = 75° and Φ= (240, 270, 300°)] were left out to create room for the listener's legs.
Head movements were recorded with the magnetic search-coil induction technique (Robinson, 1963). To that end, the listener wore a light-weight (150 g) “helmet” consisting of two perpendicular 4-cm-wide straps that could be adjusted to fit around the listener's head without interfering with the ears. On top of this helmet, a small coil was attached. From the left side of the helmet, a 40-cm-long, thin aluminum rod protruded forward with a dim (0.15 cd/m2) red LED attached to its end, which could be positioned in front of the listener's eyes. Two orthogonal pairs of 2.45 × 2.45 m2 coils and one pair of 2.45 × 3.5 m2 coils were attached to the edges of the room to generate the left-right (60 kHz), up-down (80 kHz), and front-back (F-B) (40 kHz) magnetic fields. The head-coil signal was amplified and demodulated (Remmel Labs, Ashland, MA), after which it was low-pass filtered at 150 Hz (model 3343; Krohn-Hite, Brockton, MA) before being stored on hard disk at a sampling rate of 500 Hz/channel for off-line analysis.
Auditory stimuli
Acoustic stimuli were digitally generated using Tucker-Davis Technologies (TDT) (Alachua, FL) System II hardware, with a TDT DA1 16-bit digital-to-analog converter (50 kHz sampling rate). A TDT PA4 programmable attenuator controlled sound level, after which the stimuli were passed to the TDT HB6 buffer and finally to one of the speakers in the experimental room.
All acoustic stimuli consisted of Gaussian noise and had 0.5 ms sinesquared onset and offset ramps. The auditory stimuli were either broadband (BB) (flat characteristic between 1 and 20 kHz) or high-pass (HP) (high-pass filtered at 3 kHz) stimuli with a duration of 150 ms. Sound intensities ranged from 30 to 60 dB SPL (see below). Absolute free-field sound levels were measured at the position of the listener's head with a calibrated sound amplifier and microphone (BK2610/BK4144; Bruel & Kjaer, Norcross, GA).
Molds
Listeners participated in a long-term adaptation experiment, which required them to wear a lightweight and precisely fitting custom-made mold in the concha cavity of either their left or right pinna for an extended period of time. The molds were manufactured by filling the concha with rubber casting material (Otoform Otoplastik-K/c; Dreve, Unna, Germany). Molds for both ears were produced, because control experiments were run with a mold in either ear (see below). The ear canals were kept free, and, before its hardening, the material could be easily shaped in situ to exactly fit the pinna cavity.
Measurements of directional transfer functions
Directional transfer functions (DTFs) of the ears with and without the molds were measured to verify that the ear with the mold still received specific elevation-dependent spectral features for six listeners (see Fig. 5, Table 1) for 25 elevations in the midsagittal plane (compare with Fig. 5). This was done by presenting a minimum-peak broadband frequency-modulated sweep (0.2-20 kHz, flat-amplitude spectrum, Schröder phase, 20 ms duration, 25 sweep repetitions per stimulus, of which the first and the last sweep had an onset and offset ramp, respectively) (Schröder, 1970; Wightman and Kistler, 1989; Hofman and Van Opstal, 1998) and recording the sound-pressure level through a thin silicone tube attached to a miniature microphone (model EA1842; Knowles, Itasca, IL) at the entrance of the subject's ear canal.
Subject database
DTFs and their correlations
From the measured frequency-modulated Schröder-sweep responses at the ear-canal entrance, we applied a fast Fourier transform (FFT) on the sound-pressure signal, averaged across 23 sweeps (excluding the first and last sweep that contained the onset and offset ramps) with the speaker at each of the 25 elevations. From the FFT, we then determined the amplitude spectrum of the signal for each elevation angle. The DTF for, say, elevation ϵ0, was obtained by dividing each amplitude spectrum by the grand average across all 25 elevations:  (1)
(1)
with N being the number of elevation angles (in our experiments, N = 25) (see Fig. 5). Each DTF contained 512 frequency bins (from 0 Hz to 25 kHz at 48.8 Hz intervals). For graphical purposes, the DTFs were smoothed by a simple Gaussian filter with a constant Q-factor of 8.
To determine a quantitative measure for the resemblance between different DTFs, we only incorporated the frequency bins between 4 and 20 kHz, because, in this frequency domain, the head-related transfer functions contain most of the directional information. In this way, each DTF could be considered as a 328-dimensional vector, for which we computed the correlations with other DTF vectors. For two different sets of 25 DTFs (e.g., left ear vs right ear, or the free right ear vs the same ear with a mold), this procedure results in a 25 × 25 correlation matrix, C(ϵ1,ϵ2), in which each entry contains the correlation between the DTF from the first set at elevation ϵ1, with the DTF from the second set at elevation ϵ2 (see Fig. 5C,F). Note that this matrix is not symmetric when computed for different DTF sets, i.e., in general C(ϵ1,ϵ2) ≠ C(ϵ2,ϵ1). Also, the maximum correlation is not necessarily found on the main diagonal (i.e., at ϵ1 = ϵ2).
The autocorrelation matrix of a DTF set is symmetric and measures how well the DTFs of a given set discriminate the different elevation angles. A typical ear yields a correlation of 1.0 only on the main diagonal, indicating that the DTF for a given elevation is unique (Hofman and Van Opstal, 1998).
DTF similarity index
To quantify with one scalar the overall similarity of the sets of DTFs from the free ear and the ear with the mold, we constructed a similarity index, Isim, in the following way: first, for a given elevation angle, ϵm, the SD in the correlation coefficients, C(ϵm,ϵf) for this mold DTF with all free-ear DTFs was computed (σm). The similarity index was then taken as the average SD for all mold DTFs: 
for N = 25 elevation angles. For example, if the mold and the free-ear DTFs have a high correlation along the diagonal and low correlations for off-diagonal angles (see Fig. 5F), there will be a high SD. Consequently, Isim is high. When mold and free-ear DTFs do not correlate well for any position (see Fig. 5C), the SDs, σm, and the resulting Isim will be low.
Paradigms
Calibration experiment. Head-position data for the calibration procedure were obtained by instructing the listener to make an accurate head movement while redirecting the dim rod LED in front of the eyes from the central fixation LED to each of the 57 peripheral LEDs that was illuminated as soon as the fixation point extinguished. Each experimental session started with a calibration run.
Auditory localization. The listener started a trial by fixating the central LED with the head-fixed LED pointer. After a pseudorandom period of 1.5-2.0 s, this fixation LED disappeared and an auditory stimulus was presented 400 ms later. The listener was asked to redirect the head by pointing the dim rod LED as accurately and as fast as possible to the perceived location of the sound stimulus. Because the response reaction times typically exceeded 200 ms, all responses were made under open-loop conditions.
Hearing conditions
Before the adaptation period, acute sound localization experiments were run under four different hearing conditions. In the FF condition, both ears were free from spectral manipulations and had normal hearing. In the MM condition, both ears received a mold. In the FM condition, the listener wore the mold (right or left ear) that would also be used during the adaptation period; in the MF condition, a mold was applied to the other ear only (left or right) (Hofman and Van Opstal, 2003). Conditions were changed between experimental runs with the participant in complete darkness, so that he/she received no visual feedback to sounds made, e.g., by the experimenter when entering or leaving the room.
In the adaptation condition, the participant moved and acted in his normal living environment, with the unilateral mold continuously in either the right (10 adaptation experiments in eight subjects) or left (three series in three subjects) ear (Table 1). Sound localization performance with the mold was repeatedly tested during this adaptation period (on a daily basis, excluding weekends and holidays). The mold was worn by most listeners for at least 11 d (Table 1), except for listeners JO and RK, whose experiments were terminated as soon as they reached stable performance. Listeners JO1, MW1, and MW consented to wear the mold for longer periods (>22 d).
Listeners either improved and reached a stable performance level or did not improve during their adaptation period (see Results). After this adaptation period, the listeners were again tested for the four different hearing conditions.
The stimuli during the experimental runs were BB noise at 40, 50, and 60 dB SPL (one complete run consisted of 3 stimulus intensities × 57 locations = 171 targets, randomized across trails). During the pre-adaptation and post-adaptation experiments, all conditions were tested each in two runs in 1 d (thus, listeners made 4 conditions × 2 runs × 171 targets = 1368 responses, both on the pre-adaptation and the post-adaptation experimental day). During the adaptation period, the daily experiments consisted of three consecutive runs (1 FM condition × 3 runs × 171 targets = 513 responses). In the analysis, although lower stimulus intensities elicited slightly worse localization performance, all intensities were pooled to obtain more robust parameter estimates for the regression lines.
Two listeners (JO1 and MW1) participated also in an earlier adaptation series in which the localization responses were made to HP and BB noise stimuli with levels of 30, 40, and 50 dB SPL (one run consisted of 2 spectral bandwidths × 3 intensities × 57 locations = 342 targets, randomized across trials, presented once in each session). Their molds differed for the two adaptation series, and these two series were separated by >2 years. The responses to HP and BB stimuli were pooled in the data analysis, because they did not differ significantly.
Participants will be referred to by their initials; MW1 and JO1 will be used for listeners MW and JO in their first adaptation series.
Front-back reversals and confusions
Several listeners reported F-B confusions and F-B reversals with the mold in situ, especially during the early stages of adaptation. In those cases, stimuli presented ipsilateral to the mold were sometimes (in case of an F-B confusion) or consistently (in case of a reversal) localized at a rear location on the same side. To avoid having the subject make large (and inaccurate) head movements toward these rear locations, we instead instructed the subject to indicate the occurrence of such F-B reversals by a button press and to generate a head movement toward the location in the frontal hemifield that was mirrored with respect to the coronal plane through the two ears.
Data analysis
Data calibration. The calibration experiment provided a set of 58 LED/speaker locations and raw head-position signals. These locations were defined in a double-pole coordinate system (Knudsen and Konishi, 1979). In this system, azimuth, α, is defined as the angle between the sound source (or response direction), the center of the head, and the midsagittal plane. Elevation, ϵ, is defined as the angle between the sound source, the center of the head, and the horizontal plane. The origin of the (α, ϵ) coordinate system corresponds to the straight-ahead speaker location. Azimuth and elevation can be calculated from the polar coordinates, (R, Φ), as follows:  (2)
(2)
These 58 fixation points and raw head-position signals were used to train two three-layer neural networks that served to calibrate the head-movement data, using a backpropagation algorithm based on the gradient descent method of Levenberg-Marquardt (Matlab; MathWorks, Natick, MA).
The networks corrected for small inhomogeneities in the magnetic fields and could adequately cope with minor cross-talk between channels. The trained networks were subsequently used to map the raw data to calibrated two-dimensional head positions with an absolute accuracy within 4% over the entire response range. For illustrative purposes, stimulus and response coordinates were sometimes plotted in polar coordinates (see Figs. 2, 12 A, B, 13). However, in the analysis, these coordinates were always transformed into the double-pole azimuth-elevation coordinates.
Head-movement detection. Saccadic head movements were detected from the calibrated head-movement signals by setting thresholds to the vectorial head velocity for onset and offset, respectively, using a custom-made program (onset velocity, 20°/s; offset velocity, 15°/s). Detection markings from the program were shown to the experimenter without revealing any stimulus information and could be adjusted manually when deemed necessary.

Acute effect of monaural mold. A, Localization responses of listener RK in the normal-hearing (FF) condition (open triangles, pooled stimulus intensities). Light-gray dots and grid lines represent the target locations in the experimental setup. B, The elevation response distribution in the acute right-ear mold (FM) condition is markedly degraded for most locations. The deficit is largest ipsilateral to the mold and gradually diminishes into the contralateral hemifield. Locations are represented in (R, Φ) coordinates. Open symbols represent responses to targets with Φ= (0, 60, 120, 180, 240, 300°), and filled symbols represent responses to targets of the other spokes, Φ= (30, 90, 150, 210, 270, 330°).
Statistics. Each listener's responses were quantified by determining the optimal linear fit for the following stimulus-response relationships:  (3)
(3)
for the azimuth and the elevation components, respectively, by minimizing the least-squares error (Press et al., 1992). In Equation 3, αR and ϵR are the azimuth and elevation response components, and αT and ϵT are the azimuth and elevation coordinates of the target. Fit parameters, a and c, are the response biases (offsets, in degrees), whereas b and d are the overall response gains (slopes, dimensionless) of the azimuth and elevation response components, respectively. Note that an ideal listener should yield gains of 1.0 and offsets of 0.0°. Also, Pearson's linear correlation coefficient, the residual error (SD around the fitted line), and the mean absolute localization error were calculated.
To account for the strong azimuth dependence of the elevation responses in some of the hearing conditions (see Results), regressions were also performed within restricted regions of azimuth space. By dividing the elevation responses into 30° wide azimuth bins, each shifted in 5° steps (thus, 25° overlap between adjacent bins), we determined the so-called “local elevation gain,” which provides a smooth estimate of the response gain as a function of stimulus azimuth (see Fig. 4) (Zwiers et al., 2003).
The bootstrap method was applied to obtain confidence limits for the optimal fit parameters in the regression analyses. To that end, 100 data sets were generated by randomly selecting (with replacement) data points from the original data set. Bootstrapping thus yielded a set of 100 different fit parameters. The SDs in these parameters were taken as an estimate for the confidence levels of the parameter values obtained in the original data set (Press et al., 1992).
Results
Acute effects of a unilateral spectral perturbation
The application of a mold could change a listener's localization behavior quite drastically. This is illustrated in Figure 2 (listener RK), which compares the hearing condition with both ears free (FF) to acute pre-adaptation right-ear mold (FM) listening. Head movements made toward the auditory broadband stimuli were close to the target in the FF condition, and responses were distributed across the entire hemifield (Fig. 2A). With the mold, however, responses into the right hemifield only covered a small range in elevations, typically near the horizontal plane. Note that even the elevation responses into the left hemifield were limited to a smaller range than without the mold. Thus, in line with previous reports (Morimoto, 2001; Hofman and Van Opstal, 2003), the mold affected localization of sound-source elevation well into the contralateral hemifield, which is a clear indication of a binaural interaction. In contrast, the response azimuth distribution was unaffected across the entire hemifield (Fig. 2B).

Linear regression analysis. A-C, Azimuth localization responses toward broadband stimuli from listener RK in the FF (filled triangles) and the FM (open circles) hearing condition (same data as Fig. 2). Responses are divided in three regions: contralateral to the mold (A, D; α <-20°), central (B, E; -20 < α < 20°), and ipsilateral to the mold (C, F; α > 20°). Thick black lines denote the linear regression lines (Eq. 3) for azimuth (A-C) and elevation (D-F) components in the FF condition, and thick gray lines denote the linear regression lines for responses in the FM condition. Note highly similar responses and regression lines for the azimuth components in the FM and FF condition for all regions, whereas elevation performance clearly depends on stimulus laterality in the FM condition. deg, Degrees.
To quantify the overall response patterns, we performed linear regression on the azimuth (Fig. 3A-C) and elevation (Fig. 3D-F, listener RK) response components (Eq. 3, Materials and Methods). For the azimuth responses, we performed separate linear regressions in three nonoverlapping target regions along the azimuth axis (ipsilateral to the mold, αT > +20°; near the midsagittal plane, -20° < αT < +20°; and contralateral to the mold, αT < -20°). Despite the introduction of a mold, FM sound azimuth localization (Fig. 3A-C, black linew, FF and gray line, FM) remained accurate and was indistinguishable from the FF condition. This holds true for all three regions, even for sound-sources ipsilateral to the mold (Fig. 3C). This underlines the notion that sound-source azimuth is predominantly determined by interaural level and timing differences rather than by spectral cues. The azimuth results for the other listeners were similar (data not shown).
Also for the elevation analysis, we took the same target regions along the azimuth axis. Insertion of a mold had a clear detrimental effect on elevation localization in the region ipsilateral to the mold, as indicated by the regression line with a low gain (Fig. 3F, gray line). The contralateral data (Fig. 3D) were least affected by the mold, because the elevation gain seemed barely affected. However, there is also a clear localization defect of the mold for elevation responses around the midline (Fig. 3E).
To better quantify the systematic azimuth dependence of perceived elevation, we refined the analysis of Figure 3 by determining the local elevation gain (see Materials and Methods). Figure 4 shows the result of this analysis for all subjects (for left-ear molds, the azimuth sign was reversed). For all subjects, the effect of the mold on perceived elevation may be described by a qualitatively similar smooth function of azimuth. However, quantitatively, the subjects appeared to fall into two separate groups, here distinguished by filled gray circles (strong effect of the mold; N = 8) and open squares (a smaller effect of the mold; N = 5).
To check how the observed differences between the two groups of subjects is related to the way in which the mold perturbs the listener's original spectral cues, Figure 5 shows for two listeners the DTFs of the right ear without (Fig. 5A,D) and with (Fig. 5B,E) the mold in situ. The mold of listener JO (top) induced a strong effect on his localization responses, whereas the mold of listener JV had a modest effect on her behavior (Fig. 4). Indeed, a qualitative comparison of the DTFs revealed that the mold had a strong disruptive effect on the spectral patterns in listener JO (Fig. 5A,B) but to a much a lesser extent in listener JV (Fig. 5D,E). The directional transfer functions of JO's right ear (Fig. 5A) show a prominent notch at a frequency near 5.5 kHz for a downward elevation at -50°, which systematically shifts to higher frequencies, until at an upward elevation of +50°, it is found near 9 kHz. Note that this notch was nearly absent in his mold-induced DTFs (Fig. 5B). Because of these differences, the correlation matrix, C(ϵ1,ϵ2), between the two DTF sets is generally low and without much structure (Fig. 5C) (see Materials and Methods). This predicts that localization on the ipsilateral side should indeed be worse in the acute mold condition.
The picture is quite different for listener JV. The notch in her normal right ear runs between 6 and 11 kHz (Fig. 5D), but a qualitatively similar pattern was seen when that ear contained the mold (Fig. 5E). With the mold, the notch was somewhat less pronounced and ran between 6.0 and 8.5 kHz. Despite these differences, there is a strong correlation between the two DTF sets near the main diagonal and a very low correlation for other locations (Fig. 5F). Apparently, the mold only induced a systematic shift of the main spectral notch. This feature may explain the limited effect of the mold on the gain of the elevation responses of this listener, which only showed a shift in bias.
The correlation plots of Figure 5 appeared to provide a good predictor for the behavior of both subjects. The responses (open dots superimposed on the correlation plots) seemed to be predominantly guided by the loci with high DTF correlation, resulting in the downward bias and high gain of listener JV's responses and the downward bias and very poor gain in the responses of listener JO.
To further quantify this effect, we computed the similarity index, Isim, between the mold and ear DTFs for the six subjects from which we obtained complete DTF maps (see Materials and Methods). In Figure 6, we plotted the ipsilateral (i.e., for α > 20°) elevation gain in the pre-adaptation FM condition as a function of Isim. The figure shows that the similarity between the DTF maps of mold and normal ear fully determined the acute localization behavior of listeners with a mold. Molds that induced strongly dissimilar DTFs (Isim low) had a strong degrading effect on elevation performance, whereas molds that produced similar DTFs affected the elevation gain only modestly.

Azimuth-dependent elevation responses in acute FM hearing. The local elevation gain in the FM condition is a smooth function of target azimuth for all 11 listeners (13 experiments). For all listeners, elevation response performance gradually degrades toward ear ipsilateral to the mold (positive azimuth angles) but to a lesser extent for some listeners (open squares) than for others (gray circles). Contra, Contralateral; Ipsi, ipsilateral; deg, degrees.
Conflicting spectral shape cues
The introduction of a single mold changes the spectral cues for one ear, whereas the other ear still provides the normal, unperturbed cues. Because elevation localization also relies on binaural interactions (Morimoto, 2001; Hofman et al., 2003) (Fig. 4), the auditory system should reconcile these two conflicting sets of spectral cues. For the normal FF condition, the spectral-shape cues of both ears are very similar, as illustrated by the DTF correlation map for listener JO in Figure 7A. A high correlation between the left and right ear is found only along the main diagonal, indicating that each elevation angle produces near-identical spectral-shape cues in both ears.
Hofman et al. (1998) imposed new spectral cues on both ears and showed that subjects adapted to this condition within a few weeks. Interestingly, the molds from both ears in that study yielded very similar DTFs (Isim = 0.5). This is illustrated in Figure 7B for subject JO, who also participated as a subject in that study. Although the DTF correlations are not as high as in the FF condition for this subject, both molds in the MM hearing condition produced near-identical spectral cues for similar elevations (Isim = 0.5). Note that the mold DTFs in that study did not correlate well with the subject's ears (data not shown).
The binaural spectral similarity was heavily perturbed when a mold was inserted in one ear only, resulting in low values for the DTF binaural correlation matrix (Isim = 0.3). This is illustrated in Figure 7C for listener JO in the present study. Thus, the unilateral mold introduced a strong conflict between both sets of spectral cues, which may have posed an additional problem for the sound-localization system when it tried to learn the new cues. The question to be studied next is whether interaural similarity of the spectral cues is a necessary factor to guide the learning of elevation localization.
Adaptation to a unilateral mold
After the acute localization tests with the molds, listeners wore one mold continuously for several weeks (for details, see Table 1). Meanwhile, they were subjected to sound localization experiments on an almost daily basis. The mold had a profound effect on elevation performance over time in all listeners, but, based on the response patterns observed, we could distinguish two groups of listeners. Interestingly, the two groups consisted of the same listeners as the ones shown in Figure 4. Figure 8 illustrates these two response modes for two representative listeners for three nonoverlapping spatial sectors. Listener JO gradually improved not only his elevation gain for sounds ipsilateral to the mold (Fig. 8A, light gray lines) but also for sounds near the midsagittal plane and even slightly for sounds on the contralateral side (Fig. 8A, dark gray and black lines, respectively). In contrast, listener JV (Fig. 8B) started with much higher initial gains during application of the mold. The elevation gain on the ipsilateral side was lower than the gain near the midsagittal plane, which in turn was lower than the gain on the contralateral side (Fig. 4). Over time, however, her local elevation gains did not systematically improve but rather appeared to oscillate for all three sectors.
These two different adaptive response patterns were prototypical for the entire group of subjects. One group of seven listeners (eight experiments: DH, JO, and JO1, KA, MW1, RK, SC, and TG) (Fig. 4, gray symbols) gradually adapted to a clearly improved performance. The other group of five listeners (JV, LC, MV, MW, and SW) (Fig. 4, open squares) started out with a high gain that did not show a subsequent clear improvement over time but instead tended to display an oscillatory pattern.
To quantify the gradual change in elevation gain from ipsilateral to contralateral azimuths for the first group of subjects, Figure 9 plots for six of these listeners the “local normalized elevation gain,” GN(α), as a function of both time (abscissa) and azimuth (ordinate), according to the following:  (4)
(4)
where G(α) is the measured local gain at azimuth α, GFM,ipsi the local gain obtained with the pre-adaptation FM experiment for ipsilateral locations (α > 20°), and GFF(α) corresponds to the value obtained for the initial free hearing condition. In this way, GN(α) = 0 (dark blue) when the measured gain equals the gain value obtained in the FM condition on the far ipsilateral side; if GN(α) = 1 (dark red), it equals normal listening. GN(α) was determined by pooling the responses of one experimental run of 171 trials with its two preceding and two succeeding runs to obtain a smooth estimate of the improvement in localization behavior (number of included responses per bin is on average 400; daily tests consisted of three runs) (see Materials and Methods). All listeners started out with a local elevation gain on the far contralateral side that resembled free listening, which indicates that the mold had little effect on these locations. On the far ipsilateral side, the initial localization behavior resembled acute FM listening. All listeners from this group gradually improved their performance over an increasing range of azimuth angles (which is visible as a widening of the dark red zone into ipsilateral space). Toward the end of the experiment (top row of each panel) localization of central sounds approached the FF listening condition. For most listeners, the far ipsilateral (α > 20°) gains remained low, but even there an improvement could often be observed.

Effect of molds on DTFs. A, DTFs of the free right ear of listener JO show a clear and distinct notch (blue) that runs from ∼5 to 9 kHz for elevations between -50 and +50°. B, This notch almost completely disappeared after application of the mold, although a new notch formed above 9 kHz. C, Correlation between the DTFs of the original right-ear and the mold-induced DTFs for listener JO is without much structure. A somewhat increased correlation is found for downward elevations. The superimposed open dots show elevation judgments (ordinate) versus actual elevation (abscissa) during application of the mold: responses have a low gain and a considerable downward bias [regression line (white): gain, 0.20; bias, -10.9°]. D, The free right ear of listener JV also shows a clear notch in her DTFs, starting near 6 kHz, while gradually increasing to ∼11 kHz. E, This notch, although slightly diminished, is still present, although it now runs up to ∼8 kHz. F, The DTFs of free ear and mold for listener JV have a high positive correlation (dark red) just off the main diagonal, in line with the shift of the most prominent notch. Her acute elevation responses (superimposed open dots) appear to be guided by the band of high positive correlation [regression line (white): gain, 0.85; bias, -5.9°). Note also considerable scatter in the responses. Isocorrelation contours at 0.25 intervals. deg, Degrees.

Elevation localization as a function of similarity index. Elevation gain for targets ipsilateral to the mold (α > 20°) in acute pre-adaptation FM listening depends strongly on the overall similarity index, Isim, computed for the DTF maps between the ear and the mold (see Materials and Methods). The higher the Isim, the higher the elevation gain. Data are from six subjects. r2 value, 0.94.
In contrast, the second group of listeners had high initial elevation gains at the start of the experiment, because their mold did not perturb the spectral cues as much as in the first group of subjects (Figs. 4,5). Figure 10 plots the normalized local elevation gain as a function of time, for this group defined as GN(α) = GFM(α)/GFF(α), in the same format as Figure 9. Although the gain of these listeners was not strongly disturbed by the mold (lowest gain value on the ipsilateral side was ∼0.7) (Fig. 10, blue), performance of these listeners still varied systematically from session to session over the entire azimuth range. The behavior of listeners JV and MW (Fig. 10A,B) seemed to follow an oscillatory pattern over time. Also, performance of the other three listeners of this group (Fig. 10C-E) followed a similar pattern, although these listeners did not participate long enough to follow performance for longer than a complete cycle. However, their behavior did seem to oscillate with approximately the same period as the other two listeners.
To quantify this oscillatory behavior, we fitted a sine function through the ipsilateral elevation gains (αT > 20°) in the following way:  (5)
(5)
where G(τ) is the ipsilateral elevation gain at time τ (expressed as number of runs), A is the (dimensionless) amplitude of the oscillation, f is the frequency of the oscillation (in runs-1), and e and g are offsets. The result of a fit through the data of listener JV is shown in Figure 11A. The resemblance of the data to a sine wave is quite striking. The correlation between data and fit turned out to be high for all five listeners for whom this behavioral responses pattern was observed (Fig. 11B). The period, f-1, of the fitted sine waves varied somewhat between listeners but was on average ∼25 runs, which amounts to 6-10 d (Fig. 11C). The amplitude of the oscillations was low (typically, A < 0.09) (Fig. 11D). So, although the molds for these listeners only slightly affected the initial FM localization responses and although no clear adaptive improvement was seen, their performance was consistently affected throughout time and appeared to follow a sinusoidal pattern with a period that had approximately the same duration as obtained for subjects who showed a strong adaptive response.
Front-back reversals
The acute degradation of up-down localization during insertion of a mold (Figs. 2, 3, 4) was not the only localization deficit. Four listeners (in five experiments: DH, JO/JO1, LC, MV) reported consistent F-B reversals (exemplified in Fig. 12A for listener JO, who perceived the largest number of reversals) that were not present during normal FF hearing (see Materials and Methods). The number of F-B reversals, however, decreased drastically during the adaptation period (Fig. 12B), and this effect depended systematically on sound level. Figure 12C shows the percentage of F-B reversals as a function of time for the different stimulus intensities for listener JO. Reversals were fewer and their occurrence decreased faster for the higher stimulus intensities. The other listeners had fewer initial reversals (DH <40%, LC <20%, and MV <2%), and they no longer reported any reversals at the end of the adaptation period.
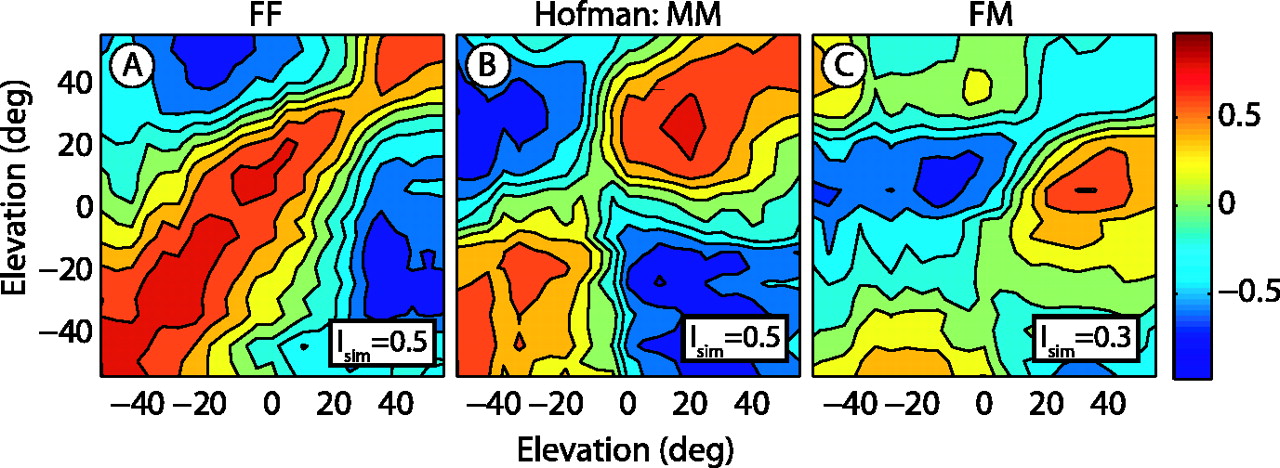
DTF correlation maps between the left and right ear. A, DTFs for the free left and right ears are nearly identical and unique for each elevation angle, which shows as a high positive correlation (dark red) only on the main diagonal and a high similarity index (Isim = 0.5). B, Mold-induced DTFs for left and right ears in the study by Hofman et al.(1998) were also very similar (Isim = 0.5). C, DTFs of the free left ear and right ear with molds from this study, however, are very dissimilar (Isim = 0.3), because no appreciable positive correlation is found on the main diagonal. Data are from listener JO. Same format as Figure 5A. deg, Degrees.
Test of the adaptation models
As explained in Introduction (Fig. 1), adaptation to a monaural spectral perturbation could in principle be attributable to two different mechanisms: either the sound localization system has acquired a new spectral representation of the perturbed ear (adaptation at the spectral-to-spatial mapping stage), or the system ignores the conflicting spectral cues altogether and expands the influence of the intact ear into the contralateral hemifield (adaptation at the binaural-weighting stage). To dissociate these possibilities, we subjected our listeners before and after the adaptation period to four different hearing conditions when making their localization responses: without molds (i.e., both ears free, FF), with one mold in either the right or left ear that was worn during the adaptation period (FM), a single mold in the other, unadapted, ear (MF), and finally, with binaural molds (MM).
If learning had taken place at the binaural-weighting stage (Fig. 1), localization in the MM condition would be impossible, because no unperturbed spectral-shape cues would remain. Conversely, if the auditory system had learned to calibrate the new spectral-shape cues (spatial-mapping stage), after adaptation both the FM and MM condition would show comparable improved localization accuracy on the side of the mold.
Figure 13 shows the raw localization responses of subject JO before (Fig. 13A-D) and after (Fig. 13E-H) adaptation for the four hearing conditions. A comparison between B and F indicates a clear improvement of localization accuracy after the adaptation period for the FM condition. In contrast, the response distributions for the FF and MF conditions did not appear to have changed after FM adaptation. The critical test, however, is provided by the MM condition, for which the response distribution also appeared to have expanded across the azimuth range. Thus, a qualitative assessment of the results for this listener favors adaptation at the level of spectral-to-spatial mapping.
The other adapted listeners showed very similar behavior in the four hearing conditions as listener JO. To pool the results for these listeners, in Figure 14, we plotted the differences in local response gain between the pre-adaptation and post-adaptation localization sessions for each of the four localization conditions. The results are averaged across the seven adapted subjects (N = 8 experiments) and are shown as a function of sound-source azimuth. Our data clearly demonstrate that the FM condition has improved, most prominently on the side ipsilateral to the mold, but even for locations well into the contralateral hemifield (Fig. 14A, dark gray lines). This result implies that sound localization plasticity does not require (near-) identical spectral inputs from the two ears.
Although the pre-adaptation and post-adaptation results for FF and MF hearing were, on average, not identical (the differences, although small, were not zero), there was no systematic azimuth-dependent change in localization performance for these conditions (see Discussion).
More importantly, however, the MM hearing condition showed a clear ipsilateral improvement in localization performance across the azimuth domain. The improvement of the MM condition was quite comparable with the improvement obtained for FM hearing (compare Fig. 14B, dark gray lines, with Fig. 1C). From these data, we conclude that adaptation has taken place at the spectral-to-spatial mapping stage for all listeners.

Two different adaptation responses. Three distinct target azimuth sectors are selected to show the change in elevation gain as a function of time during adaptation for two representative subjects (black line, α < -20°; light gray line, locations ipsilateral to the mold, α > +20°; dark gray line, locations near the midline, -20 < α <+20°). A, Listener JO. Sounds ipsilateral to the mold were initially badly localized (low gain), but, after ∼10 sessions, the elevation gain reached a plateau at a value of 0.6. Also, localization near the midline improved gradually over time. B, No systematic improvement of ipsilateral, central, or contralateral responses was obtained for listener JV. Contra, Contralateral; Ipsi, ipsilateral.
Discussion
Summary
We studied the response of the human sound-localization system to a long-term monaural spectral perturbation and showed that all listeners had clear signs of adaptation. Seven subjects (8 of 13 experiments) regained an improved elevation performance within 11 d (Fig. 9), whereas the elevation gain of five listeners oscillated (Figs. 10, 11). Adaptation to spectral-cue manipulations depended on the correlation of the resulting DTFs with the subject's own ears (Figs. 4, 5, 6) and extended well into the contralateral hemifield. We compared localization responses with the adapting mold (FM hearing) to results under normal hearing conditions (FF), with a mold in the other ear (MF), and with listening with binaural molds (MM). We conclude from our experiments that the human auditory system is capable of an ear-specific spectral adaptation. This plasticity predominantly acts at the stage of neural processing when the spectral-shape cues are transformed into spatial information rather than at the level of binaural interactions (Figs. 1, 14).

Adaptation results for listeners showing improvement. Normalized local elevation gain (color coded; Eq 4) is plotted as a function of target azimuth (ordinate) and time (number runs, abscissa). Dark red color corresponds to normal (FF) localization behavior for the associated bin, and dark blue equals the acute FM behavior for sounds ipsilateral to the mold (i.e., no adaptive change). Listeners DH (A), JO1 (B), KA (C), MW1 (D), RK (E), and SC (F) all adapted gradually to the new spectral cues induced by the mold, because their elevation response behavior gradually improved toward FF behavior within 16 runs. This improvement shows as a gradual expansion of red and yellow bins toward the right. Similar adaptive behavior was obtained for listeners JO (Fig. 8 A) and TG (data not shown). contra, Contralateral; ipsi, ipsilateral; deg, degrees.
Comparison with other studies
Previous studies have reported on the acute effect of a unilateral mold on sound localization and demonstrated a contribution of each ear within its opposite hemifield (Humanski and Butler, 1988; Morimoto, 2001; Hofman and Van Opstal, 2003). Our data further corroborate these findings (Figs. 2, 3, 4), and we used these results to dissociate different adaptive mechanisms.
Hofman et al. (1998) studied sound localization plasticity in response to binaural molds for up to 4 weeks, during which subjects gradually relearned to localize elevation. We extended these experiments in several ways: First, a unilateral mold confronts the system with radically different spectral cues for each ear (Fig. 7C). In the Hofman et al. (1998) study, the thin plastic molds yielded spectral cues that differed substantially from the original cues but remained approximately similar for the two ears (Fig. 7B). Second, to assess binaural interactions, the measurement range was extended to ±75° [vs ±30° in the study by Hofman et al. (1998)]. Finally, by comparing four different hearing conditions, we could dissociate the different models about the locus of adaptation (Fig. 14).

Localization behavior for listeners with high pre-adaptation FM gains. Local elevation gain during FM adaptation (here normalized to the pre-adaptation FF gain, GFM/GFF) as a function of time for the responses of listener JV (A), MW (B), LC (C), MV (D), and SW (E) is shown. Note the oscillatory behavior, with similar periods for all listeners (same scaling in all panels) and the relatively high initial gains (see color bar; dark blue is ∼0.7) (compare with Fig. 9). Contra, Contralateral; Ipsi, ipsilateral; deg, degrees.

Oscillatory behavior. Results of fitting a sine function through the ipsilateral elevation gains (α > 20) for the five listeners of Figure 10 (least squares; Eq. 5). A, Data of listener JV. B, Pearson's correlation between fitted curve and actual data are high for all listeners (mean r = 0.88). C, Fitted periods (1/f) fall between 19 and 29 runs (6-10 d; mean period of 25 runs). D, Fitted amplitudes are low (<0.09) and vary somewhat between listeners (mean of 0.06).
Learning behavior
All subjects showed clear signs of adaptation to the new spectral cues. Seven listeners improved their performance and reached a plateau in their elevation gain within ∼7 d. These subjects did not reach optimal localization performance (Fig. 9), because the far ipsilateral elevation gain remained below FF performance in most subjects. This could be attributable to a lack of sufficient spectral detail in the DTFs of the mold, resulting in a signal-to-noise problem (Good and Gilkey, 1996; Kulkarni and Colburn, 1998), to insufficient training time, to a limit in the capacity of the CNS to interpret altered spectral cues, or to a combination of these factors.

F-B reversals. A, Target locations for which listener JO reported F-B reversals in the first pre-adaptation FM run (171 responses, 3 intensities). Symbol size indicates the number of reversals (from 1 to a maximum of all 3 responses; gray dots indicate that no F-B reversals were reported for the targets). B, F-B reversals in the first post-adaptation FM run. Locations are represented in (R, Φ) coordinates. C, Fraction of F-B reversals as a function of time for different sound levels for this listener. The higher the sound level, the faster the F-B confusions disappeared.
Three listeners kept the mold in situ well after maximal performance was reached. Nevertheless, performance did not improve any further, suggesting that insufficient training time did not underlie imperfect overall performance in our experiments.
Interestingly, although five listeners never reached a stable plateau, their elevation gains oscillated with a period that was comparable with the learning rate of the other seven subjects (Figs. 9, 10, 11).
We interpret this behavior as follows: initially, at the acute pre-adaptation FM test, each subject's responses are based on an interpretation of the normal DTFs, which, because of the high correlation in this group, yielded high elevation gains (Fig. 5, 6). Later, sensory feedback from the environment signals consistent errors between perceived and actual target elevations, which induce a learning response. However, because of the high DTF correlations between the normal ear and the mold, a given DTF always corresponds to two different but relatively nearby and equally strong elevation angles. Apparently, the sound-localization system cannot deal with this ambiguity.
Potential mechanisms
Our results indicate that adaptation to long-term spectral perturbation is ear specific and predominantly acts at the stage of spectral-to-spatial mapping (Fig. 1). The conceptual schemes in Figure 1, A and B, represent the general flow of acoustic processing in the auditory system and offer a functional, rather than anatomical, description of the mechanisms extracting elevation. Our experiments do not allow a firm dissociation of either scheme, because the predictions for the different control experiments are the same (Fig. 1C). However, the distinction is not trivial, because binaural interaction and spectral-to-spatial mapping are both nonlinear (but as yet unknown) processes. Therefore, their order matters, but different experiments are needed to determine the order.
Signals are initially processed monaurally in the cochlear nucleus. Its dorsal part (DCN) has been implicated in the processing of spectral-shape information (Young and Davis, 2002; Reiss and Young, 2005). However, adaptation relies on feedback (Knudsen, 2002), either from vision, head-motion signals from proprioceptive or vestibular sources, or efference copies. There is no evidence that such feedback signals reach the DCN. In contrast, the midbrain inferior colliculus (IC) does receive a signal about eye position (Groh et al., 2001; Zwiers et al., 2004). In barn owls, the external nucleus of the IC receives topographically organized visual inputs from the superior colliculus (SC) that are crucial for the formation of its auditory space map (Brainard and Knudsen, 1993; Gutfreund et al., 2002; Debello and Knudsen, 2004). Convergence of visual and auditory inputs was also demonstrated in the brachium of the ferret IC (Doubell et al., 2000). The presence of different non-acoustic feedback signals in the IC could thus render it as a potential candidate for sound-localization plasticity also in mammals (King et al., 2001; King, 2002).
Other factors
Monaural adaptation to a mold did not induce an aftereffect, because the FF test after removal of the mold immediately yielded accurate behavior in all subjects (Figs. 13, 14). Similarly, Hofman et al. (1998) reported the complete absence of an aftereffect in their binaural adaptation study. However, the FF control condition resulted, on average, in a slightly increased gain for the post-adaptation recordings across the entire azimuth domain (Fig. 14A, light gray lines). Possibly, this effect is caused by a change in the open-loop head-movement strategy of the listeners. Because, during adaptation and over many recording sessions, listeners gradually become more confident in their own localization behavior, they might tend to generate slightly larger vertical head movements. It is difficult to control for such potentially confounding factors, because our experiments involve the complete action-perception cycle.
Similarly, a small negative difference was observed for the MF hearing condition (Fig. 14B, light gray lines). This effect could result from small adjustments at the binaural-weighting stage. If the normal-ear weighting slightly increases during adaptation, the insertion of a mold in that ear should lead to less accurate localization responses as before the adjustments. These relatively small effects notwithstanding, the strong and azimuth-dependent improvement of localization performance in the MM condition was large for all subjects and comparable with the FM improvement. Therefore, adaptation at the spatial-mapping stage remains by far the dominant factor to explain the response behavior across the population of subjects.
Calibration
Studies in the barn owl (Knudsen and Knudsen, 1985; Brainard and Knudsen, 1993) have shown that calibration of its sound-localization system requires visual input. Also in ferret (King et al., 1988), vision guides the formation of a topographic map of auditory space in the midbrain SC. Recent human studies have indicated that the congenitally blind localize well under simple acoustic conditions (Zwiers et al., 2001a) but that their elevation performance breaks down in noisy environments (Zwiers et al., 2001b). Conversely, normal-sighted subjects reduced the local gain of their sound-localization responses after wearing minifying glasses with a restricted visual field (Zwiers et al., 2003). These findings corroborate the hypothesis that, also in humans, vision is used to calibrate, or fine-tune, sound localization in frontal space. Apart from vision, also auditory feedback may aid in the calibration of auditory space. For example, after removing the spectral cues in young ferrets by pinnectomy, the topographic acoustic map in their SC does not develop (Schnupp et al., 1998).

Effect of FM adaptation on localization behavior of listener JO. Raw localization responses are plotted in (R, Φ) coordinates for the various pre-adaptation (A-D) and post-adaptation (E-H) conditions. Note that elevation response distributions for the FF (A, E) and MF (C, G) conditions remain similar, whereas there is a clear improvement for localization in the FM (B, F) and MM (D, H) conditions (compare with Fig. 1C).

Test of adaptation models. Differences in local elevation gain as function of azimuth between pre-adaptation and post-adaptation listening for four different hearing conditions (FF, MM, MF, and FM), pooled across the seven listeners (8 experiments) that showed adaptive improvement (DH, JO and JO1, KA, MW, RK, SC, and TG; see Figs. 8 A, 9). Note the similarity in improvement between the FM (circles) and MM (squares) hearing conditions and the absence of a systematic improvement in the MF (triangles) and FF (diamonds) hearing conditions (compare with Fig. 1C). deg, Degrees.
In our experiments, subjects were free to move around in their usual habitat. Therefore, both active vision and the use of self-generated eye and head movements may have contributed to the adaptive response.
Outlook and applications
Our results indicate that the auditory system can learn to use new spectral cues for a single ear within 10 d, provided that the cues are sufficiently different from the subject's own ear. This has important implications for spatial hearing after surgery that involves the pinna. It should also be considered for potential applications in the field of acoustic virtual reality. Our results further suggest the possibility that monaurally deaf listeners could learn to use their available spectral cues for localization on their deaf side, provided their binaural weighting could learn to favor their intact ear. We recently demonstrated a considerable variability in the localization performance of these listeners that could be fully explained by their using (or lack of using) spectral-shape information (Van Wanrooij and Van Opstal, 2004). Training dedicated to use the spectral cues should therefore be considered to help these listeners to cope with the complexities of the acoustic environment and thereby for their safer navigation through the everyday world.
Footnotes
This work was supported by Radboud University Nijmegen (A.J.V.O., M.M.V.W.) and by Human Frontiers Science Program Grant RG 0174-1998/B (M.M.V.W.). We thank Ger Van Lingen, Hans Kleijnen, Gunther Windau, Huib Versnel, and Ton Van Dreumel for technical assistance and Paul Hofman for valuable suggestions. Wannes Vogels conducted the first experimental series as a graduate student.
Correspondence should be addressed to A. John Van Opstal, Department of Medical Physics and Biophysics, Institute for Neuroscience, Radboud University Nijmegen, Geert Grooteplein 21,6525 EZ Nijmegen, The Netherlands. E-mail: j.vanopstal{at}science.ru.nl.
Copyright © 2005 Society for Neuroscience 0270-6474/05/255413-12$15.00/0


