

Article Figures & Data
Figures
- Figure 1.
The barn owl midbrain sound-localization pathway. A, Schematic diagram of information flow through the midbrian sound-localization pathway. Binaural cues, ITD and ILD, are represented in frequency-specific channels within the ICC. Information is integrated across cue type in the ICCls and across frequency in the ICX. This computation produces a map of auditory space. The map is conveyed from ICX to the deep layers of the OT, in which it merges with a visual map of space. B, Lateral view of owl brain, showing the planes of section used in this study. The plane parallel to the long axis of the tectal lobe is horizontal (D), and the orthogonal plane is coronal (C). C, Sketch of a coronal section through the rostral IC. Arrows indicate the flow of information from one frequency channel (in kilohertz) in the ICCls to the ICX. The projection is highly divergent in the dorsoventral dimension. D, Sketch of a horizontal section through the middle of the IC. Arrows indicate the flow of ITD information (in microseconds) from the ICCls to the ICX, where it is transformed into a spatiotopic map and subsequently conveyed to the OT. d, Dorsal; r, rostral; v, ventral; c, caudal; l, lateral.
- Figure 2.
Optimization of image acquisition and processing. Point spread functions were obtained for subresolution fluorescent beads (0.1 μm diameter) with similar excitation/emission spectra to the fluorophores used in this study (see Table 1). A, Lateral fluorescence spread for point sources with emission peaks (in nanometers) at 515 (green), 580 (red), and 680 (blue). B, Axial extent of fluorescence spread for the same point sources. Insets, Representative examples of images that were used for measuring PSFs. C, Image of a monochromatic supraresolution bead (1μm diameter) before (left) and after (right) deconvolution. D, Image of four multicolor beads before (top) and after (bottom) deconvolution (10 iterations; 99.4% confidence interval). The true physical dimensions of the multicolor beads are shown in E. FWHM, full width at half-maximum. Scale bars: 1 μm. A 60×/1.4 oil-immersion objective was used.
- Figure 3.
CaMKIIα immunoreactivity in the sound-localization pathway. A, Horizontal section reacted with the CaMKIIα antibody and visualized using DAB. The box indicates the field of view shown in C. B, Adjacent section processed identically, except for the omission of the primary antibody. The borders of ICX and ICCls are indicated by dotted lines. V, Ventricle; R, rostral; L, lateral. Scale bar, 600 μm. C, Morphologies of CaMKIIα ICX cells (60× objective). D, Western blot of owl and rat brain homogenates probed with the CaMKIIα antibody. At high resolution, the owl band is clearly resolvable as a doublet and exhibits near identical mobility to the rat band of expected size (∼50 kDa). No other bands were evident.
- Figure 4.
Regional distribution of CaMKIIα, calbindin, and calretinin. Horizontal sections through the IC reacted for calretinin (red), CaMKIIα (green), or calbindin (purple). A-C, Calretinin labeling at a dorsal, mid-dorsoventral, and ventral level through the inferior colliculus, respectively. Intense labeling delineates the ICC core. White line extends 600 μm lateral (l) to the core, corresponding to the boundary between ICCls and ICX. r, rostral. D-F, CaMKIIα labeling in adjacent sections from the same tectal lobe. The medial edge of CaMKIIα labeling closely corresponds with the measured boundary. CaMKIIα labeling is extensive in the rostrolateral ICX at mid-dorsoventral level (E) and also extends into ICCms at more dorsal and ventral levels (D and F, respectively). G-I, Calbindin labeling at similar dorsal, mid-dorsoventral, and ventral levels, taken from a different owl. Calbindin labels both ICC core (intensely) and ICX (more lightly). Scale bar: (in I) A-I, 1 mm. Images were obtained using a wide-field microscope (5× air objective). Very similar results were observed in all owls (n = 14 for CaMKIIα; n = 7 for double label).
- Figure 5.
Coexpression of CaMKIIα with GAD65/67, calretinin, and calbindin. A-C, Single optical section (∼1 μm thick) from the ICX labeled with CaMKIIα (green) and GAD65/67 (red). CaMKIIα+ somata did not express GAD. E-G, Single optical section from the ICX labeled with CaMKIIα (green) and calbindin (red). Some somata were single labeled; others were double labeled. I-K, Single optical section from the ICX labeled with CaMKIIα (green) and calretinin (red). Some somata were single labeled; others were double labeled. D-L, Pie charts indicate the percentage of CaMKIIα cell bodies positive for CaMKIIα only (light gray) versus those also positive for GAD, calbindin, or calretinin.
- Figure 6.
Retrograde labeling of ICX-OT projection neurons. A, Sketch of a horizontal section after in vivo injection of micro-ruby into the deep layers of the OT. Location of the injection site is indicated. r, Rostral; l, lateral. B, Retrogradely labeled cells located in the ICX. C, Labeling for CaMKIIα in the same section. D, Merged view, showing that one of the two retrogradely labeled cells expressed CaMKIIα; the other did not. All images shown here are collapsed confocal stacks, 10 μm in depth. Scale bar, 10 μm.
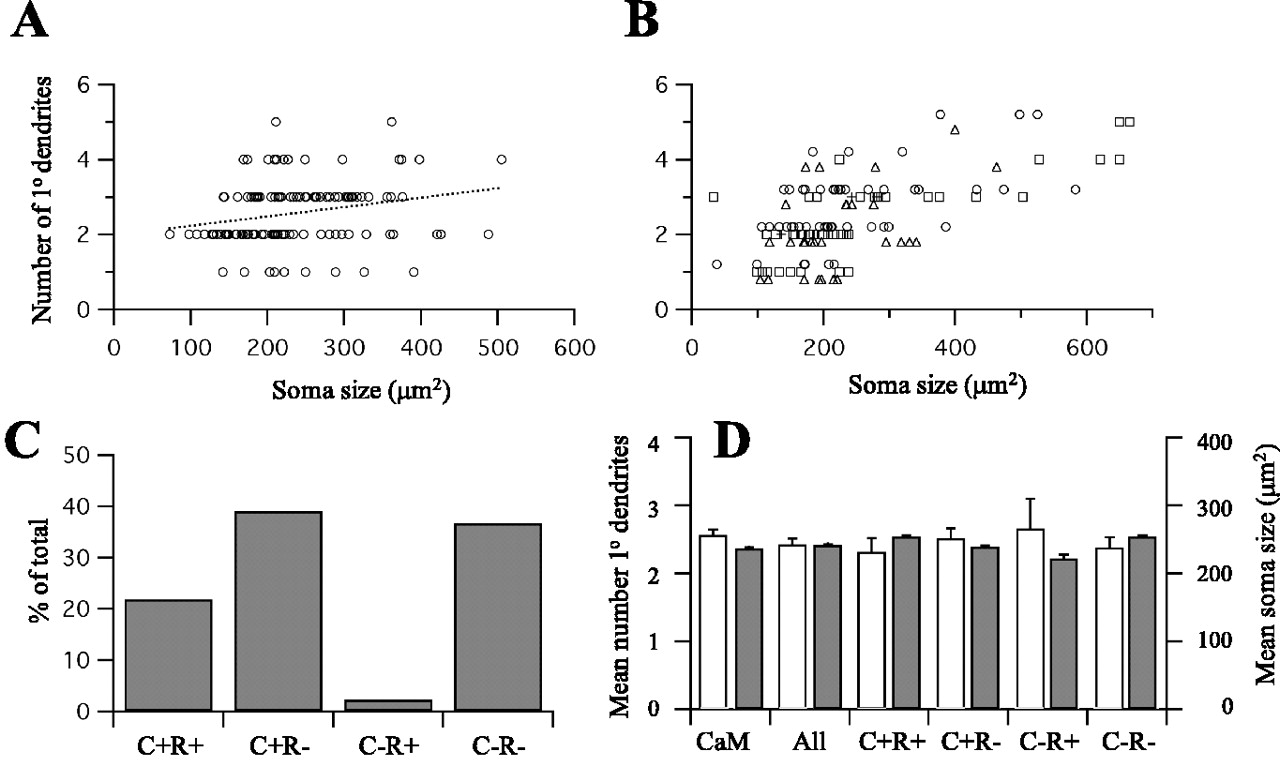
- Figure 7.
Morphology and neurochemical identity of ICX-OT projection neurons. A, Relationship between soma size and number of primary dendrites for CaMKIIα ICX neurons (n=124). Dotted line is linear regression. The largest cells had, on average, one more primary dendrite than the smallest cells. B, Similar data plotted for four neurochemical classes of ICX-OT projection neurons (n = 128). Triangles, CaMKIIα+, calretinin+; circles, CaMKIIα+, calretinin-; +, CaMKIIα-, calretinin+; squares, CaMKIIα-, calretinin-. C, Prevalence of the four neurochemical classes within the ICX-OT projection. D, Mean number of primary dendrites (left) and soma size (right) for CaMKIIα ICX neurons (CaM), retrogradely labeled ICX-OT neurons (All), and the four neurochemical classes. C, CaMKIIα; r, calretinin. For these morphological features, no difference was observed between the neurochemical classes.
- Figure 8.
Labeling and visualization of axodendritic contacts onto CaMKIIα ICX neurons. A, Sketch of a coronal section used for anterograde tracing. Dotted line indicates borders of intense CaMKIIα staining. Red dot indicates injection site. Scale bar, 1000 μm. v, Ventral; l, lateral; d, dorsal. B, Close-up of raw image of tissue section diagrammed in A. The injection site is small and confined to ICCls. Scale bar, 300 μm. C, Deconvolved confocal image stack showing CaMKIIα cells in grayscale and ICCls axons in red. Sites of putative contact could not be reliably identified from this image. D, A portion of dendrite receiving a candidate contact is isolated and rendered in three dimensions. For clarity, the dendrite is shown in white, and the axon is shown in purple. E, The 3D volume is rotated around the candidate contact (fly-through visualization; Volocity). F, Close-up of candidate contact between axonal bouton and CaMKII dendrite. White scale bar, 2μm. No intervening space is visible at any rotation or zoom factor. Thus, the site is scored as a PSC.
- Figure 9.
Near misses and multiple PSCs converging onto CaMKII ICX dendrites. A, Near miss between axon and dendrite. This site fails on two criteria: lack of bouton and lack of contact. B, Near miss between bouton and dendrite. This site fails based on lack of contact. One PSC was found between the same axon and dendrite (left side of main view). C, Multiple PSCs from different axons converge onto the same dendrite. Axons with distinct incoming trajectories are colored red, blue, and orange. D, Multiple PSCs from single axon contact a single dendrite. Note the presence of terminal boutons on axonal branchlets that do not contact CaMKII neuropil.
- Figure 10.
Local divergence in the ICCls-ICX projection. A, Raw image of ICCls axon (red) coursing past several CaMKII ICX neurons. B, Classified axon (blue) and dendrites from separate ICX neurons (white). C, High-magnification view of PSCs on each dendrite.
- Figure 11.
Interface thickness of beads and PSCs. A, Diagram of the image of a multicolor bead. The physical interface between yellow inner core and red outer shell is denoted by the dotted line. The interface is the gray area of apparent overlap between the core and the shell and is attributable to point spread of light. The arrows denote interface thickness, which was measured as described in Materials and Methods. B, PSC interface is shown in white, bouton is shown in light gray, and dendrite is shown in dark gray. Transparency was adjusted in Photoshop for display purposes only. The interface thickness was measured orthogonal to the plane of contact (see Materials and Methods). C, Distribution of interface thicknesses for beads. The mean was 367 nm. D, Distribution of interface thicknesses for PSCs; 77% were equal to or larger than the criterion derived from bead measurements (dotted line).
- Figure 12.
Ultrastructure of CaMKII ICX neurons and ICCls synapses. A, Low-power electron micrograph shows a soma and proximal dendrite labeled by silver-enhanced immunogold particles for CaMKII. Note that particles are evenly distributed within the cytoplasm and associated with subcellular organelles, such as Golgi apparatus and endoplasmic reticulum, but are excluded from the nucleus (n). Scale bar, 1 μm. B, A biocytin (electron-dense peroxidase reaction product) and CaMKII (silver-enhanced gold particles) double-labeled terminal (t) forming an asymmetrical synapse on a small CaMKII-negative dendritic shaft (d). The clear synaptic contact is shown at high magnification in the inset. C, A biocytin and CaMKII double-labeled terminal forming an asymmetrical synapse on a small CaMKII-immunopositive dendritic shaft [d(CaM)]. CaMKII-immunolabeled particles are distributed in the dendrite. D-F, Serial electron micrographs through a biocytin and CaMKII double-immunolabeled terminal forming an asymmetrical synapse on a CaMKII-labeled dendritic shaft. Particles labeled for CaMKII are consistently present in postsynaptic dendrite, shown in serial sections. Scale bars: B, D, 0.5 μm; B, inset, 0.1 μm.
- Figure 13.
Spatial distribution of ICCls axons, boutons, PSCs, and CaMKII neuropil. The pattern of labeling ventral and lateral to the site of injection of the coronal section shown in Figure 7A was reconstructed by tiling the ICX with measurement zones. Spatial maps were smoothed with a two-dimensional Gaussian filter. Whiter coloring indicates more labeling. Coordinates (0,0) indicate the site of injection. Spatial density of CaMKII labeling (A), total axonal length (B), number of tracer-labeled axonal boutons (C), and number of PSCs (D).
- Figure 14.
Selectivity of ICCls axonal boutons for contacting CaMKII ICX neurons. A, Covariance plot of the number of boutons and the number of PSCs in each measurement zone (n = 63). B, Plot of number of boutons versus dorsoventral distance to the injection site. There is a modest decrease in the number of boutons at additional distances. C, CaMKII selectivity versus dorsoventral distance. Selectivity is constant over large distances. Lines are best fits to linear regression. For details, see Results.


Tables
Fluorophore Resolution (μm) FWHM (μm) λex/λem(nm) Lateral Axial Lateral Axial TetraSpeck 0.19 0.46 0.22 0.45 488/515 TetraSpeck 0.21 0.51 0.25 0.64 543/580 TetraSpeck 0.25 0.60 0.27 0.73 633/680 Alexa Fluor 488 0.19 0.46 Not measured 488/519 Rhodamine (micro-ruby) 0.21 0.51 Not measured 543/580 Alexa Fluor 647 0.24 0.60 Not measured 633/668 -
Resolution was calculated according to the following, which describe theoretical limits for confocal microscopy: lateral = (0.51 × λem)/NA, and axial = (0.88 × λex)/[n - (n2 - NA2)]½, where λem is the peak emission wavelength, λex is the laser excitation wavelength, n is the refractive index of medium, and NA is the numerical aperture of the microscope objective. FWHM, Full width at half-maximum.
-


