

Article Figures & Data
Figures
- Figure 1.
Golgi cells evoke IPSCs in granule cells and UBCs with different pharmacological profiles. A, B, Short depolarizing current steps (500 pA, 1 ms) triggered single action potentials in Golgi cells. Superposition of 10 consecutive action potentials and the corresponding current responses in a granule cell (A) and in a UBC (B). Vh, Holding potential (-70 mV). C, E, Histograms of the response latency in a granule cell and in a UBC, respectively. D, F, Average amplitude histograms of the current response in six granule cells and seven UBCs, respectively (bin, 20 pA). Scaled histograms of the noise amplitude (7.9 ± 4.6 pA in granule cells and 4.9 ± 1.6 pA in UBCs) are superimposed in black (bin, 10 pA). G, Example of the effect of 5 μm SR on the mean postsynaptic response in a granule cell. H, Plot of the absolute amplitude of postsynaptic responses in six granule cells in control conditions and after application of 5 μm SR (*p < 0.04, sign test). I, Effect of 600 nm strychnine on the mean postsynaptic response in a UBC. J, Plot of the absolute amplitude of postsynaptic responses in eight UBCs in control conditions, after the application of 600 nm strychnine (*p < 0.01, sign test) and after consecutive application of 5 μm SR. ctrl, Control; str, strychnine.
- Figure 2.
The spontaneous inhibitory activity recorded from UBCs has a variable sensitivity to strychnine. A, B, Plots of the peak amplitude of detected spontaneous IPSCs, illustrating the two pharmacological profiles observed: a fully glycinergic profile (A) or a mixed glycinergic and GABAergic profile (B). C, Histogram showing the remaining cumulative activity (product of the amplitude and frequency) after the bath application of 300-600 μm strychnine (in percentage of the control cumulative activity). The detection threshold was set to 15 pA. str, Strychnine.
- Figure 3.
Pharmacology of IPSCs triggered by the same presynaptic Golgi cell in granule cells and UBCs. A, Synchronous spontaneous IPSCs (arrowheads) in a granule cell (top) and in a UBC (bottom). Vh, Holding potential (-70 mV). B, Corresponding cross-correlogram (bin, 50 μs). C, Convolution of pooled latencies at Golgi cell-UBC and Golgi cell-granule cell synapses (dark line) superimposed on the distribution of the jitter between uIPSCs and gIPSCs (gray; bin, 50 μs). The two distributions do not differ significantly (bootstrap Kolmogorov-Smirnov). D, Average IPSC in a granule cell (top) and average synchronous current in the UBC (bottom). ctrl, Control; str, strychnine; wsh, washout. E, Average amplitudes, normalized to their control value, of gIPSCs (dark gray) and synchronous currents in UBCs (light gray) during strychnine application (n = 12) and after 20 min washout (n = 5). The effect of strychnine is significantly different for gIPSCs and for synchronous currents in UBCs (*p < 0.01, Mann-Whitney U test). The error bars represent the SEM.
- Figure 4.
Immunohistochemical characterization of Golgi cell axon terminals. A, Partial colocalization of the glycinergic marker GlyT2 (A1) and the GABAergic marker GAD65 (A2) in the same glomerular structures. Note the characteristic GAD65 presynaptic terminal staining pattern, contrasting with the broader GlyT2-IR. A3, Superposition of A1 and A2, indicating that GlyT2-IR either colocalizes (arrows) or is apposed (asterisks and inset) to GAD65-IR. B, Massive colocalization (arrows) of GAD65-IR (B1) and VIAAT-IR (B2), as seen on superimposed images on B3. C, D, Immunodetection of GlyT2 in lobules X and VI, respectively. Note the comparable staining pattern in the granule cell layer of both lobules. Insets, Higher magnification showing GlyT2-IR profiles likely to be Golgi cell axon terminals (arrows) within a glomerulus. E, F, Glycine and GABA immunodetection in Golgi cell terminal. Both are detected in periglomerular profiles (arrows) of lobules X (E1, E2, E3) and VI (F1, F2, F3). Note that different expression levels are detected within each varicosity. A, B, Single confocal sections; C, D, wide-field CCD camera images; E, F, projection of three confocal sections (0.48 μm between each section). Scale bars: A, B, E, F, 5 μm; C, D, 100 μm; inset in A, 1 μm; insets in C, D, 10 μm.
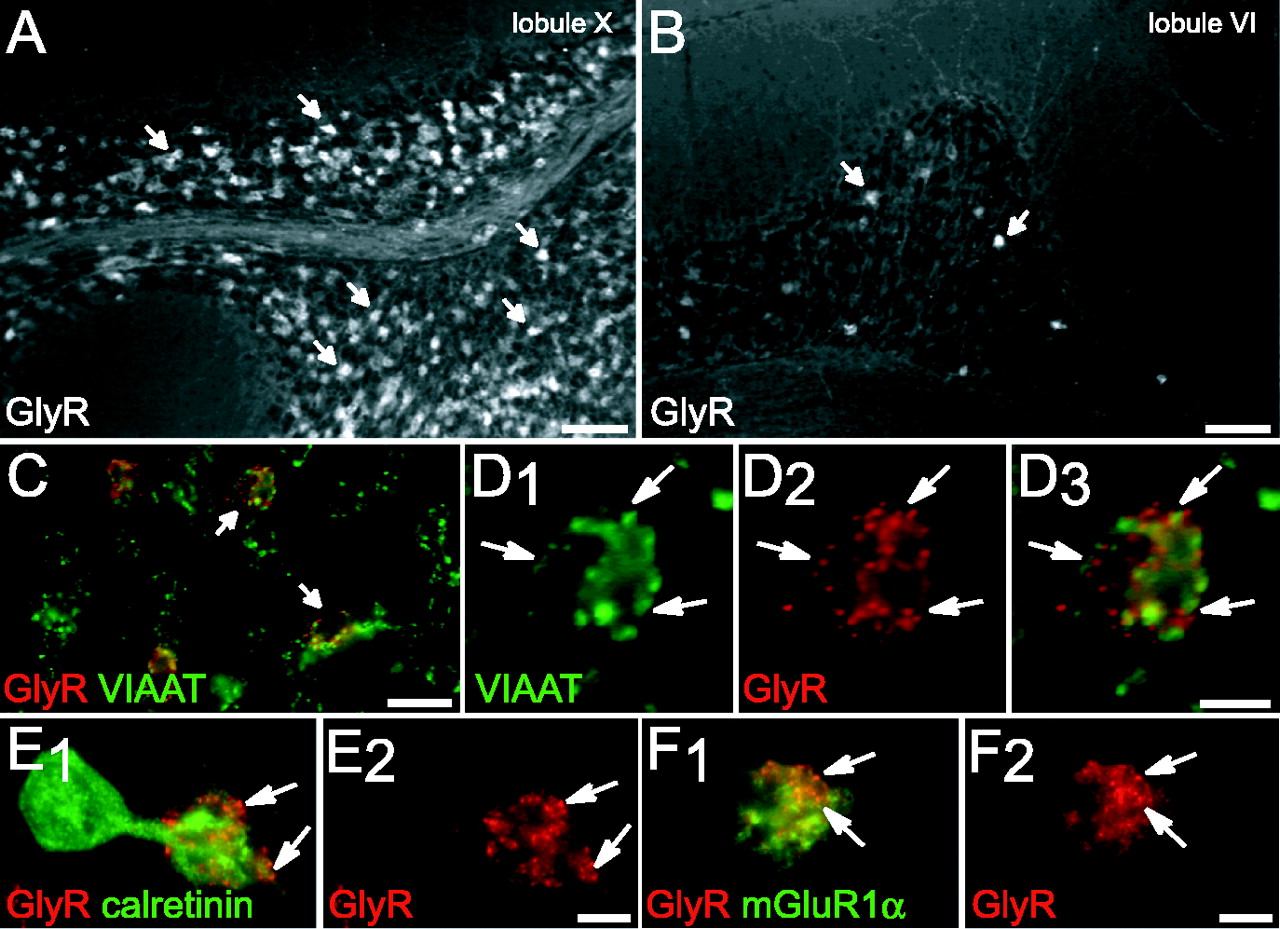
- Figure 5.
Expression of GlyRs by UBCs. A, B, Immunodetection of GlyR in lobules X and VI, respectively. Numerous GlyR-IR structures (arrows) within lobule X granular layer contrasting with small numbers of GlyR-IR profiles (arrows) in lobule VI. C, F, Double detection of GlyR and different markers in the granular layer of lobule X. C, Codetection of VIAAT (green) and GlyR (red) indicating that only a subpopulation of glomeruli expresses GlyR-IR (arrows). D, High magnification of a glomerulus with presynaptic VIAAT-IR (green) apposed (arrows) to postsynaptic GlyR clusters (red). E, GlyR aggregates (red, arrows) on the dendritic brush of a CR-positive UBC (green). F, GlyR aggregates (red, arrows) are also detected on mGluR1α-IR (green) UBC dendrioles. A-F, Wide-field CCD camera images. Scale bars: A, B, 100 μm; C, 20 μm; D-F, 5 μm.
- Figure 6.
Granule cell and UBC responses to bath application of GABAAR and GlyR agonists. The effects of both agonists were compared in two separate groups of UBCs. UBCs were sorted into these groups according to the effect of strychnine on their spontaneous inhibitory synaptic activity. UBCs were considered to receive, respectively, purely glycinergic or mixed inhibition when their CA was reduced to less or more than 5% of its control value. A-C, Average responses of granule cells (A) and UBCs receiving mixed (B) or purely glycinergic (C) inhibition to bath application of 5 μm muscimol (dark gray bars) and 100 μm glycine (light gray bars). The response of granule cells to 100 μm glycine is significantly smaller than their response to 5 μm muscimol (*p < 0.01, Mann-Whitney U test) and not significantly different from zero (see Results). The current produced by 5 μm muscimol is significantly smaller in UBCs receiving purely glycinergic inhibition than in UBCs receiving mixed inhibition (*p < 0.01, Mann-Whitney U test). The error bars represent the SEM. msc, Muscimol; gly, glycine. D, Model of the postsynaptic selection of cotransmitters by the different targets of the Golgi cell. A Golgi cell releases both GABA and glycine at its terminals, but different types of transmission are recorded on three of its target cells. Specificity of the inhibition relies on the exclusive expression of GABAARs in granule cells, of GABAARs and GlyRs in some UBCs, and of GlyRs only in other UBCs.


Additional Files
Supplemental data
Files in this Data Supplement:


