

Article Figures & Data
Figures
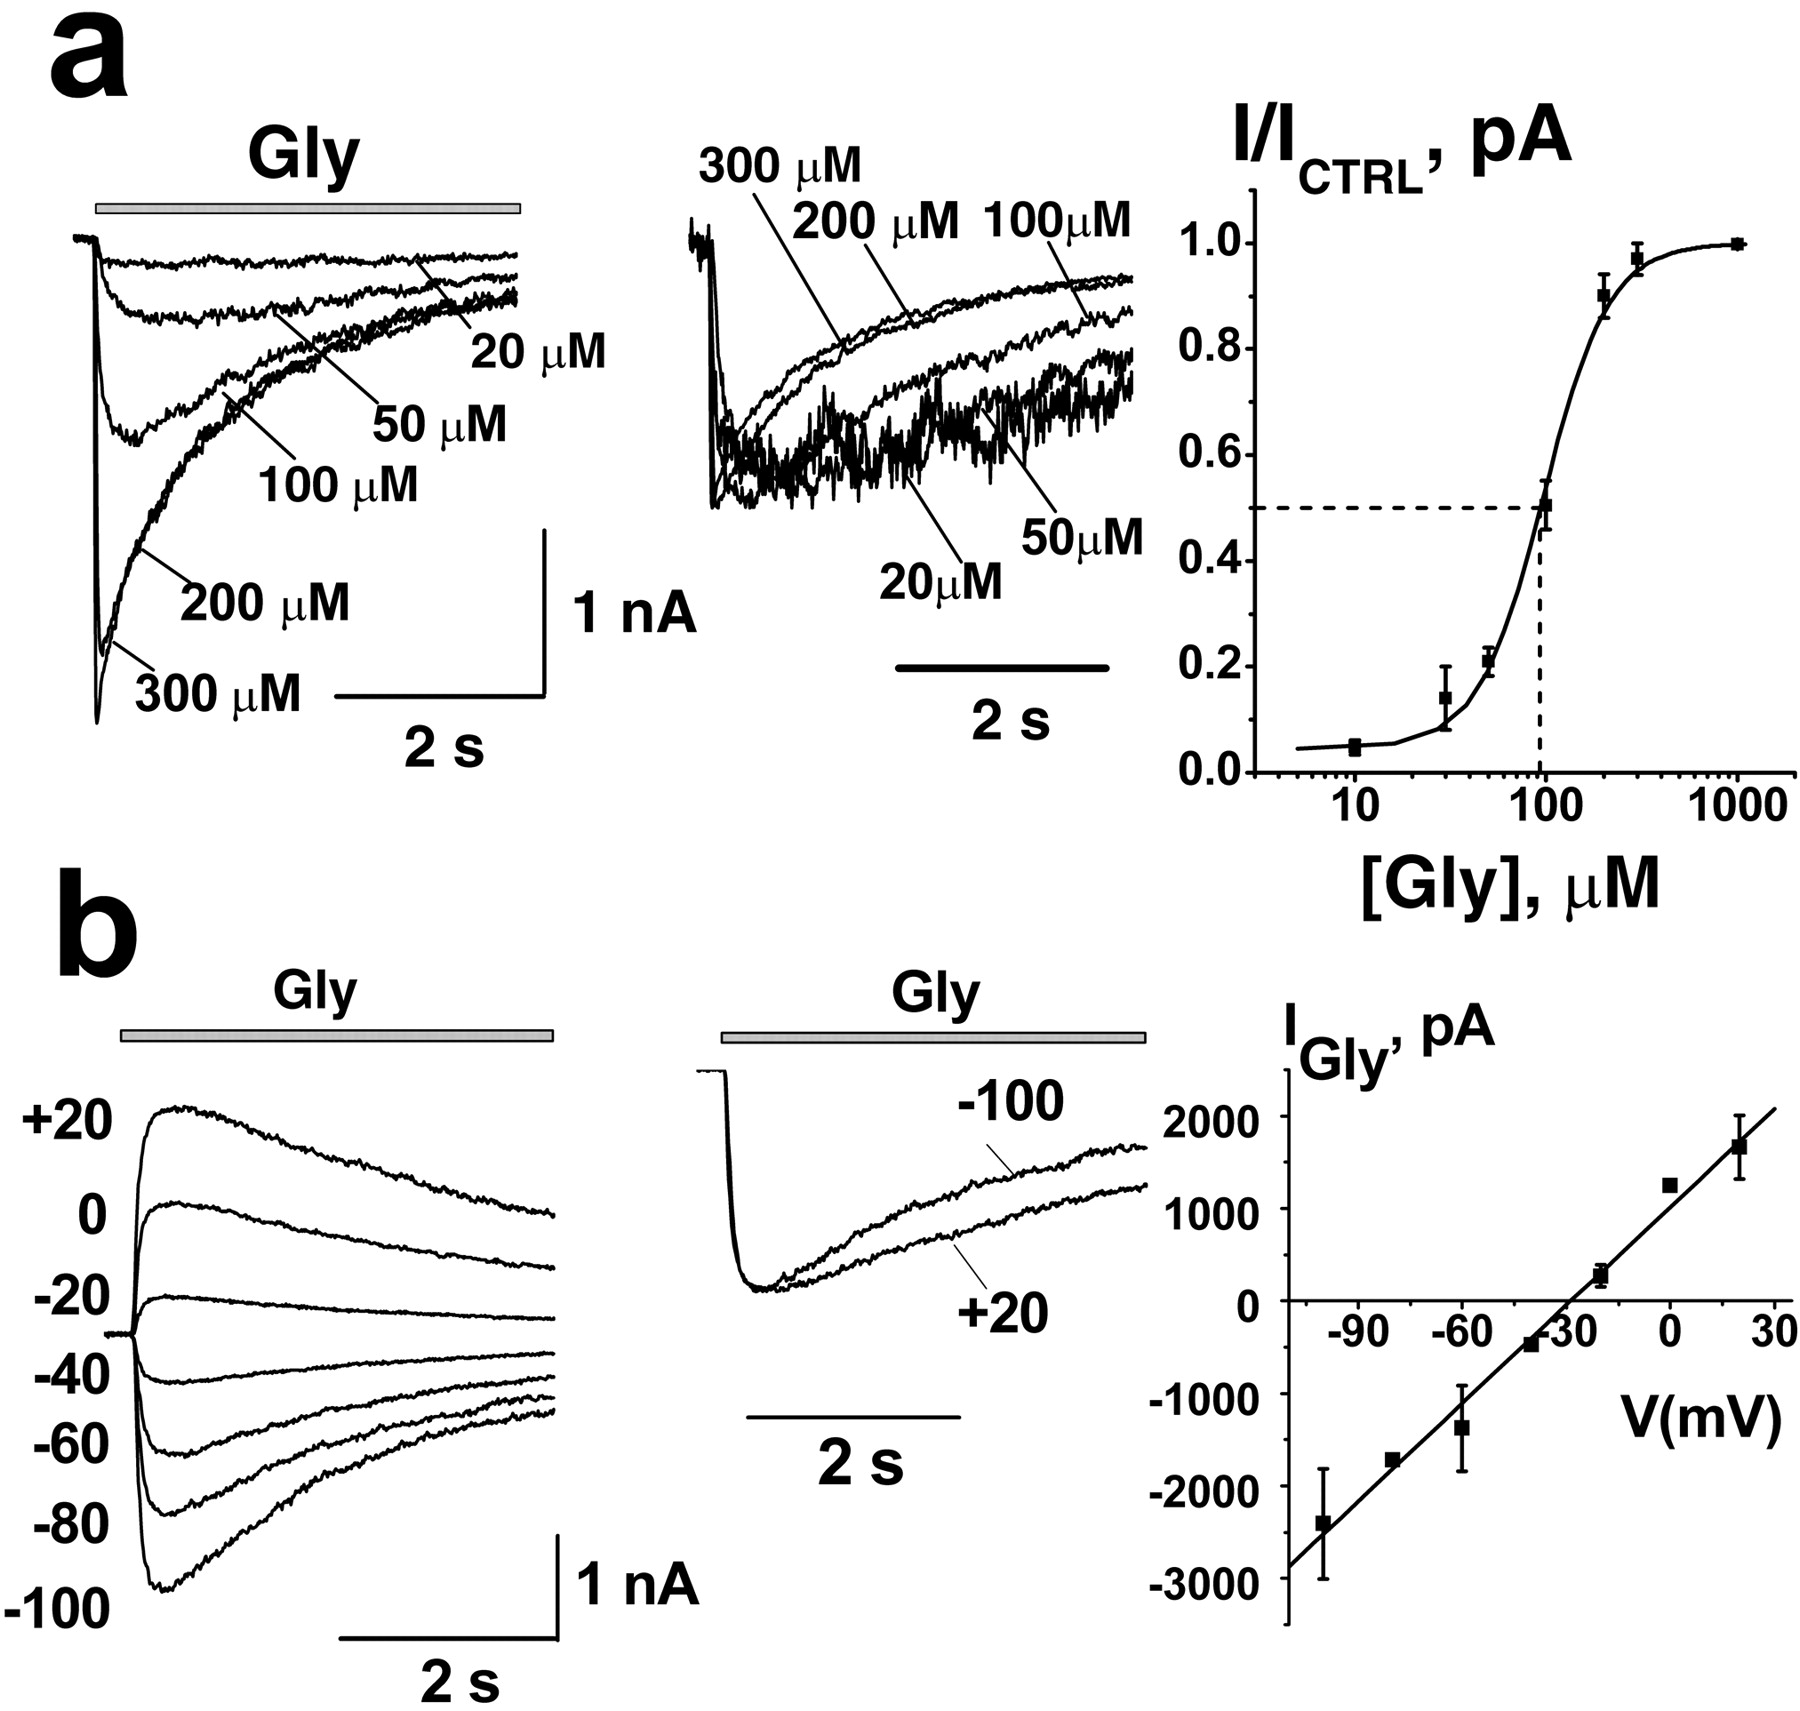
- Figure 1.
a, Agonist concentration dependence of glycine-induced current (IGly). Left, Family of IGly representative traces at increasing Gly concentration ranging from 20 to 300 μm. IGly was recorded in a CA3 hippocampal neuron by conventional whole-cell techniques. Responses were evoked by 4 s application of Gly (indicated here and in subsequent figures by gray bars above traces) at a holding potential of -100 mV in the presence of 10 μm bicuculline. Middle, The same traces normalized to the peak amplitude. Right, Normalized averaged concentration-response curve of IGly (n = 4). b, Current-voltage relationship of IGly. Left, The family of representative traces of current induced by 100 μm Gly at various holding potentials from -100 to +20 mV with a 20 mV step. Middle, Traces obtained at -100 and +20 mV are superimposed and normalized. Right, I-V of peak IGly, measured with 100 μm Gly.
- Figure 2.
Modulation of IGly by endogenous cannabinoids. a, b, Left, Representative traces of IGly, induced by 100 μm Gly, obtained in control and in the presence of 1 μm 2-AG (a) or 1 μm AEA (b). Middle and right, Corresponding traces are superimposed and normalized. The averaged numbers for changes of IGly peak, τdes, and 20-80% rise time (ton) induced by 2-AG (c) and AEA (d). e-h, Concentration dependence of AEA effects on IGly. e, Left, Representative traces obtained at various concentrations of AEA ranged from 200 nm to 2 μm. Middle and right, Corresponding traces are normalized and superimposed. Summary plots showing the effect of increasing AEA concentrations on the amplitude (f), τdes (g), and ton (h) of IGly are shown (Vh = -100 mV; n = 4). Data are plotted as a fraction of the maximal glycine current in control.
- Figure 3.
Voltage dependence of the IGly modulation by 2-AG. a, Representative traces obtained in control condition and in the presence of 1 μm 2-AG at holding potentials of -100 and +20 mV. b, c, Corresponding traces normalized and superimposed. d, Deactivation of IGly before and after preapplication with 2-AG. e-h, Statistics for the 2-AG effects on peak amplitude (e), τdes (f), ton (g), and τdeac (h) obtained at holding potentials of -100 and +20 mV.
- Figure 4.
Modulation of glycine-activated currents by WIN 55,212-2. a, Left, Traces of IGly induced by 100 μm Gly obtained in control, in the presence of WIN 55,212-2 (1 μm), and after washout of drug (gray line) (Vh = -100 mV). Middle and right, The same traces are superimposed and normalized. b, Statistics of the effects of WIN 55,212-2 on the amplitude, τdes, and ton (n=11) of IGly. c-e, Concentration dependence of the WIN 55,212-2 effects on IGly kinetics. c, IGly traces recorded at various concentration of WIN 55,212-2 ranged from 100 nm to 2 μm measured in the same cell are normalized and superimposed. d, e, Summary plots showing the effect of increasing the WIN 55,212-2 concentrations on τdes (d) and ton (e) measured at Vh = -100 mV (n = 4). Data are plotted as a fraction of the maximal glycine current in control. f-h, Voltage dependence of the IGly modulation by the WIN 55,212-2. f, Left, IGly representative traces obtained in control condition and in the presence of 1 μm WIN 55,212-2 at holding potentials of -100 mV and +20 mV. Middle and right, The same traces are superimposed and normalized. Statistics for the WIN 55,212-2 effects on τdes (g) and ton (h) at holding voltages of -100 and +20 mV.
- Figure 5.
CB1/CB3 receptors and G-proteins are not involved in the modulation of IGly by cannabinoids. a-c, Left, Traces of IGly (100 μm) obtained in the control and with 1 μm 2-AG in the presence of SR141716A (2 μm)(a), intracellularly preapplied GDPβS (2 mm)(b), and capsazepine (CPZ; 1 μm)(c). Vh = -100 mV. Middle and right, The same traces are superimposed and normalized. e, Statistics of the effects of 2-AG on the peak amplitude, τdes, and ton (n = 4) of IGly in the presence of SR141716A, capsazepine, and during intracellular perfusion with GDPβS. IGly peak amplitude inhibition induced by 2-AG in the presence of SR141716A was 46 ±9% compared with 40 ± 7% in control (n = 3; p > 0.5), whereas corresponding figures for τdes were 55 ± 4% in the presence of antagonist compared with 55 ± 6% (n = 3; p > 0.8), and ton was 54 ± 9% compared with 56 ± 5% (n = 3; p > 1). d, Left, Traces of IGly (100 μm) obtained in the control and with 1 μm AEA in the presence of 1 μm capsazepine (CPZ). Middle and right, The same traces are superimposed and normalized. f, Statistics of the effects of AEA on the peak amplitude, τdes, and ton of IGly in the presence of CPZ. In the presence of CPZ, decay kinetics and rise time were accelerated by AEA to nearly the same extent as in the control: 42 ± 2% compared with 40 ± 15% in control (n = 3; p > 0.8) for τdes; 50 ± 8% compared with 62 ± 16% in control (n = 3; p > 0.7) for ton.
- Figure 6.
GlyR-driven seizure-like rhythmic activities in hippocampal slices attenuated by AEA. a, Seizure-like activity recorded from CA1 and CA3 stratum radiatum in response to stimulation (S) of Schaffer collateral-commissural pathway with high-frequency short trains of stimuli (7 stimuli; 50 Hz) applied every 4 min in the presence of 30 μm bicuculline. Slice events were detected by using extracellular field potential recordings (R). Cutting the Schaffer collaterals abolishes discharges in the CA1 area, indicating that excitatory inputs from the CA3 area are necessary for entraining CA1 to generate the epileptiform discharges. Traces of epileptiform discharges in control and in the presence of strychnine (b) and AEA (20 μm) against the background of SR141716A (1 μm) (d) are shown. c, Experiment demonstrating attenuation of epileptiform activity after 30 min of perfusion in nominally CO2-free superfusion medium. Note that control field potentials, evoked by single stimuli stimulation of Shaffer collateral-commissural pathway (no bicuculline), did not change after changing of superfusion medium (inset). e-g, Corresponding averaged Fourier transformations (4 epochs of 2 s recordings) of epileptiform activity. h-j, The normalized summarized Fourier transformations of 2-s-long epochs of epileptiform discharges at β-frequency bands in control and in the presence of strychnine (5 μm; n = 5) (h), in CO2-free medium (n = 3) (i), and in the presence of AEA and SR141716A (n = 4) (j).


Additional Files
Supplemental data
Files in this Data Supplement:


