

Article Figures & Data
Figures
- Figure 1.
Healthy cortex maintained during a 2 year period. A, Similarity of blood vessel maps during a 26 month period. Four time points are shown (day 0, 6 months, 15 months, and 26 months). B, Electrophysiological mapping of areas 3a, 3b, and 1. The colored dots indicate electrode penetrations. Units in areas 1, 3b, and 3a are indicated by blue, green, and yellow dots, respectively. Letters following each digit number (as illustrated in the top left inset in B) indicate the precise locations of the receptive field (t, tip; mp, middle phalanx; b, base; p, palm; h, hairy). The dashed lines indicate approximate borders between areas 3a, 3b, and 1. C, Imaging session dates under either awake or anesthetized states (e.g., 020424 denotes April 24, 2002). Scale bars: A, 5 mm; B, 1 mm. M, Medial; L, lateral; A, anterior; P, posterior.
- Figure 2.
Stability of topographic maps over time in the anesthetized animal. A, D, G, First-frame-subtracted raw images to D3 indentation stimulation, aligned across three different imaging sessions. For each image, the clipping range is ∼0.2%. Each image was clipped individually to ± 2 SDs from its mean gray level. For the three imaging sessions in A, D, and G, signals were averaged from 45 (n = 9 blocks), 60 (n = 12 blocks), and 40 (n = 8 blocks) trials, respectively. B, E, H, Color outlines derived from filtering and the thresholding method were overlaid on the raw images to indicate the location of greatest response. C, F, I, Corresponding blood vessel images from each day. J, Locations of activation indicated by color outlines were superimposed on the blood vessel map. The inset illustrates an expanded image of activation outlines and electrode penetration (green dot). The dashed line indicates the border between are as 3b and 1. K, Absolute peak amplitudes of optical signal derived from three imaging sessions. L, Lateral; P, posterior. Scale bar, 1 mm.
- Figure 3.
Stability of distal fingerpad representation in the awake animal. A, D, G, First-frame-subtracted raw images to vibrotactile stimulation (mini motor) of digit D4 are shown for three different imaging sessions. For the three imaging sessions, signals were averaged from 18 (n = 9 blocks), 24 (n = 12 blocks), and 16 (n = 8 blocks) trials, respectively. For each image, the clipping range is ∼1.0%. Each image was clipped individually to ± 2 SDs from its mean gray level. B, E, H, Color outlines derived from filtering and the thresholding method are overlaid on the raw images to indicate locations of strongest response. The red arrow in D indicates activation in area 3b. C, F, I, Corresponding blood vessel images from each day. J, Activation outlines superimposed on the blood vessel map. Note the slight shift of the field of view between images in A and D and that in G(indicated by red and black frames). For comparison, the location of D3 activation in the anesthetized condition (shown in Fig. 2) is also displayed (light blue outline). The dotted line indicates borders between areas 3a, 3b, and 1. The green dots indicate electrophysiology penetrations. K, The peak reflectance changes from three imaging sessions were based on a total 9, 10, and 9 blocks, respectively. M, Middle; P, posterior. Scale bar: (in I) A-J, 1 mm. The dotted box in I indicates the position of the field of view in Figure 2.
- Figure 4.
Consistency of trial-by-trial activation in the anesthetized and awake animal. A, Eight individual trial images (first frame subtracted) taken from a single imaging session in the anesthetized animal in response to D3 indentation. Clip range, ∼0.1%. B, Top, The summed image of eight trials. Bottom, Activations from each trial are outlined in color (corresponding image coded by color bars in A) and superimposed on the blood vessel map. C, Eight individual trial images taken from a single imaging session in an awake animal in response to D2 stimulation. Clip range, ∼2.0%. D, Top, The summed image of these eight trials. Bottom, Activations from each trial are outlined in color (corresponding image coded by color bars in C) and superimposed on the blood vessel map. The dotted box indicates field of view seen in B. Consistency of signal location is indicated by the high degree of overlap of colored outlines. The green dots in B and D indicate electrophysiological recording sites. Each image was clipped individually to ± 2 SDs from its mean gray level. Scale bars: B, D, 1 mm.
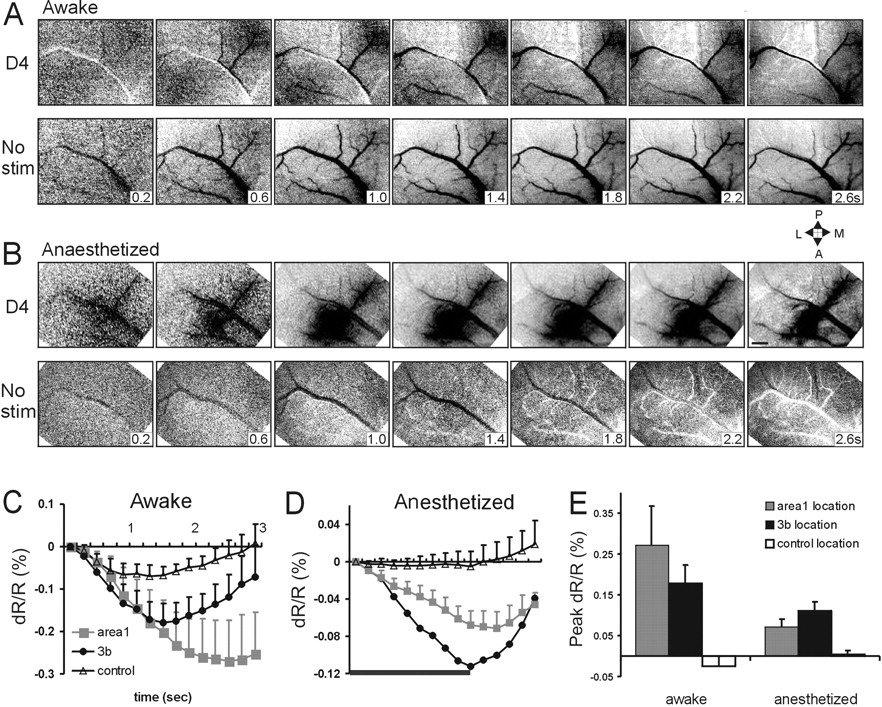
- Figure 5.
Temporal development of optical signal to identical vibrotactile stimuli on the same digit in both awake and anesthetized conditions in monkey 1. A, B, First-frame-subtracted raw images recorded to D4 vibrotactile stimulation in the awake (A, top row, sum of 18 trials) and anesthetized (B, top row, sum of 40 trials) states are shown. Images obtained in the no-stimulus (No stim) condition are shown in the bottom rows. Poststimulus time points are indicated at the bottom right corner of each image. The clip range was ∼1.0% in the awake state and 0.2% in anesthetized state. C, D, Temporal profiles of the optical signal derived from the location of D4 activation in area 3b (black line), area 1 (red line), and control (blue line) locations in the awake (C) and anesthetized (D) states. The gray bar in D indicates the period of stimulus presentation. E, Comparison of the absolute peak amplitude of response in area 3b (black bar), area 1 (red bar), and control (blue bar) locations in awake (left) and anesthetized (right) animals. Error bars represent SE. Scale bar, 1 mm. M, medial; L, lateral; A, anterior; P, posterior.
- Figure 6.
Temporal development of the optical signal in the awake (A) and anesthetized (B) conditions in response to electrocutaneous stimulation in monkey 2. First-frame-subtracted raw images recorded to D3 electrocutaneous stimulation in the awake state (A; top row, sum of 11 trials, 3.5 mA) and to D2 electrocutaneous stimulation in the anesthetized state (B; top row, sum of 12 trials, 5 mA) are shown. Images obtained in the no-stimulus condition are shown in the bottom rows in A and B. Image time point is indicated at the bottom right corner of each image (in seconds). The clip range was ∼0.5% in the awake state and 0.05% in the anesthetized state. Images in A are rotated to align with images in B (see blood vessel maps on the right). Scale bar, 1 mm. No stim, No stimulus. Temporal profiles of D3 stimulation in area 1 in the awake state (C) and of D2 stimulation in area 3b in the anesthetized state (D) are shown. The red and dark blue lines in C and D represent the signal amplitudes in the stimulated and nonstimulated conditions, respectively. The gray bar in D indicates the period of stimulus presentation. E, Comparison of the absolute peak amplitudes of response in the stimulus condition (black bars) versus no-stimulus condition (light gray bars) in awake (left) and anesthetized (right) states. ***p < 0.001; t test. Error bars represent SE. Scale bar: A, 1 mm. M, medial; L, lateral; A, anterior; P, posterior.
- Figure 7.
Dominance of area 1 activation in the awake animal. For the recording session of each day, we classified each block as are a 3b and 1, area 3b only, and area 1 only. The percentage of the area 3b and 1, area 3b-only, and area 1-only blocks were then calculated by dividing by the total number of blocks for that day. A, Average percentages of each activation pattern across nine cases in the awake state. B, Average percentages of each activation pattern across nine cases in the anesthetized state. *p < 0.05; ***p < 0.001.
- Figure 8.
Signal-to-noise ratio in the anesthetized and awake states in monkey 1. A, Signal amplitudes at digit activation centers (signal; black bars) and at control locations (noise; gray bars) reveal that signal size and signal variability are larger in awake than in anesthetized animals. B, This leads to a lower signal-to-noise ratio in the awake animal (∼11.6 in the anesthetized animal, 5.9 in the awake animal). Eleven and 13 blocks of images are averaged in the anesthetized (left column) and awake (right column) states, respectively. Optical signal amplitudes between digit centers and control locations in anesthetized (p < 0.001) and awake (p < 0.01) animals as well as between digit centers in anesthetized and awake animals (p < 0.01) were significantly different. *p < 0.1; **p < 0.01; ***p < 0.001. Anesth, Anesthetized.


