

Article Figures & Data
Figures
- Figure 1.
Acquisition and long-term retention of spatial memory in the water-maze task. A, D, Escape latency dynamics during water-maze training. B, E, Probe tests performed 24 h (B) and 1 month (E) after 7 d of water-maze training. Error bars indicate SEM of the number of crossings over the target location and nontarget quadrant centers. Note the spatial bias in the swim tracks of WMT rats. The target quadrant contained an escape platform during training trials. C, F, There was no spatial bias in the swimming pathways of SW yoked controls at both 24 h and 1 month after the last session. G, H, There was no difference in the distance swum by WMT and SW rats at 24 h (G) and 1 month (H) after the last training session. I, J, There was no difference in corticosterone levels after training room context exposure (I) and probe tests (J) 24 h after the last training session. Error bars indicate SEM; *p < 0.05; one-way ANOVA with Fisher's post hoc test. Opp, Opposite to target quadrant; Aj-r, adjacent right quadrant; Aj-l, adjacent left quadrant; AU, arbitrary units.
- Figure 2.
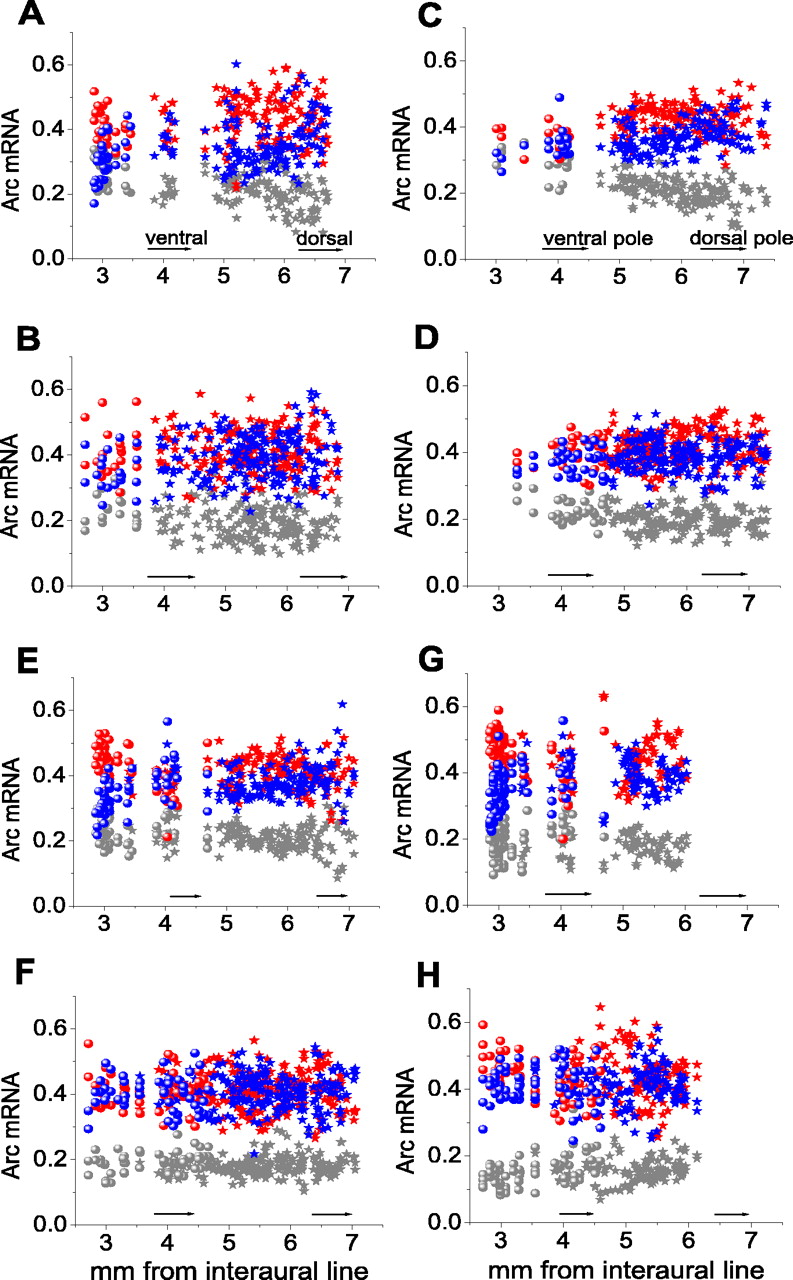
Distribution of Arc mRNA upregulation across the rostrocaudal axis of the hippocampus after activation of recent and long-term spatial memories. Red stars and circles indicate data for dHC and vHC of the WMT group. Blue and light-gray symbols indicate swimming and naive controls, respectively. Neurons with enhanced Arc mRNA expression were located at multiple rostrocaudal levels in DG (A, B), CA3 (C, D), CA1 (E), and subiculum (G, H) 30 min after the set of three 1 min probes of recent (A, C, E, G) and remote (B, D, H) memories. There was no distributed learning-specific signal in CA1 after long-term memory recall (F). For detailed statistical analyses, see Figures 6 and 7 and supplemental Tables 1-4 (available at www.jneurosci.org as supplemental material). Data points are individual mean values of the normalized Arc mRNA levels obtained for an anatomical match in every triad. Arrows indicate direction toward the hippocampal poles. mm, Millimeter.
- Figure 3.
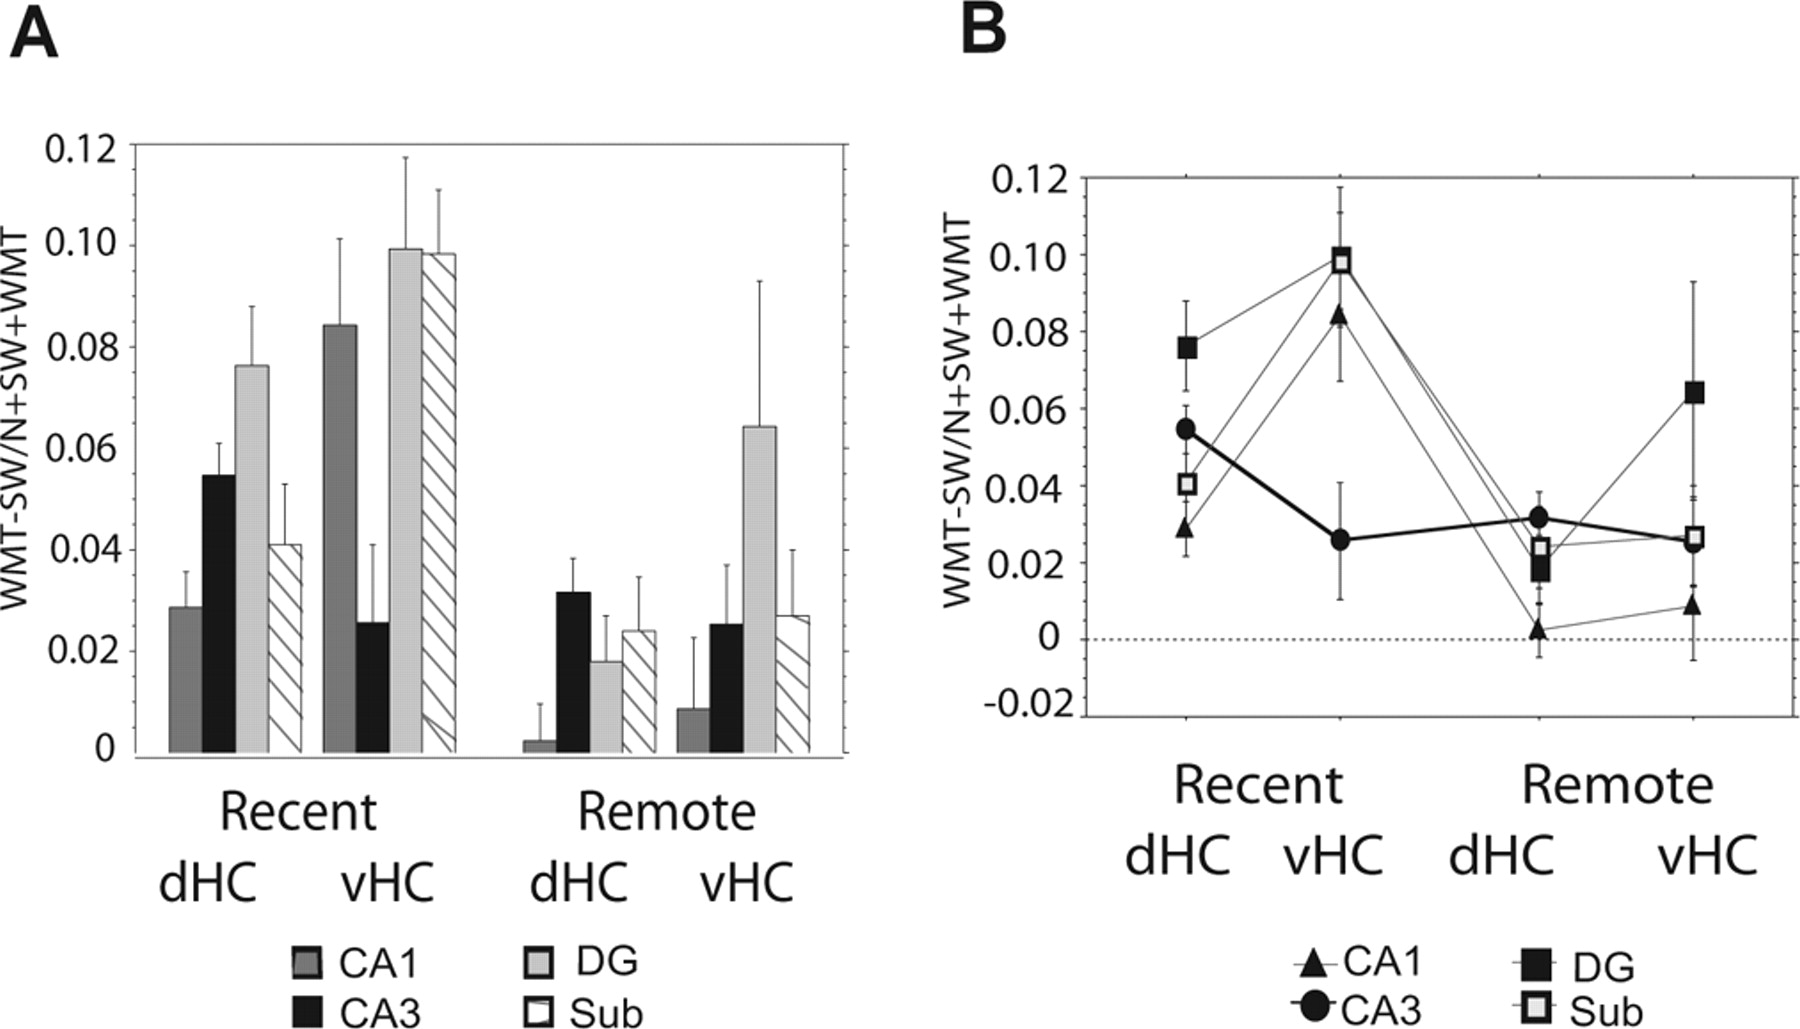
Factors affecting the magnitude of navigation task-specific Arc mRNA expression in the hippocampus: anatomical subdivision, its dorsal or ventral location, and a time delay since memory acquisition. A, Learning-specific Arc mRNA expression in hippocampal anatomical regions after recent and remote water-maze memory tests. B, An interaction plot illustrates time-dependent and subdivision-specific changes in Arc mRNA expression that were most distinct in CA3 compared with DG, CA1, and subiculum. Error bars indicate SEM of WMT and SW Arc mRNA differences. Sub, Subiculum; SW/N, SW/naive.
- Figure 4.
The dorsal hippocampus Arc mRNA upregulation by spatial memory recall at 24 h and 1 month retention intervals. A, Spectrum images of autoradiograms show the elevated Arc mRNA expression in DG (dorsal blade), CA3, CA1, and subiculum after a recent memory test in a WMT rat compared with its SW and naive matched controls. Images of the 14C microscales that were exposed in parallel with the samples illustrate the conversion of mean gray level into nanocuries per gram of tissue equivalents. The mean values in WMT, SW, and naive rats (experimental group 1), respectively, of Arc mRNA signal measured over the entire CA1 (644.5, 415.5, and 254.3 nCi/g), CA3 (247.1, 197.4, and 103 nCi/g), subiculum (843.95, 475.24, and 227.45 nCi/g), and dorsal blade of DG (199.91, 143.94, and 113.63 nCi/g) are shown. Scale bar, 1 mm. B, Autoradiograms show characteristic for long-term memory recall elevated Arc mRNA expression in CA3 and subiculum of a WMT rat compared with its SW and naive controls. The mean values in WMT, SW, and naive rats, respectively (experimental group 10), of Arc mRNA signal measured over CA1 (1154, 1123, and 446.2 nCi/g), CA3 (589.1, 346.7, and 124.7 nCi/g), subiculum (1339, 1142, and 339.3 nCi/g), and DG (360.6, 321, and 113.2 nCi/g) are shown. The small and inconsistent difference between WMT and SW controls was characteristic for CA1. The DG-specific signal was smaller but consistent. Displayed images represent different in situ hybridization experiments and therefore cannot be compared directly over the memory retention period.
- Figure 5.
Arc mRNA upregulation in the ventral hippocampus and entorhinal cortex by spatial memory recall at 24 h and 1 month retention intervals. A, Spectrum images of autoradiograms show characteristically elevated Arc mRNA expression in the DG, CA1, subiculum, and rostral LEA after a recent spatial memory test in a WMT rat compared with SW, and naive controls. Mean values of Arc mRNA signal were measured over the entire regions in WMT, SW, and naive rats, respectively, (experimental group 4) in CA1 (631.3, 394.2, and 313.5 nCi/g), DG (158.6, 78.7, and 115.3 nCi/g), upper subiculum (445.4, 251.7, and 193.3 nCi/g), lower subiculum (353.6, 205.4, and 131 nCi/g), and rostral LEA (123.4, 91, and 32.3 nCi/g). Scale bar, 1 mm. B, Autoradiograms show characteristically elevated Arc mRNA expression in subiculum but not in rostral LEA after the long-term spatial memory test. The Arc mRNA expression in CA1 of the WMT and SW control animals did not differ, and there was a moderate but consistent increase in DG. Mean values of Arc mRNA signal were measured over CA1 (485.1, 488.6, and 297.9 nCi/g; experimental group 10), upper subiculum (539.5, 438.6, and 179.2 nCi/g), lower subiculum (393.6, 321.1, and 152.8 nCi/g), DG (150.5, 128, and 135.5 nCi/g), and rostral LEA (130.6, 142.4, and 36.8 nCi/g). C, Elevated Arc mRNA expression in the MEA and caudal LEA after a recent spatial memory test compared with SW and naive controls (LEA: 194.05, 127.7, and 29.5 nCi/g; MEA: 130.5, 118, and 48.3 nCi/g; experimental group 3). Scale bar, 1 mm. D, Elevated Arc mRNA expression in the MEA and caudal LEA after a remote memory test compared with SW and naive controls (LEA: 475.4, 229, and 63.4 nCi/g; MEA: 264.3, 120, and 62.1 nCi/g; experimental group 7). Note the heightened Arc mRNA levels in the visual cortex, postsubiculum (Post), parasubiculum (PaS), and presubiculum (PrS) after both recent and remote memory activation. VI, Primary visual cortex; VII, secondary visual cortex; RS, retrosplenial cortex.
- Figure 6.
Time-dependent topography of DG and CA3 circuits activated during navigation in the water maze on the basis of recent and remote memories. A, During a 1 month retention period, the signal magnitude decreased drastically in the two DG segments (spanning > 5.41-6.2 mm) and had a similar tendency in three other segments. It was stable in scattered dHC and vHC segments (3.81-4.2 and 3.01-3.55, respectively). B, In contrast to DG, the similar amount of CA3 segments displayed specific activity during both recent and remote memory recall; however, the signal and its peak have shifted toward the dorsal pole (compare the dynamic of activity in sectors with borders 5.01-5.8 and 6.21-7.4 mm, respectively). The numbers indicate the coordinates of the borders of the segments for anatomically matched coronal brain sections from WMT, SW, and naive groups. NS indicates the segment that did not have a statistically significant learning-specific signal (see supplemental Tables 1 and 2, available at www.jneurosci.org as supplemental material for statistical data). The segments with fewer than four data points were not included in the analysis and are not presented. Error bars represent segment SEM of WMT and SW differences. mo, Month; hr, hour.
- Figure 7.
Time-dependent topography of the CA1 and subiculum circuits underlying navigation in water maze on the basis of recent and remote memories. A, Over a 1 month retention period, the specific signal disappeared in all dorsal and ventral CA1 segments except the one dorsal segment with coordinates 6.21-6.6, in which it was higher when compared with a recent memory task. B, In contrast to CA1, a similar number of subiculum segments displayed specific activity during both recent and remote memory recall. Although the signal magnitude did not change in the dorsal segments (5.81-6.2 and 4.61-5.0), it was drastically reduced in the ventral segments (3.01-3.4 and 2.61-3). mo, Month; hr, hour.
- Figure 8.
Task-specific activation of distributed circuits in the lateral and medial areas of the entorhinal cortex during tests of recent and long-term spatial memories. A, C, Note that learning-specific Arc mRNA was found at the multiple rostrocaudal levels of LEA during recent memory recall but was found only in the caudal part during remote memory recall. B, D, In contrast to LEA, learning-specific Arc mRNA was found at the multiple rostrocaudal levels of MEA during both recent and remote memory recalls. Insets, Normalized Arc mRNA levels in WMT, SW, and naive groups. Data represent SEM. *p < 0.0001.
- Figure 9.
Diagrams summarize changes in topography and magnitude of learning-specific Arc mRNA levels in the entorhinal-hippocampal circuitry during recall of recent and 1-month-old water-maze memories. A, During 1 month in memory retention, task-specific DG activity, widely and evenly distributed across the multiple 400 μm segments, has become limited to a few scattered segments. A weak signal could be identified as learning specific in the rest of the DG segments only if they were combined. B, The multiple CA1 segments were specifically activated by recent memory retrieval, whereas only one dHC segment displayed task-specific activity during a long-term memory task. The ventral CA1 displayed a higher signal compared with the dHC, similar to the ventral subiculum (D) during recent recall. C-E, CA3, subiculum, and the entorhinal cortex displayed the most persistent learning-specific signals after both recent and remote memories recall in contrast to DG and CA1; however, signal representation and magnitude have changed. C, In CA3, a weaker signal has been shifted toward the dorsal pole. The CA3 signal did not change in the ventral HC, where it could be identified only in the combined segments. D, In the subiculum, the signal occupied mostly the same regions of the dHC and vHC, but it had a significantly reduced magnitude in the vHC over a 1 month retention. E, Although both MEA and caudal LEA were consistently activated by the navigation task, rostral LEA was specifically activated after performance on a recent memory task. Note that there was no specific activity at the dorsal and ventral HC poles, and there were two sectors of specific activity in the central parts of the dHC and vHC separated by segments without it. Statistically significant differences in mean values of signal magnitude in individual segments were coded through their intensity in a gray scale. Data for the diagrams were pooled from supplemental Tables 1-4 (available at www.jneurosci.org as supplemental material) and Figures 3, 6, and 7. For some regions (dorsoventral CA3 and ventral DG), the learning-specific signal could be identified as statistically significant only if the segments were analyzed in combination. DGdb, DG dorsal blade; mo, month; hr, hour.


Tables
- Table 1.
Multiple probe tests did not cause extinction of searching behavior in the water maze
Parameter First probe Second probe Third probe Average Last training session p value Recent memory First target hit latencya 12.5 ± 2.62 14 ± 3.97 23 ± 9.19 16.7 ± 3.57 14.1 ± 2.2 0.73 Number of target area hits 2.6 ± 0.4 3.4 ± 0.93 1.6 ± 0.4 2.5 ± 0.39 0.16 Dwell time in target quadrana 17.3 ± 2.48 21.4 ± 1.33 15 ± 3.5 17.9 ± 1.57 0.2 Distance fraction swum in target quadrant 1.22 ± 0.24 1.68 ± 0.17 1.15 ± 0.32 1.3 ± 0.15 0.14 Remote memory First target hit latencya 33.0 ± 9.0 15 ± 4.64 10.1 ± 0.3 19.8 ± 4.35 15.8 ± 3.0 0.23 Number of target area hits 1.8 ± 0.49 2.0 ± 0.71 2.4 ± 0.6 2.07 ± 0.33 0.77 Dwell time in target quadranta 17.6 ± 0.55 21.9 ± 0.78 24.1 ± 2.8 21.4 ± 1.22 0.055 Distance fraction swum in target quadrant 1.31 ± 0.04 1.8 ± 0.08 1.95 ± 0.34 1.7 ± 0.14 0.14 -
Data are presented as SEM. The Kruskal-Wallis test was applied instead of ANOVA because of a slight difference in the number of data points across the consecutive water-maze probe tests and occasional differences in variance. The average was calculated on the basis of three probe tests. Because animals were not specifically trained to wait for platform availability, dwell times that reflect a procedural aspect of the task (Micheau et al., 2004) in the target quadrant were short in some probe tests.
-
↵ a Time in seconds.
-
- Table 2.
Learning-specific Arc mRNA expression at the level of the entire, dorsal, and ventral hippocampi in the anatomical subdivisions after navigation on the basis of recent and remote spatial memories of water maze
Recent memory Remote memory Subdivision df = n - 3 ANOVA, F statistic Fisher's post hoc test; p value df = n - 3 ANOVA, F statistic Fisher's post hoc test, p value CA1 630 972.6 <0.0001 783 1933.8 0.35 CA3 495 910.6 <0.0001 684 1639.7 <0.0001 DGdb 507 409.4 <0.0001 624 768 <0.0002 Subiculum 495 920.7 <0.0001 615 1651.3 <0.0001 dCA1 474 979.7 <0.0001 633 1587.1 0.5 vCA1 153 147.9 <0.0001 147 347 0.35 dCA3 435 1108.2 <0.0001 582 1449 <0.0001 d-vCA3 57 24.7 <0.05 99 232 <0.005 dDGdb 411 422.8 <0.0001 567 761.4 <0.004 vDGdb 93 48.2 <0.0001 54 38.4 <0.003 dSub 249 590.3 <0.0001 411 1076.5 <0.0004 vSub 243 415.4 <0.0001 201 569.9 <0.004 -
The normalized levels of Arc mRNA were compared in WMT, SW, and naive controls by one-way ANOVAs followed by Fisher's post hoc tests at p <0.05. n, Total number of data points for WMT, SW, and naive controls; df, degrees of freedom; db, dorsal blade; d, dorsal; v, ventral; Sub, subiculum. p values represent significance of WMT group difference from the SW control. Differences between WMT and naive and between SW and naive were always highly significant (p <0.0001) and are not represented.
-
Supplemental data
Files in this Data Supplement:
- supplemental material - Supplementary material.


