

Article Figures & Data
Figures
- Figure 1.
Light micrograph of the left side of the superior olivary complex showing two electrode penetrations through the LSO. An electrolytic DC lesion marks the locations of one of the low-characteristic-frequency LSO neurons (arrow; 108-5, characteristic frequency, 1.35 kHz; and 108-9, characteristic frequency, 1.75 kHz). The major nuclei and landmarks of the superior olivary complex are denoted. MSO, Medial superior olive; TB, trapezoid body; Pyr, pyramidal tract.
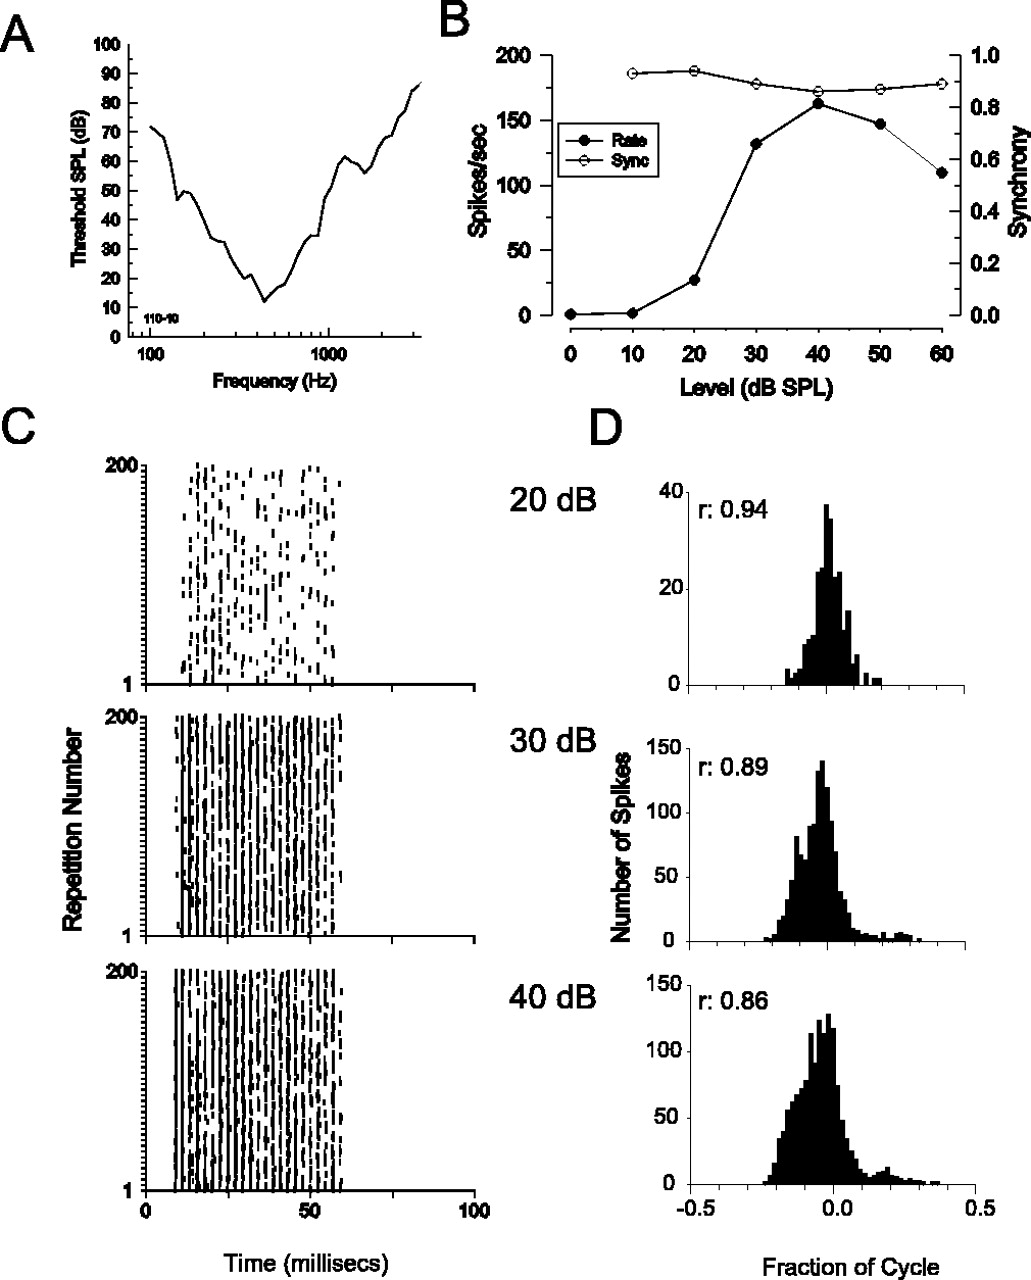
- Figure 2.
Phase-locked responses of a low-characteristic-frequency MNTB neuron to pure-tone stimuli. A, Frequency-threshold curve (characteristic frequency, 317 Hz). B, Both the discharge rate (left ordinate; filled circles) and response synchrony (Sync; right ordinate; open circles) increase with increasing level of a 50 ms duration characteristic frequency tone. Spontaneous rate is indicated by the dashed line (Spon; left ordinate). SPL, Sound pressure level. C, D, Dot rasters to 200 presentations of a 50 ms duration characteristic frequency tone (C) and associated period histograms (D) at three different stimulus levels. The responses are phase locked to the stimulus frequency, as evidenced by the tendency of spike times to line up vertically in the rasters (C) and for responses to occur at a particular phase angle resulting in peaked period histograms (D). The synchronization coefficients (r) of the responses in D are indicated in the inset. The time waveform of the characteristic frequency tone is shown below C.
- Figure 3.
Phase-locked responses of a low-characteristic-frequency LSO neuron to pure-tone stimuli. A-D, The same as in Figure 2, but, for a low-frequency LSO neuron stimulated with characteristic frequency (440 Hz; A), tones were presented to the excitatory ipsilateral ear only. The spontaneous rate for this neuron was 0 spikes/s. Note that because the response happened to fall near a stimulus phase of 0 cycles, the phase axis has been plotted from -0.5 to 0.5 cycles for ease of presentation. SPL, Sound pressure level; Sync, synchrony.
- Figure 4.
Low-frequency MNTB and LSO neurons exhibit phase locking to characteristic frequency tones that is enhanced over that seen in ANFs. Maximum (Max) synchronization coefficients are plotted as a function of the characteristic frequencies for MNTB (filled circles) and ipsilaterally stimulated LSO (Ipsi LSO; filled triangles) neurons from this study and from the population of ANF (small open circles) from the study by Johnson (1980). For characteristic frequencies <1.2 kHz, LSO and MNTB neurons showed higher synchrony than ANFs with similar characteristic frequencies but lower synchrony for characteristic frequencies >1.2 kHz. Note that data points from three MNTB neurons overlap near 1 kHz, and two overlap near 2 kHz at a synchronization coefficient of 0.6.
- Figure 5.
Example of a low-frequency (characteristic frequency, 440 Hz) LSO neuron that is sensitive to ILD and IPD. Same neuron as in Figure 3. A, Mean discharge rate as a function of ILD of characteristic frequency tones. ILD (bottom abscissa) was varied by fixing the level at the ipsilateral ear at 30 dB and changing the level of a simultaneously presented characteristic frequency tone to the contralateral ear (top abscissa). Consistent with IE binaural interaction, increases in the level of the contralateral tone inhibited ipsilaterally driven responses resulting in a sigmoidally shaped rate-ILD function. Error bars indicate ±1 SEM. B, Poststimulus time histograms (PSTHs; left column) to binaural beat stimuli created by presenting a tone at the stimulating frequency (top right, left column) to the ipsilateral ear and a tone at a frequency 1 Hz less to the contralateral ear. An example binaural beat (C, inset) is shown. IPD sensitivity is evidenced by the response modulation at 1 Hz. Period histograms (right column) were constructed from the PSTHs by binning the responses on the period of the beat frequency (1 s). As described in Materials and Methods, the period histograms were corrected by flipping them around the point of IPD of 0.5 cycles. Using this representation, responses were low when the tones to the two ears were in-phase (0.0 cycles) and increased when the tones were out-of-phase (0.5 cycles). Vector averaging of the period histograms for each stimulating frequency yields a mean interaural phase (ϕ; top left of panels in right column) and synchronization coefficient (r). Asterisks indicate significant (p < 0.001) phase locking to the 1 Hz beat frequency. C, Mean interaural phase (ϕb) from the binaural-beat stimuli (B) as a function of frequency. The CD and CP are estimated from the slope and y-intercept of the best-fitting line to the phase-frequency data (solid line) and are indicated in the top left of the panel. D, The IPD sensitivity of the neuron as expressed in the binaural-beat period histograms (B) can be converted to an equivalent ITD sensitivity by dividing the IPD by the stimulus frequency and reorganizing the abscissa, as indicated by the drop lines. Stimulus frequency was 400 Hz. The location of the CD is indicated with an arrow. The solid line in bottom panel shows a smoothed version of the data. IPSI or Ipsi, Ipsilateral; CONTRA or Contra, contralateral.
- Figure 6.
Example of a low-characteristic-frequency LSO neuron that is sensitive to ILDs and IPDs. A, Frequency-threshold curve (characteristic frequency, 566 Hz). B-D, The same as in Figure 5. ϕ, Mean interaural phase;ϕb, mean interaural phase from binaural-beat stimuli; *p < 0.001. E, Noise-delay function created by plotting the mean discharge rate as a function of the ITD of a broadband noise presented to the two ears with equal amplitude. Negative delays indicate that the contralateral stimulus lags the ipsilateral stimulus. Consistent with the CD (235 μs) and the CP (0.47 cycles) obtained from the binaural-beat stimulus for this neuron (C, D), the response minimum in the noise-delay function occurs at an ipsilateral delay of 200 μs, which is near the delay of 235 μs predicted from the CD. At the CD, the ipsilateral excitation and the contralateral inhibition arrive coincidentally at the LSO neuron, resulting in maximal inhibition. Error bars in B and E represent ±1 SEM. SPL, Sound pressure level; IPSI or Ipsi, ipsilateral; CONTRA or Contra, contralateral.
- Figure 7.
Another example of a low-characteristic-frequency LSO neuron that is sensitive to IPDs and ITDs in broadband noise stimuli. A, Frequency-threshold curve (characteristic frequency, 1.35 kHz). B-D, Same as in Figure 6, C and D. Here, the noise delay function has a response minimum for an ITD of 0 μs, compared with the delay predicted from the CD of -299 μs computed from B and C.ϕ, Mean interaural phase;ϕb, mean interaural phase from binaural-beat stimuli; *p < 0.001. Error bars represent ±1 SEM. SPL, Sound pressure level; Contra, contralateral; Ipsi, ipsilateral.
- Figure 8.
Phase-frequency (A) and ILD (B) functions for the population of low-characteristic-frequency LSO neurons. In support of the hypothesis that low-characteristic-frequency LSO neurons can be sensitive to IPDs and ILDs in manner consistent with IE binaural interaction, the phase-frequency functions of these neurons yield CPs near 0.5 cycles (A), and all neurons tested were sensitive to ILD (B). ϕb, Mean interaural phase from binaural-beat stimuli. Error bars represent ±1 SEM. Ipsi, Ipsilateral; Contra, contralateral.


