

Abstract
We examined the frontal lobe connections of the digit representations in the primary motor cortex (M1), the dorsal premotor area (PMd), and the ventral premotor area (PMv) of cebus monkeys. All of these digit representations lie on the lateral surface of the hemisphere. We used intracortical stimulation to identify the digit representations physiologically, and then we injected different tracers into two of the three cortical areas. This approach enabled us to compare the inputs to two digit representations in the same animal. We found that the densest inputs from the premotor areas to the digit representation in M1 originate from the PMd and the PMv. Both of these premotor areas contain a distinct digit representation, and the two digit representations are densely interconnected. Surprisingly, the projections from the digit representation in the supplementary motor area (SMA) to the PMd and PMv are stronger than the SMA projections to M1. The projections from other premotor areas to M1, the PMd, and the PMv are more modest. Of the three digit areas on the lateral surface, only the PMv receives dense input from the prefrontal cortex. Based on these results, we believe that M1, the PMd, and the PMv form a densely interconnected network of cortical areas that is concerned with the generation and control of hand movements. Overall, the laminar origins of neurons that interconnect the three cortical areas are typical of “lateral” interactions. Thus, from an anatomical perspective, this cortical network lacks a clear hierarchical organization.
- brain mapping
- dorsal premotor area
- hand
- prefrontal cortex
- primary motor cortex
- ventral premotor area
Introduction
There is now general agreement that the primary motor cortex (M1) receives input from six premotor areas in the frontal lobe (Dum and Strick, 1991a,b, 1996a, 2002; Morecraft and Van Hoesen, 1992; Tokuno and Tanji, 1993; Lu et al., 1994; Hatanaka et al., 2001). Furthermore, each of these premotor areas also projects directly to the spinal cord (Dum and Strick, 1991a,b, 1996b, 2002; He et al., 1993, 1995; Galea and Darian-Smith, 1994; Morecraft et al., 1997). This basic information has led to a dramatic change in our concepts about the functional organization of the cortical motor areas (Dum and Strick, 1991a,b, 1996a, 2002; Picard and Strick, 1996; Hoshi and Tanji, 2004).
Despite this new information, many important questions about the anatomical organization of the cortical motor areas remain unanswered. For example, there has been confusion and controversy about the presence of hand representations in each of the premotor areas (Kurata et al., 1985; Strick, 1985; Kurata and Tanji, 1986; Mitz and Wise, 1987; Luppino et al., 1991; He et al., 1993, 1995; Tokuno and Tanji, 1993; Godschalk et al., 1995; Hatanaka et al., 2001, 2003; Dum and Strick, 2002; Raos et al., 2003). In addition, the pattern of interconnections between the premotor areas has been unclear (Godschalk et al., 1984; Matelli et al., 1986; Barbas and Pandya, 1987; Dum and Strick, 1991a, 1993; Kurata, 1991; Morecraft and Van Hoesen, 1992, 1993; Luppino et al., 1993, 2003; Ghosh and Gattera, 1995; Hatanaka et al., 2003; Morecraft et al., 2004). Furthermore, the hierarchical relationships among the premotor areas and M1 have yet to be determined (Felleman and Van Essen, 1991). The answers to these and similar questions are likely to provide fundamental insights into the participation of the premotor areas in the generation and control of movement.
To begin to address these issues, we examined the interconnections between the digit representation in M1 and the digit representations of the two premotor areas on the lateral surface of the hemisphere, the dorsal premotor area (PMd) and the ventral premotor area (PMv). We performed our experiments in cebus monkeys because the digit representations in M1, the PMd, and the PMv are mostly exposed on the cortical surface, which greatly facilitates their analysis. In contrast, large portions of the digit representations in these cortical areas are buried in the sulci of macaques (Woolsey et al., 1952; Kwan et al., 1978; Dum and Strick, 1991b, 2002). In addition, cebus monkeys are of interest because they are highly dextrous and capable of manufacturing and using tools at a level comparable with the great apes (Fragaszy, 1983; Westergaard and Fragaszy, 1987).
Our results show that the densest inputs from the premotor areas to the digit representation in M1 originate from the PMd and the PMv. Both of these premotor areas contain distinct digit representations that are densely interconnected. Surprisingly, the projections from the digit representation in the supplementary motor area (SMA) to PMd and PMv are stronger than the SMA projections to M1. The projections from other premotor areas into the M1, PMd, and PMv network are more modest. Thus, we believe that M1, the PMd, and the PMv form a densely interconnected network of cortical areas that is concerned with the generation and control of hand movements. Furthermore, our anatomical analysis of this network indicates that it lacks a clear hierarchical organization.
Some of these results have been reported in preliminary form (Dum and Strick, 1997, 2003).
Materials and Methods
We used six monkeys for these experiments (Cebus apella; 1.2-3.5 kg) (Table 1). In the first set of experiments, we used retrograde tracers to identify the location of the arm representations of the premotor areas in the frontal lobe of the cebus monkey. To do this, we performed two complementary experiments. In two animals, we identified the premotor areas by retrograde transport of a tracer from the arm or digit area of M1 (Muakkassa and Strick, 1979; Dum and Strick, 1991a,b). In another animal, we identified the premotor areas by injecting a retrograde tracer into lower (C7-T1) cervical segments of the spinal cord.
Experimental protocols
In the second set of experiments, we examined the extrinsic cortical inputs to the digit representations in the PMv, PMd, and M1. In three animals, we injected distinct retrograde tracers into the digit representations of two of the three motor areas found on the lateral surface of the hemisphere. These areas included the PMd (R12, R24), the PMv (R15, R24), and M1 (R12, R15). Our experiments complied with the National Institutes of Health Principles of Laboratory Animal Care and followed a protocol approved by our Institutional Committee for the Care and Humane Use of Animals.
Surgical procedures. Our methods for intracortical stimulation and tracer injections have been described fully in previous publications (Strick and Preston, 1982; Holsapple et al., 1991; He et al., 1993; Hoover and Strick, 1999). Briefly, the animals were pretreated with glycopyrrolate (0.05 mg/kg, i.m.) and were anesthetized with Telazol (initial dose: 20 mg/kg, i.m.; supplemental doses: 5-7 mg/kg/h, i.m.) (Schobert, 1987). An analgesic (butorphanol; 0.1-0.4 mg/kg, i.m.) was given every 2-4 h during surgery to reduce the amount of anesthetic needed. For the spinal cord injections, the animal was tranquilized with ketamine (15 mg/kg, i.m.) and anesthetized with Nembutal (intravenously). Additional doses of each drug were given as needed to maintain anesthesia. An antibiotic (Rocephin; 75 mg/kg, i.m.) and fluids (10-20 cc/h, i.v., during surgery) were administered. We monitored vital signs and maintained body temperature between 36 and 38°C.
All surgical procedures were performed under aseptic conditions. Once the animal was anesthetized, it was placed in a stereotaxic frame, and all incision lines were infiltrated with a long-lasting local anesthetic (e.g., buvipicaine). For cortical injections, an appliance was secured to its skull with small screws and dental acrylic. The appliance served as an atraumatic anchor to hold the animal's head during the stimulation phase of the experiment. A large craniotomy was performed over the appropriate cortical area, and the dura was opened. For the injections into the cervical cord, a laminectomy was performed to expose the C2-T1 segments. Exposed neural tissue was protected from desiccation with warmed surgical-grade silicone.
Physiological mapping. We used parylene-coated Elgiloy microelectrodes (impedance, 0.6-1.4 MΩ at 1 kHz) to deliver intracortical stimuli (Suzuki and Azuma, 1976; Loeb et al., 1977). The site of each microelectrode penetration was verified by observation through a dissecting microscope and was marked on an image of the brain displayed on a computer monitor (see below). A constant current stimulator was used to deliver cathodal pulses (12-32 pulses, 0.2 ms duration, 333 Hz, 1-50 μA intensity) at a standard depth of 1500 μm. Stimulus intensity was monitored with an isolated current probe that measured the current passing through the wire to the microelectrode.
The motor response evoked by intracortical stimulation was determined by visual observation and muscle palpation. The response at each site was defined as the movement or muscle contraction that was evoked at threshold, the stimulus intensity at which the response occurred on 50% of the trials. The results of physiological mapping were entered into a custom-designed computer database. First, we captured an image of the brain surface with a video camera coupled with the computer. Then, the site of each electrode penetration, the depth of stimulation, the type of movement evoked, and its threshold were entered and stored in the computer. This information allowed the computer to generate maps of the location of motor responses in relation to cortical gyri and sulci.
Tracer injection. Once a cortical area was mapped, we used a Hamilton syringe with a 28 gauge needle to inject one of the following tracers: wheat germ agglutinin (WGA)-HRP (10% in 0.5 m NaCl with 0.1 m mannose; 0.05 μl per injection), diamidino yellow (DY; 2% in distilled water; 0.4 μl per injection), or fast blue (FB; 5% in distilled water; 0.3 μl per injection). Injections were spaced ∼1 mm apart, except to avoid blood vessels. Tracers were injected at a depth of 1.5 mm over gyri and, in addition, at 2.5 and 3.5 mm in the central sulcus. Tracer injections into the spinal cord were angled to pass through the dorsal columns and injected at two depths based on a map of the gray matter in the cervical spinal cord. Injections were placed at two depths but used less volume than in the cortical injections (FB; 0.2 μl). The needle was allowed to remain in place for 3 min after each injection.
When the injections were completed, the exposed neural surface was covered with dura and SILASTIC. The incision was closed in anatomical layers. A long-lasting analgesic (buprenorphine; 0.01 mg/kg, i.m.) was given at the end of surgery. Dexamethasone was administered to control potential edema of the brain.
Tissue processing. After a 3 d (WGA-HRP) or 12 d (fluorescent tracers) survival period, each animal was tranquilized (ketamine; 25 mg/kg, i.m.), deeply anesthetized (Nembutal; 36 mg/kg, i.p.), and perfused transcardially using a multi-stage procedure (Rosene and Mesulam, 1978; Mesulam, 1982). For the experiment with WGA-HRP, the perfusates included the following: (1) 0.1 m phosphate buffer, pH 7.4; (2) 3% paraformaldehyde in 0.1 m phosphate buffer; (3) 3% paraformaldehyde in 0.1 m phosphate buffer with 10% glycerin; and (4) 0.1 m phosphate buffer with 10% glycerin. For experiments using fluorescent dyes, the perfusates included the following: (1) 0.1 m phosphate buffer, pH 7.4; (2) 10% formalin in 0.1 m phosphate buffer; and (3) 10% formalin in 0.1 m phosphate buffer with 10% glycerin. The brain was blocked and stored at 4°C with 20% glycerin added as a cryoprotective agent (Rosene et al., 1986). We cut serial frozen sections (50 μm) in the coronal plane of a large brain block that extended from the rostral pole to the end of the parietal-occipital sulcus caudally. Every 10th section was processed for cytoarchitecture using a stain for Nissl substance [Gower technique (Mesulam, 1982)]. We used the tetramethylbenzidine method (Mesulam, 1982; Gibson et al., 1984) to identify neurons labeled by WGA-HRP.
Analysis of anatomical data. Every fourth section (GB3, R12, R14, R15) or every eighth section (R24) was examined for labeled neurons using a light microscope and epifluorescence illumination (Leitz filter D; Leitz, Wetzlar, Germany). WGA-HRP-labeled neurons were identified with dark-field, polarized light microscopy. Injection sites, section outlines, and labeled cells were plotted using a computer-based charting system (MD2; AccuStage, Shoreview, MN). This system uses two optical encoders that are coupled with the microscope stage to digitize the coordinates of selected features. We operationally defined the injection site as the central zone containing the injected tracer (zone 1) and the surrounding region of intense staining of neurons, glia, and neuropil (zone 2) (Huisman et al., 1983; Kuypers and Huisman, 1984; Conde, 1987; He et al., 1993). Animals included in this analysis had injection sites that (1) were confined to the relevant portion of a motor area and (2) remained at least 0.5 mm away from borders with other functional areas. The extent of the injection site was compared with the location of the identified digit representation by superimposing the outline of the reconstructed injection site (Fig. 1) over the map of movements evoked at each penetration site. Reconstructed injection sites (shading) were then fitted, with adjustments for shrinkage, rotation, and parallax, to a tracing of the digital image of the cortical surface.

Localization of cortical injection sites. The digit representations of M1, the PMd, and the PMv were mapped using intracortical stimulation. Then, we injected FB into one digit representation and DY into another digit representation. A, The dashed box on a cebus monkey brain delineates the region magnified in B-D. B, Animal R12 with injection sites in the PMd and M1. The injection site outlines indicate the extent of zones 1 and 2 (see Materials and Methods for additional details). The symbols indicate the movement evoked at each site and its threshold (large, <5 μA; medium, 5-10 μA; small, >10 μA). C, Animal R15 with injection sites in the PMv and M1. D, Animal R24 with injection sites in the PMd and PMv. ArS, Arcuate sulcus; CS, central sulcus; IPS, intraparietal sulcus; LS, lateral sulcus; PS, principal sulcus.
The charts of individual sections were aligned interactively on the computer. Sections were unfolded and used to construct two-dimensional maps of the cortex that indicated the location of labeled neurons and the injection site in relation to morphological features (Dum and Strick, 1991b; He et al., 1993, 1995). The labeled neurons located in all cortical layers, the injection site, and morphological markers were collapsed onto a line drawn between layers 3 and 5. This line and associated symbols were unfolded and then divided into 200 μm bins. The number of neurons labeled with each tracer was determined for every bin.
For each cortical injection, we counted the number of labeled neurons found in the ipsilateral hemisphere and calculated the percentage of these neurons that were located in individual cortical areas. The two cortical areas that were injected with tracer were not included in these calculations. In every animal, the average number of DY-labeled neurons per 200 μm bin was greater than the average of FB neurons per bin. Overall, the mean density of DY neurons per bin was significantly higher than the mean density of FB neurons per bin (7.7 ± 0.72 DY cells/bin vs 6.1 ± 0.57 FB cells/bin; p = 0.012; paired t test; t = 5.515). Consequently, we injected a cortical area with DY in one experiment and FB in another to ensure that variations in tracer efficiency did not influence the results.
We examined overlap in the distributions of DY and FB neurons in specific cortical areas by determining the numbers of each type of labeled neuron within 200 μm bins. Bins that contained normalized densities of ≥6 cells/bin for both DY and FB neurons were considered “overlap” bins. The value of ≥6 cells/bin was chosen because this density includes ∼80% of all labeled cells in each animal and prevents the amount of overlap from being dominated by sparse, scattered labeling.
Results
Identification of the premotor areas in the cebus monkey
In the past, we have operationally defined the premotor areas in the macaque as those regions in the frontal lobe that project directly to M1 (Muakkassa and Strick, 1979; Strick, 1985; Dum and Strick, 1991a,b, 2002). We used the same approach in this study to identify the premotor areas in the cebus monkey. In one animal, we injected WGA-HRP into a large portion of the arm representation in M1 (Fig. 2A). The injection site included part of the precentral gyrus and the anterior bank of the central sulcus. The injected region involved sites where intracortical stimulation evoked movements of the digits (57% of the sites), wrist (28% of the sites), and elbow/shoulder (15% of the sites).

Six premotor areas in the frontal lobe of the cebus monkey. A, Projections to M1. The unfolded map of the frontal lobe depicts the density of neurons labeled after WGA-HRP injections into the arm representation of M1 (see Materials and Methods) (Dum and Strick, 1991b). The extent of tracer spread at the injection site is delineated by green shading, and the surrounding region where labeled neurons were too dense to plot is indicated by gray shading. The medial wall is unfolded and reflected upward from the midline. The lip of each sulcus is represented by a solid line, and its fundus is indicated by a dashed line. The density of labeled neurons was determined by counting the number of labeled cells within 200 μm bins along every fourth section. The number of cells per bin was divided into five levels and color-coded: white, top 5% of bins (95-100%); yellow, 90-95%; red, 80-90%; large blue squares, 40-80%; small blue squares, 0-40%. B, Projections to the spinal cord. The unfolded map of the frontal lobe depicts the density of neurons labeled after fluorescent tracer injections into the lower cervical segments (C7-T1) of the spinal cord. Each of the six premotor areas shown in A projects to the spinal cord. The number of cells per bin was divided into five levels and color-coded as described above. CC, Corpus callosum; CgSd, dorsal bank of the cingulate sulcus; CgSv, ventral bank of the cingulate sulcus; CgG, cingulate gyrus; SGm, medial portion of the superior frontal gyrus. Other abbreviations and conventions are as in Figure 1.
This approach identified six separate premotor areas in the frontal lobe of the cebus monkey (Fig. 2A). These areas appear homologous to the six premotor areas found in macaques. Two of these premotor areas are located in area 6 on the lateral surface of the hemisphere rostral to M1. The PMv lies just caudal to the inferior limb of the arcuate sulcus. The arm representation of the PMv in the cebus monkey is entirely exposed on the cortical surface, whereas in the macaque, a large portion of the arm representation is buried in the posterior bank of the arcuate sulcus [F5 according to Rizzolatti et al. (1988); rostral PMv according to Hepp-Reymond et al. (1994)] (Muakkassa and Strick, 1979; Martino and Strick, 1987; Dum and Strick, 1991a,b, 2002). The second premotor area on the lateral surface is the PMd [F2 according to Matelli et al. (1985); caudal PMd according to Ghosh and Gattera (1995)] (Tanne et al., 1995). When the superior precentral sulcus (SPcS) is present, the arm representation of the PMd lies lateral to it. However, the SPcS is not as deep in the cebus as in the macaque. Thus, the arm representation in the PMd, like that in the PMv, is entirely exposed on the cortical surface of the cebus monkey. It is notable that the PMd appears to be immediately adjacent to M1.
Four of the premotor areas in the cebus monkey are located on the medial wall of the hemisphere (Fig. 2A). These premotor areas include the SMA in the medial portion of area 6 on the superior frontal gyrus and three premotor areas that are primarily buried in the cingulate sulcus. A dorsal cingulate motor area (CMAd) is located caudal to the SMA on the dorsal and ventral banks of the cingulate sulcus. The portion of the CMAd that is on the dorsal bank near the fundus of the sulcus provides especially dense input to the arm representation in M1 (Fig. 2A). A ventral cingulate motor area (CMAv) is located entirely on the ventral bank of the cingulate sulcus at the same rostrocaudal level as the SMA (Fig. 2A). A rostral cingulate motor area (CMAr) is located on the dorsal and ventral banks of the cingulate sulcus at levels rostral to the SMA and rostral to the genu of the arcuate sulcus. Overall, the locations and arrangement of these premotor areas are quite similar to the premotor areas in macaques (Muakkassa and Strick, 1979; Strick, 1985; Dum and Strick, 1991a,b, 2002; Lu et al., 1994; He et al., 1995).
In three animals, we injected tracers into the digit representation in M1 to define the location of the digit representations in each of the premotor areas (Figs. 1, 3, 4). The injection site in each animal was defined using intracortical stimulation of the precentral gyrus, which contains a substantial portion of the digit representation in the cebus monkey (Figs. 1B,C). The spread of tracer was confined in almost every instance to a territory where stimulation evoked digit movements (Fig. 1B,C). Thumb movements were evoked most frequently in this region [71% of the movements evoked in R12 (Fig. 2B), 59% in R15 (Fig. 2C), and 40% in R14 (data not shown)]. The average threshold for evoking movement in the digit representation of M1 was 6 μA.

Frontal lobe input to the digit representations of M1 and PMd (R12). A, Location and density of neurons labeled after DY injections into the digit representation of M1. Yellow shading around the injection site in M1 indicates zones 1 and 2 of the spread of the DY. The region surrounding the injection sites where neurons were too dense to plot is indicated by gray shading. B, Location and density of neurons labeled in the frontal lobe after FB injections into the digit representation of the PMd. Blue shading around the injection site in the PMd indicates zones 1 and 2 of the spread of FB. C, Overlap of the input to the digit representations of the PMd and M1. Red shading (overlap bins) indicates bins that have a high density of cells projecting to each injection site. Yellow shading represents bins that have a high density of cells projecting to M1. Blue shading represents bins that have a high density of cells projecting to the PMd. See Materials and Methods for additional details. Abbreviations and conventions are as in Figures 1 and 2.

Frontal lobe input to the digit representations of M1 and the PMv (R15). A, Location and density of neurons labeled after FB injections into the digit representation of M1. B, Location and density of neurons labeled after DY injections into the digit representation of the PMv. C, Overlap of the input to the digit representations of the PMv and M1. Red shading (overlap bins) indicates bins that have a high density of cells projecting to each injection site. Blue shading represents bins that have a high density of cells projecting to M1. Yellow shading represents bins that have a high density of cells projecting to the PMv. Abbreviations and conventions are as in Figures 1 and 2.
The distribution of labeled neurons after tracer injections into the digit representation of M1 indicates that each of the premotor areas contains a digit representation (i.e., a localized region that projects to the M1 digit representation) (Figs. 3A, 4A). The largest digit representations in the premotor areas are located in the PMv, PMd, and SMA. Less substantial digit representations are located in the cingulate motor areas. The digit representation in the PMv is centered ∼13 mm anterior to the central sulcus and 5 mm lateral to the spur of the arcuate sulcus. This location separates the digit representation of the PMv from that in M1 by >6 mm (Fig. 1C,D). Similarly, the digit representation in the PMd is centered ∼9 mm rostral to the central sulcus and 5 mm medial to the spur of the arcuate sulcus (Fig. 1B,D). Overall, there is a close correspondence between the digit representations defined by this anatomical approach and the regions of the PMv and PMd where digit movements can be evoked using low-threshold intracortical stimulation (Fig. 1B-D).
In previous studies in macaques, we found that each of the premotor areas in the frontal lobe projected not only to M1 but also directly to the spinal cord (Dum and Strick, 1991a,b, 2002; He et al., 1993, 1995). Therefore, as another approach to define the location and extent of the premotor areas, in one cebus monkey we injected a fluorescent tracer (FB) into lower cervical segments (C7-T1) of the spinal cord. We found many labeled neurons in the arm area of M1 and in each of the arm representations of the six premotor areas (Fig. 2B). Altogether, 49.1% of the total number of corticospinal neurons in the frontal lobe were found outside of M1 in this animal. Major accumulations of labeled neurons were found in the PMd (18.9% of total), SMA (12.4% of total), and CMAd (8.3% of total). Less substantial populations of labeled neurons were found in the PMv (4.4% of total), CMAv (2.7% of total), and CMAr (2.3% of total). Thus, the premotor areas in the cebus monkey, like in the macaque (Dum and Strick, 1991b, 1996a; He et al., 1995), contribute approximately half of the corticospinal neurons that originate in the frontal lobe.
It should be noted that the vast majority of dense corticospinal projections from M1 to the lower cervical segments originates from the surface of the precentral gyrus in the cebus monkey, whereas in the macaque, the major portion of the hand representation in M1 is buried in the anterior bank of the central sulcus (Kwan et al., 1978; Dum and Strick, 1991b, 2002; He et al., 1993; Park et al., 2001). Thus, the hand representations in M1, as well as in PMd and PMv, are all exposed on the lateral surface of the hemisphere in cebus (Figs. 1, 2). Although the arm representations of the motor areas in the cebus and macaque monkey differ in their location relative to morphological landmarks, the spatial arrangement of their motor areas exhibits a remarkable correspondence when each is viewed on a flattened map of the cortex (Dum and Strick, 2002). Thus, on the basis of corticospinal and corticocortical connections, the organization and arrangement of the cortical motor areas in the cebus monkey and macaque appear to be quite similar.
Cortical inputs to the lateral premotor areas
One of the major goals of these experiments was to examine the connectivity between the digit representation in M1 and the digit representations in the two premotor areas on the lateral surface of the hemisphere, the PMv and PMd. Using a dual tracer approach, we performed three sets of comparisons: in one animal we compared inputs to M1 and the PMd (R12), in a second animal we compared the inputs to M1 and the PMv (R15), and in a third animal we compared inputs to PMv and PMd (R24). In each case, we identified the relevant digit representations using intracortical stimulation. Then, a different fluorescent tracer (DY or FB) was injected in each of the two areas (Figs. 1, 3, 4, 5; Table 1).

Frontal lobe input to the digit representations of the PMd and PMv (R24). A, Location and density of neurons labeled after FB injections into the digit representation of the PMv. B, Location and density of neurons labeled after DY injections into the digit representation of the PMd. C, Overlap of the input to the PMd and PMv. Red shading (overlap bins) indicates bins that have a high density of cells projecting to each injection site. Blue shading represents bins that have a high density of cells projecting to PMv. Yellow shading represents bins that have a high density of cells projecting to the PMd. Abbreviations and conventions are as in Figures 1, 2, 3, 4.
In every case, the injection sites in the premotor areas involved major portions of each digit representation (Fig. 1). In some cases, the injection site involved a portion of the arm and shoulder representations as well. For example, in one PMv animal (R24), movements of the digits were evoked at 100% of the stimulation sites within the region containing tracer (Fig. 1D). In the other PMv animal (R15), movements of the digits were evoked at 74% of the stimulation sites (Fig. 1C). Tracer spread in this animal to include an adjacent region where stimulation evoked shoulder and orofacial movements at higher threshold. Similarly, in one PMd animal (R24), movements of the digits were evoked at 86% of the stimulation sites within the region containing tracer (Fig. 1D), whereas in the other PMd animal (R12), movements of the digits were evoked at only 29% of the sites, and tracer spread in this animal to include a region where stimulation evoked elbow and shoulder movements (Fig. 1B). In general, the average threshold for evoking digit movements from the PMd (13 μA) and PMv (21 μA) was two to three times that for evoking movements from M1 in the same animals.
Interconnections among the motor areas on the lateral surface
M1 receives its strongest inputs from the digit representations in the PMd and PMv (Figs. 3A, 4A, 6; Table 2). Likewise, the digit representations of both the PMd and the PMv receive their strongest corticocortical input from M1 (Figs. 5, 6, 7). The same general region of M1 on the precentral gyrus projects to the digit representations of the PMd and PMv (Figs. 5, 7). In contrast, the small portion of M1 that is buried in the anterior bank of the central sulcus does not project densely to digit PMd and PMv (data not shown). M1 neurons that project to both the PMd and PMv are rare (0.2% of the labeled neurons). Instead, the digit representation in M1 contains local regions with neurons that project mostly to the PMd, mostly to the PMv, or to “overlap” regions where neurons that project to the PMd and PMv are intermingled (Figs. 5C, 7).

Normalized strength and density of input from cortical areas in the frontal lobe to the digit representations of M1, the PMd, and the PMv. The strength (numbers of labeled neurons in an area) and density (average number of labeled neurons per bin in an area) were normalized to the cortical area with the most labeled cells or the highest density. The minimum relative strength included equals 0.01. The lowest possible value for the normalized density (equivalent of 1 cell per bin) is indicated (dashed line marked by arrow). Light shading indicates cortical motor areas. Dark shading indicates prefrontal areas.
Average percentage of labeled neurons in each area

M1 neurons that project to the PMd (black circles) or to the PMv (open circles). The region enclosed by the dashed box on the left is enlarged on the right. Double-labeled neurons (gray circles) are indicated only in the enlargement. Note the intermingling of the two types of neurons and their common laminar origin. The level of this section is marked in Figure 5. CgS, Cingulate sulcus; CS, central sulcus.
The digit representations of the PMd and PMv also are densely interconnected with each other (Figs. 3, 4, 6). The third largest input to the PMd originates from the PMv (Fig. 6, Table 2). Similarly, the third largest input to the PMv originates from the PMd (Fig. 6, Table 2). The regions of each premotor area that project to the digit representation of the other overlaps substantially with the regions that project to digit M1 (Figs. 3C, 4C). Still, few double-labeled neurons (∼0.2%) were present in any motor area. These results indicate that the digit representations in M1, the PMd, and the PMv form a densely interconnected network of cortical areas. However, this network is not based on branching neurons. Instead, mostly separate clusters of neurons interconnect different nodes in the network.
Inputs from the motor areas on the medial wall
The SMA is the major source of input from the medial wall to M1, the PMd, and the PMv. Overall, it provides the second strongest corticocortical input to the digit representations in the PMd and PMv and the third strongest input to M1 (Figs. 3, 4, 5, 6, Table 2). The origin of SMA projections to the PMd or PMv is always more extensive and completely engulfs the origin of those neurons projecting to M1 (Figs. 3C, 4C). All of the cingulate motor areas project to the digit representations in M1, the PMd, and the PMv. However, the only dense projection from the cingulate motor areas is from the CMAd to the digit representations in M1 and the PMd.
Based on the region of the SMA that projects most densely to the digit representations of M1 and the two premotor areas, the main part of the digit representation in the SMA is located ventrally on the superior frontal gyrus near the dorsal lip of the cingulate sulcus (Figs. 3, 4, 5, 8). The representation continues rostrally and dorsally on the medial wall, and a small patch extends onto the lateral surface. Using similar logic, the digit representation in the CMAd is generally located around the fundus of the cingulate sulcus. The precise location of this representation appears to vary among animals. In R12, the digit representation is entirely on the dorsal bank (Fig. 3), in R15 it is entirely on the ventral bank (Fig. 4), and in R24, it spans the fundus (Fig. 5). Even with this variation, dual tracer studies shows that the digit representation defined by projections to M1 is the same as that defined by projections to the PMd and PMv. In general, the digit representation in the CMAv is small and lies on the ventral bank of the cingulate sulcus (Figs. 3, 4). However, it can extend as far ventrally as the cingulate gyrus proper (Fig. 5). Again, dual tracer studies show that the same region of the CMAv projects to the digit representations of M1, the PMd, and the PMv. The digit representation in the CMAr also is small and is consistently located near the fundus of the cingulate sulcus (Figs. 3, 4, 5).

Prefrontal and SMA neurons that project to the digit representations of the motor areas on the lateral surface. Left, Labeled neurons in area 46 that project to the PMv (open circles) or to M1 (filled circles) are plotted on a coronal section through the caudal third of the principal sulcus (R15). Right, Labeled neurons in the SMA that project to the PMv (open circles) or to the PMd (filled circles) are plotted on a coronal section located just caudal to the genu of the arcuate sulcus (R24). The FB injection site in the PMv is delineated by gray shading, and the surrounding region of intensely labeled neurons is delineated by the dotted line. CgS, Cingulate sulcus; PS, principal sulcus; ArSp, spur of the arcuate sulcus. Calibration, 5 mm.
Inputs from rostral areas of frontal cortex
Two cortical areas located in rostral parts of the frontal cortex have dense projections to the digit representation in the PMv: the precentral opercular cortex (PrCO) (Roberts and Akert, 1963) and area 46 (Figs. 4, 5, 6) (Walker, 1940; Petrides and Pandya, 1994). Together, these cortical areas provide ∼13% of the input to the PMv (Fig. 6, Table 2). An indication of the importance of the input from the PrCO and area 46 to the PMv is that it is more than twice that from all of the cingulate motor areas. The projections from the PrCO originate from a region that is located just lateral to the PMv and extends ventrally to wrap onto the orbital cortex (Figs. 4B, 5A). The projections from area 46 originate from a compact region in the ventral (lateral) bank of the principal sulcus (Fig. 8). The digit representation in M1 and that in the PMd receive only very weak input from the PrCO and area 46 (Fig. 6, Table 2). In these cases, the input from area 46 originates mainly from the dorsal (medial) bank of the principal sulcus (Figs. 3, 4, 5, 8). Any other input from regions of the frontal cortex to the digit representations in M1, the PMd, and the PMv is weak and represents <1% of the total cortical input to these areas (Figs. 3, 4, 5, 6, Table 2). In fact, it is notable that the pre-PMd and the pre-SMA are not major sources of input to any of the digit representations we examined. These results suggest that the prefrontal cortex gains direct access to the cortical control of hand movements mainly through interactions with the PMv.
Laminar distribution of corticocortical connections
We analyzed the laminar origin of cortical neurons that project to M1, the PMd, and the PMv. We have expressed the results of this analysis as the percentage of labeled neurons that are located in the superficial cortical layers (I-III) (Fig. 9). We then characterized the laminar pattern as “Deep” (<33% in the superficial layers), “Equal” (33-67% in the superficial layers), or “Superficial” (>67% in the superficial layers). The major inputs to M1 from the motor areas in the frontal lobe (i.e., from the PMd, PMv, SMA, CMAd) are characterized by the Equal pattern. In contrast, the weak projections to M1 from the CMAv, CMAr, and PrCO fit the Deep pattern. The inputs to the PMd follow this overall plan. The strong inputs to the PMd from M1, the PMv, the SMA, and the CMAd are characterized by the Equal pattern. The weak projections to the PMd from the CMAv and CMAr fit the Deep pattern. The laminar organization of inputs to the PMv is more complex. However, the dense inputs to the PMv from M1, the PMd, and the SMA are characterized by the Equal pattern. Because the laminar patterns of the connections that link M1, the PMd, and the PMv are similar, our results suggest that these cortical areas are all at the same level of hierarchical processing (Rockland and Pandya, 1979; Friedman, 1983; Maunsell and Van Essen, 1983; Friedman et al., 1986; Felleman and Van Essen, 1991; Barone et al., 2000). It is interesting to note that the dense projections to the PMv from the PrCO and area 46 are characterized by the Deep pattern of laminar origin, whereas the weak input to the PMv from the CMAd fits the Superficial pattern. Although the directions of information flow specified by the Deep and Superficial patterns are uncertain, our findings suggest that these cortical areas are at different hierarchical levels of processing than the PMv.
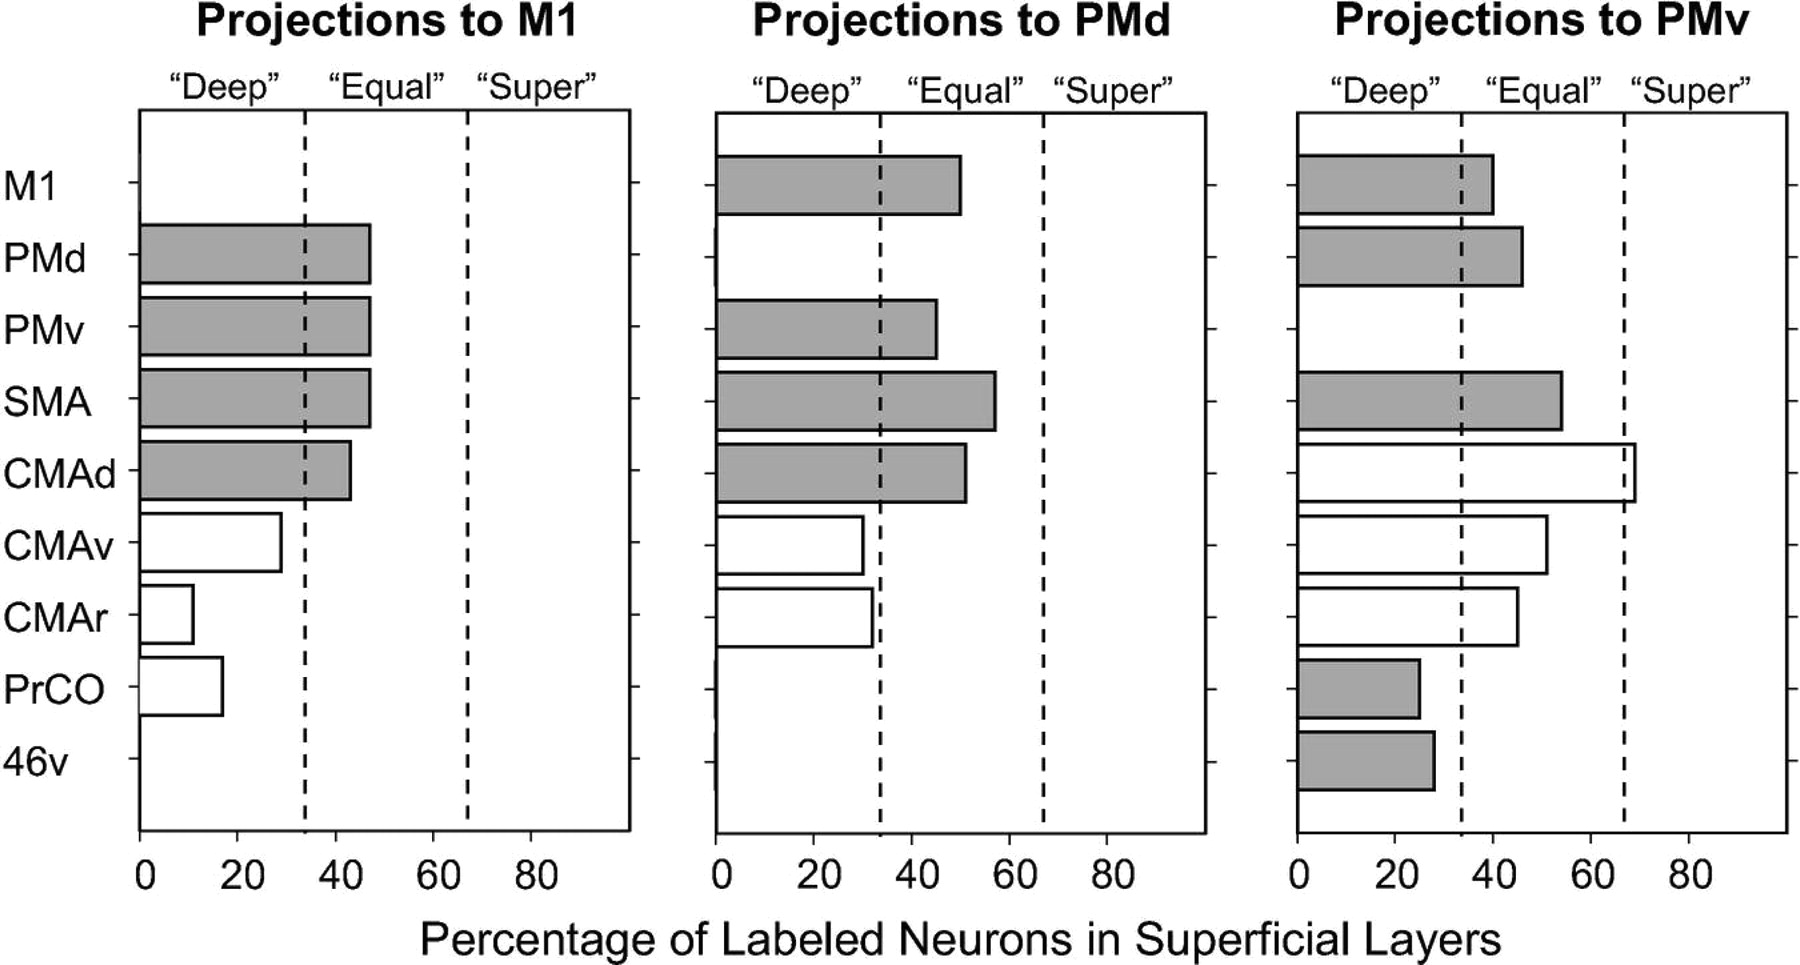
The laminar origin of cortical inputs to the digit representations in M1, the PMd, and the PMv. Deep connections are those in which labeled neurons located in deep layers (V-VI) are at least twice as numerous as those in superficial layers (II-III). Equal connections are those in which the number of neurons in superficial and deep layers are equivalent. Super connections are those in which neurons located in superficial layers are at least twice as numerous as those in deep layers. The shaded bars indicate cortical areas that have dense projections (normalized density of ≥0.5 in Fig. 6) to the injected motor area. See Results for details. Abbreviations are as in Figures 1 and 4.
Discussion
This study is the first to directly compare the corticocortical connections of the digit representations within the M1, PMd, and PMv. Three aspects of our methods were critical to this comparison. First, we used a dual tracer approach that enabled us to compare the inputs to two different cortical areas in the same animal. Second, we physiologically defined each injection site, which ensured that we examined the connections of cortical areas representing the same body part, the digits. Third, we performed this study in the cebus monkey, in which the majority of the digit representations in M1, the PMd, and the PMv are exposed on the cortical surface. This feature greatly facilitated mapping and injecting the digit representation in each cortical area.
Hand representation
The nature of body representation in the premotor areas has important implications for concepts about their function. The PMd was thought to be dominated by a representation of proximal arm musculature (Kurata and Tanji, 1986; Tokuno and Tanji, 1993; Johnson et al., 1996), whereas a prominent hand representation has been consistently found within the PMv (Rizzolatti et al., 1981, 1988; Kurata et al., 1985; Kurata and Tanji, 1986; He et al., 1993; Hepp-Reymond et al., 1994; Jeannerod et al., 1995; Dum and Strick, 2002; Cerri et al., 2003; Shimazu et al., 2004). This proposed dichotomy in their body representations contributed to the notion that the PMd and PMv were differentially involved in aspects of limb movement (Jeannerod et al., 1995; Caminiti et al., 1996, 1998; Johnson et al., 1996; Sakata et al., 1997; Wise et al., 1997; Shipp et al., 1998; Battaglia-Mayer et al., 2001; Rizzolatti and Luppino, 2001; Tanne-Gariepy et al., 2002). The PMd was thought to be concerned with control of the upper limb during the performance of reaching movements (Johnson et al., 1993, 1996; Caminiti et al., 1996, 1998; Wise et al., 1997; Battaglia-Mayer et al., 2001; Marconi et al., 2001). In contrast, the PMv was thought to be concerned with control of the hand, especially in grasping objects of different size and shape (Rizzolatti et al., 1988; Jeannerod et al., 1995; Sakata et al., 1997).
Our results suggest a different perspective. Intracortical stimulation in either the PMd or the PMv evoked hand movements (Rizzolatti et al., 1988; Hepp-Reymond et al., 1994; Godschalk et al., 1995; Dum and Strick, 2002; Cerri et al., 2003; Raos et al., 2003). In addition, both areas are interconnected with the hand area of M1. Thus, it is clear that both the PMd and the PMv have a distinct hand representation. We did not attempt to determine the entire body map within these two premotor areas, and consequently, we do not have any information about the relative size of proximal and distal arm representation in each region or potential overlap between proximal and distal arm representations. However, our data clearly indicate that the neural substrate exists for both the PMd and the PMv to be involved in the generation and control of hand movements.
The cortical network for the control of hand movements
There has been some doubt whether both the PMd and the PMv project to the digit representation in M1 (Tokuno and Tanji, 1993). Our observations confirm that both premotor areas are important sources of input to digit M1 (Muakkassa and Strick, 1979; Strick, 1985; Dum and Strick, 2002). Indeed, we show that together these two areas provide >70% of the input to M1 from cortical areas in the frontal lobe. The next largest cortical input to the digit representation in M1 originates from the SMA. However, the number of SMA neurons that contribute to this projection is less than one-half of that originating from either of the premotor areas on the lateral surface. When the inputs to M1 from all of the other areas in the frontal lobe are lumped together, they still do not equal the number of neurons in either the PMd or PMv that project to M1. These observations suggest that the PMd and PMv are the major sources of input from the frontal lobe to digit M1.
The extent of interconnections between the PMd and the PMv has also been the subject of considerable uncertainty (Godschalk et al., 1984; Matelli et al., 1986; Barbas and Pandya, 1987; Dum and Strick, 1991a; Kurata, 1991; Ghosh and Gattera, 1995). The present results clearly demonstrate that the digit representations of the PMd and PMv are densely interconnected. Furthermore, our quantitative analysis shows that the largest cortical input to the digit representations in the PMd and PMv originates from M1. Thus, our results indicate that the digit representations of these three cortical areas form a densely interconnected network for the generation and control of hand movements (Fig. 10).

Frontal lobe network for hand movements. The size of the arrows indicates the relative strength of an input. Shaded circles indicate motor areas on the lateral surface. Un-shaded circles are motor areas on the medial wall. The square indicates prefrontal areas of the cortex. Abbreviations are as in Figures 1 and 4.
How do the SMA and the cingulate motor areas fit into this network? Although the cingulate motor areas provide input to each of the motor areas on the lateral surface, their only dense input is from CMAd to M1 and the PMd, and even this input is numerically small (Figs. 6, 10; Table 2). On the other hand, the SMA has dense connections with all of the motor areas on the lateral surface, but, surprisingly, its projections to PMd and PMv are more substantial than its projections to M1. Thus, the SMA is a major component of the cortical network concerned with the control of hand movements, but its strongest influence seems to be exerted through connections with other premotor areas rather than through M1 (Fig. 10).
A related question is how the pre-SMA and pre-PMd fit into this network. We found few, if any, labeled neurons in either of these areas after tracer injections into the digit representations of PMd, PMv, or M1. Similar results have been reported by others (Matelli et al., 1986; Kurata, 1991; Tokuno and Tanji, 1993; Ghosh and Gattera, 1995; Hatanaka et al., 2001; Dum and Strick, 2002; Luppino et al., 2003) (but see Tachibana et al., 2004; Takada et al., 2004). Our results suggest that if the pre-SMA and pre-PMd are involved in the control of hand movements, their influence is not mediated by projections to the PMd, PMv, or M1. In fact, we have previously argued that the pre-SMA and pre-PMd should be considered more like regions of the prefrontal cortex than like premotor areas (Picard and Strick, 2001).
It is important to raise a number of cautions at this point in the discussion. The arguments in the preceding paragraphs have been based primarily on the number and density of neurons that project from one area to another. Certainly, other factors such as the laminar termination, the cell types influenced, and the overall efficacy of an input could have an important impact on our conclusions. In addition, various cortical areas could be active for different tasks or at different times during the same task (Aizawa et al., 1991; Mushiake et al., 1991; Picard and Strick, 1997; Shima and Tanji, 1998). As a consequence, there may be specific circumstances in which a modest input to a cortical area has an important impact on its function. Furthermore, our results are limited to an analysis of inputs to the digit representation in each cortical area and thus may not be reflective of the patterns of inputs to the representations of other body parts (Luppino et al., 1993; Tokuno and Tanji, 1993; Hatanaka et al., 2001). With these cautions in mind, two important trends emerge from our results: (1) the major sources of cortical influences on hand M1 originate from the PMd and PMv; and (2) the major sources of cortical influences on hand PMd and PMv originate from M1 and the SMA (Fig. 10).
Prefrontal input to the cortical network for hand movements
The only substantial inputs from the prefrontal cortex to this cortical network originate from the PrCO and the ventral portion of area 46. These two cortical areas are densely interconnected with other regions of the dorsolateral prefrontal and orbital frontal cortex (Barbas and Mesulam, 1985; Carmichael and Price, 1995; Pandya and Yeterian, 1996; Cipolloni and Pandya, 1999). Thus, the PrCO and ventral area 46 may provide important routes for cognitive processes (i.e., planning, working memory, etc.) to influence the control of limb movement. Interestingly, these inputs feed into a single node of the network, the PMv. Thus, our work confirms the results of previous studies that the PMv is the major target of input from the prefrontal cortex (Arikuni et al., 1980; Lu et al., 1994; Wang et al., 2003). However, the present study extends these results by demonstrating that this input can influence the control of hand movements through its connections with the PMv.
Hierarchical organization
Differences in the laminar origin and termination of the connections that link cortical areas with one another have been used as an indicator of the direction of information flow and hierarchical organization within sensory systems (Rockland and Pandya, 1979; Friedman, 1983; Maunsell and Van Essen, 1983; Friedman et al., 1986; Felleman and Van Essen, 1991; Barone et al., 2000). In the current study, we found that the neurons that interconnect M1, the PMd, and the PMv are almost equally distributed in the deep and superficial cortical layers (Fig. 9). In addition, the neurons in the SMA that project to M1, the PMd, and the PMv originate equally from deep and superficial layers. This laminar pattern is typical of “lateral” connections that are thought to interconnect areas of the visual cortex at the same level of hierarchical processing (Maunsell and Van Essen, 1983; Felleman and Van Essen, 1991). Whether the lateral designation is applicable to connections within the motor system is an open question (Webster et al., 1994). Nevertheless, the Equal laminar distribution of the neurons that interconnect the cortical motor areas suggests that there is no bias in the direction of information flow between M1, the PMd, and the PMv.
As noted in the Introduction, there has been a dramatic change in our concepts about the organization of the cortical motor areas. In the past, M1 was viewed as the “upper motoneuron” or the final common pathway for the central control of movement (for references and discussion, see Dum and Strick, 1991b, 1996a). According to this view, cortical areas in the frontal and parietal lobes as well as subcortical sites were thought to influence the generation and control of movement primarily through their connections with M1.
Recent observations on the premotor areas have led us to emphasize another perspective. It is now clear that the frontal lobe contains multiple premotor areas (Muakkassa and Strick, 1979; Rizzolatti and Luppino, 2001). Each premotor area receives a unique pattern of parietal and frontal lobe inputs and participates in distinct subcortical loops with the basal ganglia and cerebellum (for review, see Dum and Strick, 2005). In addition, we found that each premotor area projects not only to M1 but also directly to the spinal cord (Dum and Strick, 1991b; He et al., 1993, 1995; Galea and Darian-Smith, 1994; Morecraft et al., 1997). Indeed, efferents from some of the premotor areas make direct connections with motoneurons (Dum and Strick, 1996b; Maier et al., 2002). Thus, the premotor areas have the potential to influence spinal cord mechanisms and motor output through pathways that are independent of M1. In this respect, the premotor areas can be viewed as operating at the same level of hierarchical organization as M1.
Our current results on corticocortical connections provide additional support for this perspective. M1, the PMd, and the PMv form a densely interconnected network in which the direction of information flow is as likely to be from M1 to the premotor areas as it is from the premotor areas to M1. Ultimately, we believe that the premotor areas serve a dual function by providing important sources of input not only to M1 but also to the spinal cord. However, just as the premotor areas differ in their access to M1, they also differ in their access to the spinal cord. For example, the anatomical and physiological substrate exists for corticospinal efferents from the SMA to influence hand motoneurons directly (Dum and Strick, 1996b; Maier et al., 2002). In contrast, corticospinal efferents from the PMv (F5) appear to have a more limited direct access to hand motoneurons (Martino and Strick, 1987; He et al., 1993; Shimazu et al., 2004). Understanding the differential contributions of corticocortical and corticospinal modes of operation for the central control of movement remains a daunting challenge for future studies.
Footnotes
This work was supported by the Veterans Affairs Medical Research Service and by United States Public Health Service Grant 24328 (P.L.S.). We thank M. Page for the development of computer programs and M. Evans, S. Fitzpatrick, K. Hughes, and M. O'Malley for expert technical assistance. Dr. Gregory Bortoff participated in one of the experiments.
Correspondence should be addressed to Dr. Peter L. Strick, University of Pittsburgh, W1640 Biomedical Science Tower, 200 Lothrop Street, Pittsburgh, PA 15261. E-mail: strickp{at}pitt.edu.
Copyright © 2005 Society for Neuroscience 0270-6474/05/251375-12$15.00/0


