

Article Figures & Data
Figures
- Figure 1.
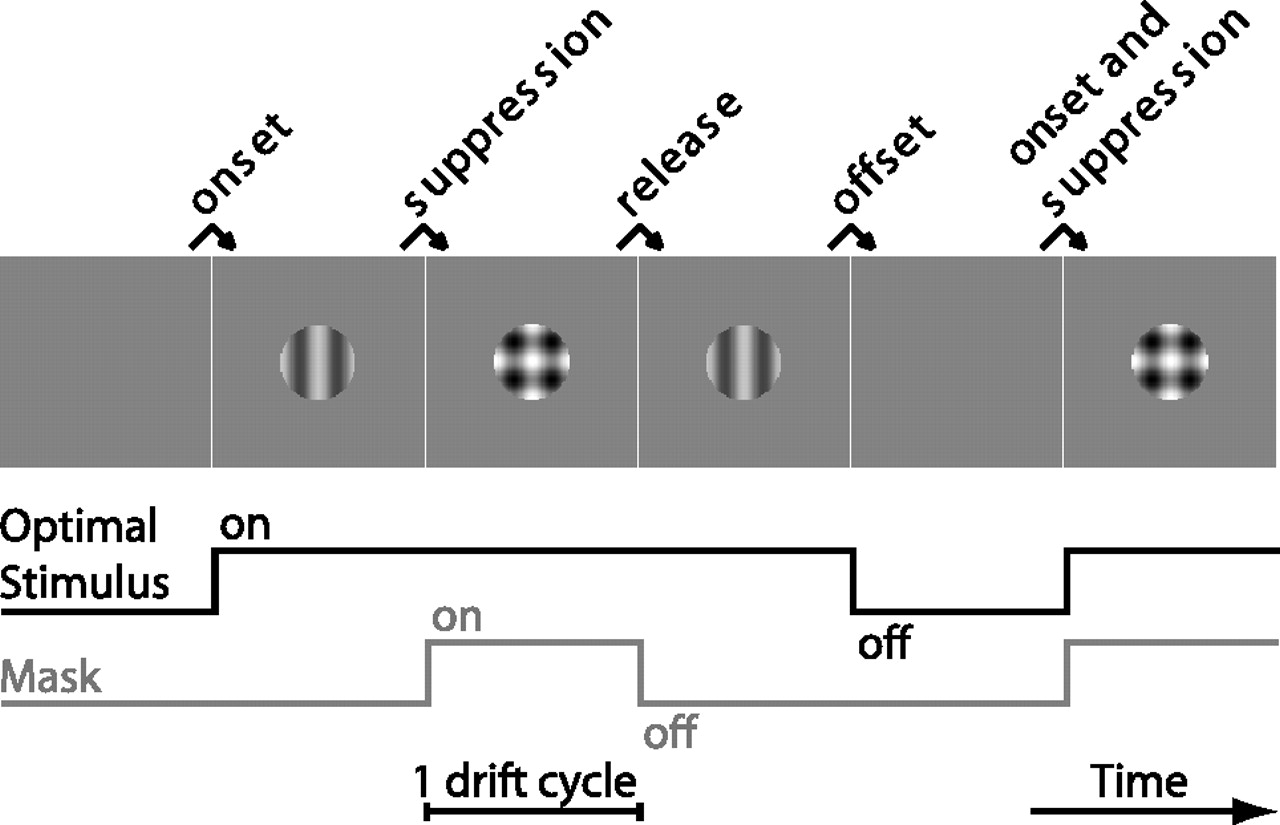
Testing suppression with dynamic stimuli. We used a novel stimulus to test cross-orientation suppression. Each grating was at 50% contrast, smoothly drifting, and could be in either a preferred or an orthogonal orientation. In this case, after each cycle of drift, the optimal and mask grating were randomly chosen to either be present or absent. This created four possible stimuli: a blank screen, a preferred grating or an orthogonal grating at 50% contrast, or a plaid at 100% contrast. We labeled the transitions in which the preferred grating was added or removed while the orthogonal grating was absent as “onset” and “offset.” If the preferred optimal grating was present, the addition or removal of the orthogonal mask were labeled “suppression” and “release.” Changing from a blank to the plaid stimulus was termed “onset and suppression.”
- Figure 2.
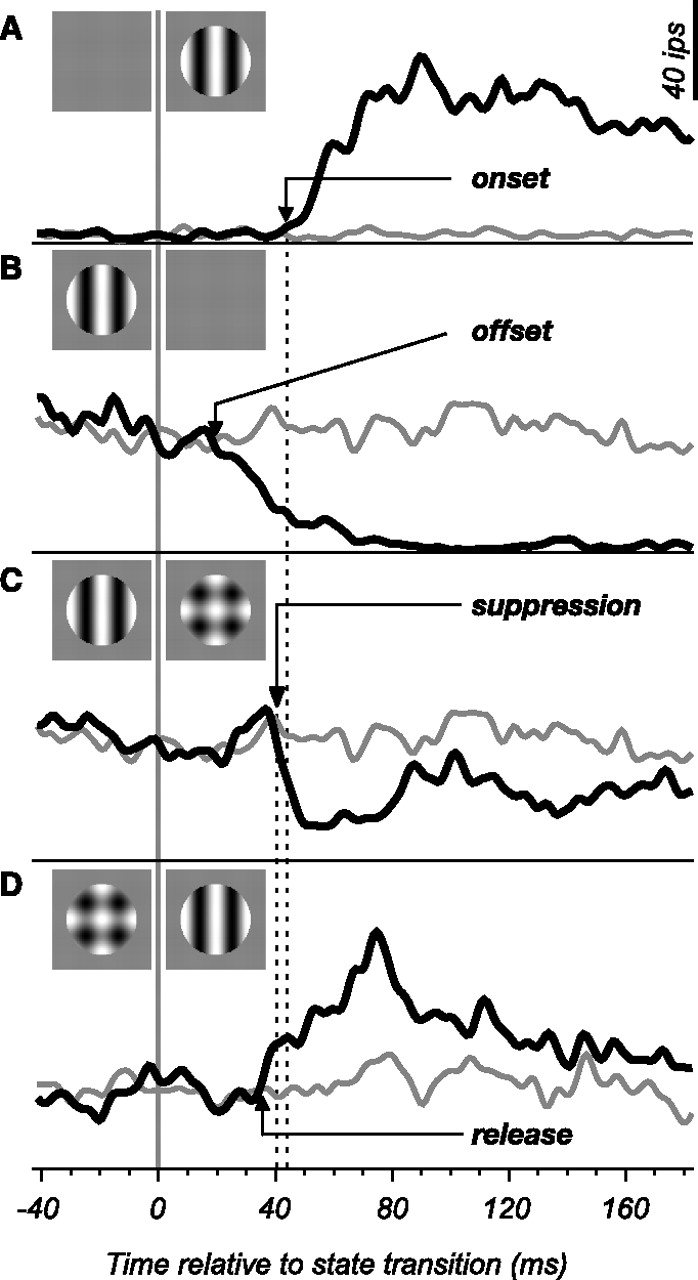
Example responses demonstrating cross-orientation suppression. Here we show the responses of a V1 complex cell to the stimulus transitions shown in Figure 1. The black lines in each panel are average response traces based on a transition at time 0 between the two stimuli indicated with icons. The light gray lines indicate the reference response if the stimulus did not change at time 0. The latencies identified for the four transitions are indicated with arrows, and two vertical dashed lines are drawn to indicate the onset latency and the suppression latency. ips, Impulses per second. A, The onset response for this cell occurred 48 ms after the optimal stimulus appeared. B, The offset response to the withdrawal of an optimal stimulus tended to precede the onset response, in this case occurring 22 ms after the transition. C, The onset of suppression was apparent 41 ms after the mask stimulus was presented. D, Release from suppression was apparent 37 ms after the mask stimulus was withdrawn.
- Figure 3.
Latency of cross-orientation suppression. A, The distribution of offset latency for our population of 60 neurons. The black arrow indicates the mean of the distribution (30.1 ± 9.3 ms; n = 58). B, The mean onset was ∼20 ms later than the offset (50.0 ± 15.8 ms; n = 59). C, Suppression was evident, on average, 6.4 ms before response onset (42.5 ± 11.1 ms; n = 46). D, Release from suppression occurred at approximately the same time (40.9 ± 12.4 ms; n = 46). E, As suggested by the similarity of the latencies for suppression and release shown in C and D, these two values were well correlated. F, The relationship between the onset latency of a cell and its suppression latency was also very strong: cells with short-latency onset responses had short-latency suppression and vice versa.
- Figure 4.
Grand PSTHs showing the average timing of two kinds of suppression across the population. A, The timing of cross-orientation suppression. The thin curve shows the average onset response of 59 neurons, elicited by the transition from a blank screen to a preferred grating (icon). The responses were all aligned on the onset latency before being added; this time is taken as 0. The thick curve shows the response of the same neurons to the transition from a blank screen to a plaid combining a preferred and orthogonal grating (“onset + suppression”). The dashed curve shows the difference between the other two traces as a measure of the suppression produced by the orthogonal grating. The curve rises from time 0 and is similar in shape to the onset response, indicating that suppression was present at or before the start of the onset response. B, The timing of surround suppression (data from Bair et al., 2003). The thin curve shows the average response of 93 neurons to an orientation transition from orthogonal to preferred (the “onset” response for the surround suppression experiments). As in A, the traces were all aligned at the onset latency, which was set to 0. The thick curve shows the average response of the same neurons to a simultaneous transition of a center stimulus from orthogonal to preferred and a surround stimulus from orthogonal to preferred (“onset + suppression”). The dashed curve shows the difference between the other two as a measure of surround suppression. In contrast to the analogous curve in A, the surround-suppressive signal was delayed after the onset response and did not stabilize until ∼50 ms after the onset response began.
- Figure 5.
A comparison of the timing of cross-orientation and surround suppression. We compared the suppression and release latencies for the cross-orientation (A) and surround (B) conditions for each neuron with data from both conditions. There was no statistically significant correlation in either distribution of data. Frequency histograms on each panel show the difference in response timing for suppression at the onset of the suppressive stimulus and its release at its offset. Both distributions are significantly shifted to the left of 0, meaning that, on average, cross-orientation suppression was evident ∼12 ms before surround suppression, and release from cross-orientation suppression was also earlier by the same amount. C, A scatter plot comparing the strength of cross-orientation and surround suppression for 33 cells. No relationship between the strengths of the two types of suppression is evident. Suppression ratio was computed as 1 minus the suppressed response divided by the unsuppressed response (response to plaid divided by response to preferred grating) in a time window equal to one period of the stimulus (typically 160 ms) after response onset (determined separately for each cell). A high value (closer to 1) indicates a large amount of suppression, whereas a low value (closer to 0) indicates a small amount of suppression. D, The relationship between suppression delay (“onset” latency minus “suppression” latency) and suppression ratio for both types of suppression. The small symbols (replotted from Bair et al., 2003) represent surround suppression, which is substantially faster when it is strong than when it is weak. The large symbols represent cross-orientation suppression, for which no statistically reliable trend is evident.


Additional Files
Supplemental data
Files in this Data Supplement:
- supplemental material - Supplementary Figure 1. Grand PSTHs showing the average timing of suppression and release across the population. (A) The timing of cross-orientation suppression and release. The thick and thin black curves show the average response of 59 neurons. For reference, the onset response (duplicated from Fig. 4A) is shown in light gray. The responses were all aligned on the onset latency before being added; this time is indicated as 0. The thick solid black line shows the average response to the transition from a preferred grating to a plaid (�suppression�). The latency to suppression is determined by comparison with the response to continued presentation of a preferred grating (the thin solid black line). Similarly, the thick dashed black line shows the average response to the transition from a plaid to a preferred grating (�release�). The reference trace for this transition is a continued presentation of a plaid (thin dashed black line). The latency to suppression and release is very early, occurring even before the onset response. (B) The timing of surround suppression (data from Bair et al., 2003). Here, the thick and thin black curves represent the average response of 93 neurons. For reference, the onset response (duplicated from Fig. 4B) is shown in light gray. As in A, the traces were all aligned at the onset latency, which was set to 0. The thick solid black line shows the average response to a preferred grating while the surround changes from orthogonal to parallel (�suppression�). The latency to suppression is determined by comparison with the response to continued presentation of a preferred grating with orthogonal surround (the thin solid black line). Similarly, the thick dashed black line shows the average response to a preferred grating while the surround changes from parallel to orthogonal (�release�). The reference trace for this transition is a continued presentation of a preferred grating with a parallel surround (thin dashed black line). For cross-orientation suppression, the steep part of the change for suppression and release occurs before the steep part of the curve for onset, whereas the opposite is true for surround suppression (red circles highlight intersection points). We note that some surround suppression does occur early consistent with our previous finding that strong suppression can occur as early as onset in some cells (see Figure 5C from Bair et al., 2003).


