

Abstract
Intrastriatal injection of 3-nitrotyrosine, which is a biomarker for nitrating oxidants, provokes dopaminergic neuronal death in rats by unknown mechanisms. Herein, we show that extracellular 3-nitrotyrosine is transported via the l-aromatic amino acid transporter in nondopaminergic NT2 cells, whereas in dopaminergic PC12 cells, it is transported by both the l-aromatic amino acid and the dopamine transporters. In both cell lines, 3-nitrotyrosine is a substrate for tyrosine tubulin ligase, resulting in its incorporation into the C terminus of α-tubulin. In NT2 cells, incorporation of 3-nitrotyrosine into α-tubulin induces a progressive, reversible reorganization of the microtubule architecture. In PC12 cells, 3-nitrotyrosine decreases intracellular dopamine levels and is metabolized by the concerted action of the aromatic amino acid decarboxylase and monoamine oxidase. Intracellular levels of 133 μmol of 3-nitrotyrosine per mole of tyrosine did not alter NT2 viability but induced PC12 apoptosis. The cell death was reversed by caspases and aromatic amino acid decarboxylase and monoamine oxidase inhibitors. 3-Nitrotyrosine induced loss of tyrosine hydroxylase-positive primary rat neurons, which was also prevented by an aromatic amino acid decarboxylase inhibitor. These findings provide a novel mechanism by which products generated by reactive nitrogen species induce dopaminergic neuron death and thus may contribute to the selective neurodegeneration in Parkinson's disease.
- dopamine
- neurotoxicity
- aromatic amino acid decarboxylase
- monoamine oxidase
- reactive nitrogen species
- nitration
- tubulin
Introduction
Reactive nitrogen species are thought to play a pathogenic role in a variety of neurodegenerative diseases, such as Parkinson's disease (PD) (Ischiropoulos and Beckman, 2003). This view stems in part from the demonstrations that proteins, such as α-synuclein and parkin, are posttranslationally modified by reactive nitrogen species in the brains of PD patients (Giasson et al., 2000; Chung et al., 2004). A fingerprint of reactive nitrogen species formation is 3-nitrotyrosine, which results from the reaction of nitrating oxidants with either protein tyrosine residues or free tyrosine (Ischiropoulos, 1998). Therefore, detection and quantification of 3-nitrotyrosine has been used as an indicator for the participation of reactive nitrogen species in pathological processes (Ohshima et al., 1990; Greenacre and Ischiropoulos, 2001; Turko and Murad, 2002). In that context, it is worth noting that nitrated proteins, as well as free 3-nitrotyrosine, have also been detected and quantified in rodent models of neurodegeneration and PD. Injection of 1-methyl-4-phenyl-1,2,3,6-tetrahydropyridine was associated with levels of 300 μmol of 3-nitrotyrosine per mole of tyrosine in mouse striatum (Pennathur et al., 1999). Challenges with other neurotoxic agents, such as malonate or 3-nitropropionic acid, resulted in nearly 5 mmol of 3-nitroyrosine per mole of tyrosine (Schulz et al., 1995). The significant increases in 3-nitrotyrosine in these models were diminished by the application of nitric oxide synthesis inhibitors (Schulz et al., 1995) and were absent if neuronal nitric oxide synthase-deficient mice were challenged with the same neurotoxins (Pennathur et al., 1999).
Although free 3-nitrotyrosine has been considered as a biological marker for reactive nitrogen species formation, recent data suggest that this unusual amino acid is also a potential neurotoxin. For instance, striatal injection of free 3-nitrotyrosine at concentrations similar to 6-hydroxydopamine, which causes a well described degenerative pathology and a parkinsonian syndrome in rats, induced a selective loss of dopaminergic neurons (Mihm et al., 2001). Although these data suggest that dopaminergic neurons are particularly sensitive to 3-nitrotyrosine, the molecular basis of 3-nitrotyrosine deleterious effects is unknown. Also unclear is how 3-nitrotyrosine gains access to dopaminergic neurons and, once inside these neurons, whether toxicity is mediated by 3-nitrotyrosine itself or possibly by other 3-nitrotyrosine metabolites. To address these questions, we investigated the uptake and metabolism of 3-nitrotyrosine in both the dopamine-producing PC12 and the nondopamine-producing NT2 cell lines as well as in primary ventral midbrain rat neurons. Although the formation of reactive nitrogen species is considered as the major biochemical event responsible for neuron death, the present study suggests that longer-lived products of the nitrative chemistry are also neurotoxic to dopaminergic neurons.
Materials and Methods
Materials.
Tyrosine, 3-nitrotyrosine, 2-aminobicyclo-(2,2,1)-heptane-2-carboxylic acid (BCH), pargyline, NSD1015 (3-hydroxybenzylhydrazine dihydrochloride), GBR12935 (1-[2-(diphenyl-methoxy)-ethyl]-4-(3-phenylpropyl)piperazine), and tyramine oxidase were purchased from Sigma (St. Louis, MO). The holoenzyme tyrosine (aromatic amino acid) decarboxylase from Streptococcus faecalis was purchased from Worthington (Freehold, NJ).
Cell culture.
The experiments were performed with the undifferentiated human teratocarcinoma NT2 and rat pheochromocytoma PC12 cell lines. NT2 cells were cultured in Optimem medium supplemented with 10% fetal bovine serum and 1% penicillin–streptomycin (containing 100 μm tyrosine). PC12 cells were cultured in RPMI-1640 medium supplemented with 10% heat-inactivated horse serum, 5% fetal calf serum, 5 mm l-glutamine, and 1% penicillin–streptomycin. The medium was refreshed every 2–3 d. For all experiments, PC12 cells were plated on collagen-coated surface for 48 h before additional treatment or until cells reached 60% confluence. Both cell lines were maintained at 37°C in 5% CO2.
Cell treatment.
NT2 or PC12 cells (50–60% confluent) were treated with a range of 3-nitrotyrosine concentrations for 24, 48, or 72 h, in the presence or absence of several inhibitors. Chemical compounds used were the l-aromatic amino acid transporter inhibitor BCH (at a final concentration of 100 μm), the monoamine oxidase inhibitor pargyline (100 μm), the aromatic amino acid decarboxylase inhibitor NSD1015 (100 μm), the dopamine transporter inhibitor GBR12935 (10 μm), the caspase-1 inhibitor benzyloxycarbonyl-Try-Val-Ala-Asp-chloromethyl-ketone (Ac-YVAD-CMK) (50 μm; Alexis Biochemicals, San Diego, CA), the caspase-3 inhibitor Z-Asp-Glu-Val-fluoromethyl ketone (Z-DEVD-FMK) (50 μm; BD PharMingen, San Jose, CA), and the general caspases inhibitor N-benzyloxycarbonyl-Val-Ala-Asp-fluoromethyl ketone (Z-VAD-FMK) (50 μm; BD PharMingen, San Jose, CA). Cells were pretreated with cysteine (final concentration of 1 mm) or the inhibitors for 18 h before 3-nitrotyrosine treatment and re-added every 24 h.
Measurement of cell death with trypan blue exclusion method.
Cell viability during the treatment with 3-nitrotyrosine in the presence or absence of inhibitors was monitored using the trypan blue exclusion method. Numbers of alive and dead cells were determined using a hemocytometer under a light microscope. Healthy nuclei from viable cells appeared round and phase bright, whereas nuclei from dead or dying cells appeared blue and irregularly shaped. In all experiments, floating cells were collected and assayed using the procedure and criteria described above. All cells were counted, and results were expressed as ratio of dead cells versus total cells (alive + dead).
Annexin V and flow cytometry.
For apoptosis or necrosis detection, cells were stained with fluorescein isothiocyanate-labeled annexin V and propidium iodide (PI) (Vybrant apoptosis assay kit; Invitrogen, Carlsbad, CA). After incubations, floating as well as adherent cells that were later trypsinized were pooled and centrifuged for 5 min at 1400 rpm. Pelleted cells were washed with PBS, centrifuged again, and resuspended in 100 μl of 1× annexin-binding buffer (10 mm HEPES, 140 mm NaCl, and 2.5 mm CaCl2, pH 7.4) yielding a cell density of 2 × 10⁶ cells/ml. A total of 10 μl of annexin V conjugate and 2 μl of 100 μg/ml PI working reagent were added to each 100 μl of cell suspension. The cells were incubated at room temperature for 30 min. After the incubation period, 400 μl of 1× annexin-binding buffer was added and the samples were kept on ice. The stained cells were analyzed by flow cytometry, and the percentage of cells was calculated using the Cellquest software. This method was able to distinguish among living (annexin V−/PI−), apoptotic (annexin V+/PI−), and necrotic (annexin V−/PI+) cells.
Postnatal rat midbrain cell culture model.
Midbrain cultures obtained as described previously (Przedborski et al., 1996) were maintained 2 weeks at 37°C in 5% CO2, and then wells were randomly assigned to either treatment group or to the control group. 3-Nitrotyrosine or 3-nitrotyramine was added to the culture medium at a final concentration of 2 and 1 mm, respectively, for 70 h. Separate wells were pretreated for 24 h with 400 μm NSD1015 or 500 μm pargyline before treatment with 3-nitrotyrosine. Control cultures received PBS instead of 3-nitrotyrosine, and NSD1015 was re-added every 24 h. At the end of the treatment, the medium was aspirated and cultures were fixed in 0.1 m PBS containing 4% paraformaldehyde for 30 min at 4°C. After four washes with PBS, the cells were incubated in 0.1% Triton X-100 in PBS plus 5% normal goat serum for 1 h. The cells were then incubated overnight at 4°C with a mouse monoclonal anti-tyrosine hydroxylase antibody (1:800; Chemicon, Temecula, CA) in PBS containing 0.1% Triton X-100 and 3% normal goat serum. After four washes in PBS, cells were incubated with an Alexa-Fluor 488 secondary antibody (goat anti-mouse, 1:500; Invitrogen) in PBS containing 0.1% Triton X-100 and 3% normal goat serum for 1 h. Cultures were then rinsed four times in PBS, and coverslips were mounted on slides using DakoCytomation (Glostrup, Denmark) fluorescent mounting medium. Only cells with distinct immunoreactivity, clear neuronal shape, and a nucleus were considered for counting tyrosine hydroxylase-positive neurons.
Western blotting.
Cells were washed with PBS, solubilized in 100 μl of ice-cold lysis buffer [20 mm HEPES, 150 mm NaCl, 1 mm EGTA, 1.5 mm MgCl2, 10% glycerol, 1% Triton X-100, protease inhibitors (1 mm phenylmethylsulfonyl fluoride, 1 μg/ml aprotinin, 1 μg/ml leupeptin, 10 mm sodium pyrophosphate, and 50 mm sodium fluoride), 2 mm sodium orthovanadate, and 1 μm lactacystin), sonicated, and analyzed by Western blotting. The protein concentration was determined by a Bradford assay. Proteins (40 μg) were separated by a 10% SDS-page gel transferred overnight to polyvinylidene difluoride or nitrocellulose membranes at 20 V and probed with an affinity-purified polyclonal anti-3-nitrotyrosine antibody (1:5000 dilution) (Fries et al., 2003), a monoclonal anti-α-tubulin antibody (1:3000 dilution; clone B-5-1-2; Sigma), and a monoclonal anti-glyceraldehyde-3-phosphate dehydrogenase (GAPDH) antibody (1:40,000 dilution; Chemicon). HRP-conjugated goat anti-rabbit IgG or HRP-conjugated goat anti-mouse IgG (1:5000 dilution) (Bio-Rad, Hercules, CA) was used for detection. Proteins were then visualized by enhanced chemiluminescence. For band quantification, fluorescent secondary antibodies were used suitable for the infrared imaging system, membranes were scanned, and fluorescence was measured (1:7500 dilution; Odyssey; LI-COR Biosciences, Lincoln, NE).
Immunofluorescence microscopy.
Cells were fixed with cold methanol for 20 min at −20°C and a mixture of cold acetone/methanol at 1:1 for 5 min at −20°C. The cells were blocked in PBS plus 0.3% Triton X-100 (PBS-T) containing 10% BSA and normal goat serum for 1 h at 25°C. After several washes with PBS-T, the cells were double labeled with polyclonal anti-3-nitrotyrosine (1:300) and monoclonal anti-α-tubulin (1:1000) antibodies left overnight at 4°C. Secondary antibodies were indocarbocyanine-conjugated goat anti-rabbit IgG (1:250 dilution; Jackson ImmunoResearch, West Grove, PA) and Alexa-Fluor 488-conjugated goat anti-mouse IgG (1:500 dilution; Invitrogen). Nuclear counterstaining was performed by using 4′-6-diamidino-2-phenylindole (1:10,000 dilution; Invitrogen). Fluorescent images were obtained using an inverted microscope 1X70 (Olympus Optical, Tokyo, Japan) or by confocal immunofluorescence microscopy.
Tyrosine decarboxylase activity assay.
Tyrosine decarboxylase activity was quantified by measuring the conversion of tyrosine to tyramine by HPLC. Tyrosine (0.4 mm) diluted in 0.1 m sodium acetate buffer at pH 5.5, the reported optimal pH for the catalytic activity of tyrosine decarboxylase (Epps, 1944), was incubated at 37°C with tyrosine decarboxylase (0.25 U/ml), in the absence or presence of different concentrations of 3-nitrotyrosine. Aliquots of the reaction mixture were taken over time, acidified to stop the enzymatic reaction, centrifuged at 10,000 rpm for 5 min, and then analyzed by HPLC equipped with a diode array detector.
Tyramine oxidase activity assay.
Tyramine oxidase activity was quantified by measuring the conversion of tyramine to 4-hydroxybenzaldehyde by HPLC. To obtain pure 3-nitrotyramine, 3-nitrotyrosine (1.5 mm) was incubated with 0.25 U/ml tyrosine decarboxylase at 37°C in 0.1 m sodium acetate buffer, pH 5.5, for 5 h. After acidification and centrifugation, the reaction mixture was analyzed by HPLC showing the formation of a single product presenting an absorbance at 365 nm. The identity of the nitrated derivative formed was confirmed by mass spectrometry as 3-nitrotyramine (mass/charge ratio of 183).
The reported optimal pH for the reaction of tyramine oxidase is 7.0 (Yamada et al., 1967). Tyramine (0.4 mm) diluted in 0.1 m sodium acetate at pH 6.9 was incubated at 37°C with tyramine oxidase (0.25 U/ml) in the absence or presence of different concentrations of 3-nitrotyramine. Aliquots were removed (80 μl) over time, acidified (addition of 8 μl of 1N HCl) to stop the enzymatic reaction, centrifuged at 10,000 rpm for 5 min, and then analyzed by HPLC.
HPLC detection of tyrosine and nitrotyrosine metabolites.
Aliquots of reaction mixtures were analyzed by a Hewlett Packard (Palo Alto, CA) HPLC system with a diode array detector using an octadodecyl silica gel reverse-phase column, 5 μm, 4.6 × 250 mm (Jupiter; Phenomenex, Torrance, CA) and 0.1% trifluoroacetic acid in ultra pure water (solvent A) and 100% acetonitrile (solvent B). The reaction mixture was eluting using an increasing linear gradient of solvent B from 0 to 15% in 10 min and then to 17% in 25 min, at a flow rate of 1 ml/min. The HPLC detector was set at 215, 275, and 365 nm. The HPLC system was calibrated with external standards at 275 and 365 nm to follow the nitrated products. Under these HPLC conditions, tyrosine, tyramine, 3-nitrotyrosine, 3-nitrotyramine, 4-hydroxybenzaldehyde, and 4-hydroxy-3-nitro-benzaldehyde were eluted at 11.1, 10.6, 14.1, 15, 13.6, and 22.2 min, respectively. Kinetic parameters were determined by Lineweaver–Burk plots of initial velocities obtained with a substrate concentration of 0.4 mm tyrosine and tyramine for tyrosine decarboxylase and tyramine oxidase, respectively.
HPLC detection of dopamine metabolites.
PC12 cells were lysed in mobile phase (citrate/phosphate buffer containing 2% methanol, pH 3), sonicated, and centrifuged. Supernatants were further centrifuged on 0.22 μm filter Eppendorf, preequilibrated with mobile phase. Fifty microliter aliquots were analyzed by HPLC with electrochemical detection set at −200, 0, 200, 300, and 400 V (Coularray; ESA, Chelmsford, MA). Chromatographic separation was achieved using an octadodecyl silica gel reverse-phase column, 5 μm, 4.6 × 250 mm (Jupiter; Phenomenex), providing complete separation of all analytes of interest, including, in order of elution, l-3,4-dihydroxyphenylalanine (l-DOPA), dopamine, and 3,4-dihydroxyphenylacetic acid (DOPAC). The residual pellets were resuspended in lysis buffer and sonicated, and protein concentrations were determined.
Quantification of 3-nitrotyrosine by HPLC-tandem mass spectrometry
Control and 3-nitrotyrosine treated cells were washed extensively with ice-cold PBS and harvested after application of trypsin in PBS. Cells were sonicated, and the content of free and protein 3-nitrotyrosine in lysates was analyzed by HPLC with on-line electrospray ionization tandem mass spectrometry (LC/ESI/MS/MS) using stable isotope dilution methodology on a triple quadrupole mass spectrometer (API 365; Applied Biosystems, Foster City, CA) with Ionics EP 10+ upgrade (Ionics, Concord, Ontario, CA) interfaced to a Cohesive Technologies (Franklin, MA) Aria LX Series HPLC multiplexing system, as described in detail previously (Brennan et al., 2002). Synthetic [13C6]-labeled standard was used as internal standard for quantification of natural abundance 3-nitrotyrosine. Simultaneously, a universal labeled precursor amino acid, [13C9,15N1]tyrosine, was added, permitting potential intrapreparative formation of nitro[13C9,15N]tyrosine to be routinely monitored and shown to be negligible (i.e., ≪5% of the level of the natural abundance product observed). Results are normalized to the content of the precursor amino acid tyrosine (i.e., nitrotyrosine/tyrosine, micromoles/moles), which was monitored within the same injection.
Results
Incorporation of 3-nitrotyrosine into tubulin in NT2 and PC12 cells
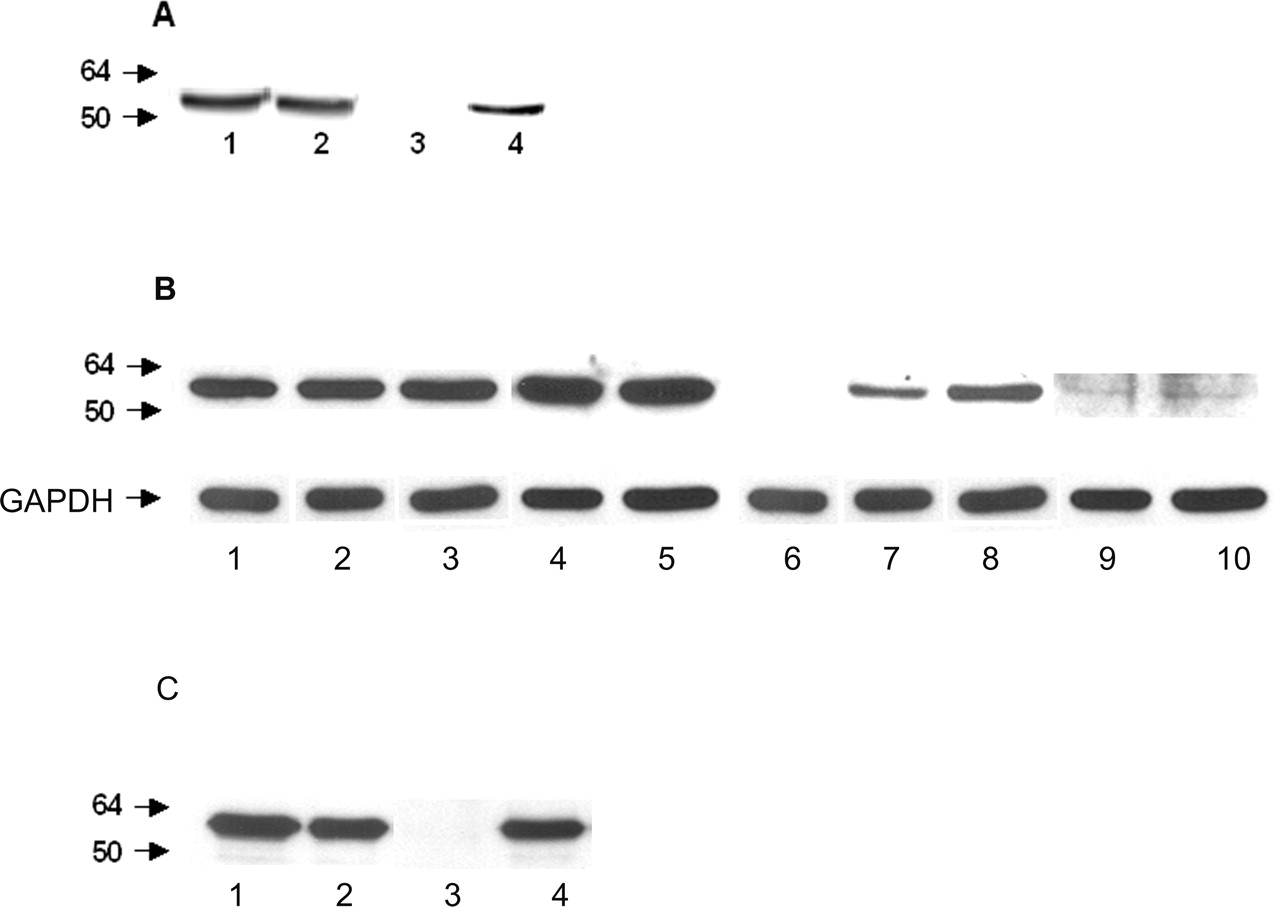
Undifferentiated NT2 and PC12 cells were incubated with 250 and 500 μm 3-nitrotyrosine (i.e., 2.5- and 5-fold excess over tyrosine) for 48 h. Probing the cell extracts with an affinity-purified anti-3-nitrotyrosine antibody revealed a single nitrated protein, which comigrated with α-tubulin and whose abundance increased as a function of 3-nitrotyrosine concentration (Fig. 1A,B). To confirm that the protein was indeed α-tubulin, NT2 cell lysates were immunoprecipitated with a monoclonal anti-α-tubulin antibody. The immunoprecipitated α-tubulin did react with an anti-α-tubulin or an anti-3-nitrotyrosine antibody (Fig. 1C). Densitometric analysis using fluorescent secondary antibodies showed that 8 and 15% of total α-tubulin was nitrated. Thus, during exposure of NT2 and PC12 cells to 3-nitrotyrosine, a fraction of α-tubulin incorporates this modified amino acid.

Incorporation of 3-nitrotyrosine into α-tubulin in PC12 and NT2 cells. A, PC12 cells were either untreated (lanes 1, 3) or treated with fivefold excess 3-nitrotyrosine over tyrosine for 48 h (lanes 2, 4). Cell lysates (40 μg) were analyzed by Western blotting using monoclonal anti-α-tubulin (lanes 1, 2) or affinity-purified polyclonal anti-3-nitrotyrosine (lanes 3, 4) antibodies and developed with fluorescent secondary antibodies suitable for quantification by the infrared imaging system. B, Undifferentiated NT2 cells were either untreated (lanes 1, 6) or treated with 3-nitrotyrosine at 250 μm (lanes 2, 7) and 500 μm (lanes 3, 8) for 48 h in the absence (lanes 2, 3, 7, 8) or presence of 100 μm BCH (lanes 4, 5, 9, 10). BCH was added 4 h before 3-nitrotyrosine treatment. Cell lysates (40 μg) were analyzed by Western blotting using monoclonal anti-α-tubulin (lanes 1–5) or affinity-purified polyclonal anti-3-nitrotyrosine (lanes 6–10) antibodies. Monoclonal anti-GAPDH antibodies were used for loading controls. C, Control undifferentiated NT2 cells (lane 1) and cells treated with 3-nitrotyrosine 500 μm for 48 h (lane 2) were immunoprecipitated with a monoclonal anti-α-tubulin antibody and analyzed by Western blotting using α-tubulin (lanes 1, 2) and 3-nitrotyrosine antibodies (lanes 3, 4). The blots are representative data from four to five independent determinations.
Treatment of NT2 cells with 3-nitrotyrosine in the presence of BCH, an inhibitor of the l-aromatic amino acid transporter (Christensen et al., 1969), significantly decreased the incorporation of 3-nitrotyrosine to α-tubulin (Fig. 1). Moreover, the uptake of 3-nitrotyrosine competed with the transport of tyrosine. In the absence of 3-nitrotyrosine, the levels of extracellular tyrosine declined by 23 ± 2 and 42 ± 3% after 48 and 72 h, respectively. However, in the presence of 500 μm 3-nitrotyrosine, the extracellular tyrosine levels declined by only 15 ± 1 and 20 ± 2% after 48 and 72 h. These data indicate that the uptake of 3-nitrotyrosine in NT2 cells involves the l-aromatic amino acid transporter and competes with the transport of tyrosine.
Effect of 3-nitrotyrosine on NT2 and PC12 cell viability
Incubation of NT2 and PC12 cells for 48 h with extracellular concentrations of 3-nitrotyrosine, ranging from 0 to 500 μm, produced a dose-dependent increase in intracellular levels of 3-nitrotyrosine in both cell lines (Fig. 2A,B). The increase in the intracellular 3-nitrotyrosine levels were not associated with any detectable death in the noncatecholaminergic NT2 cells based on trypan blue exclusion and propidium iodide and annexin V with flow cytometry assays (Fig. 2). In contrast, catecholaminergic PC12 cells showed a significant increase in cell death, which was proportional to the intracellular levels of 3-nitrotyrosine (Fig. 2B). By flow cytometry, 46 ± 3 and 65 ± 5% of the PC12 cells were positive for annexin V when the intracellular levels of 3-nitrotyrosine reached mean values of 45 and 133 μmol/mol tyrosine, respectively (Fig. 2B). The death of PC12 cells induced by 3-nitrotyrosine was prevented by pretreatment with caspase-1, caspase-3, or pan-caspase inhibitors (Fig. 3) but not by the antioxidant cysteine (Fig. 3). These results suggest that cytotoxicity induced by 3-nitrotyrosine in PC12 cells involves in part activation of apoptosis but does not rely on oxidation events.

Cytotoxicity induced by 3-nitrotyrosine in PC12 and NT2 cells. A, NT2 cells were treated with a range of 3-nitrotyrosine concentrations for 72 h. The percentage of cell death (▪) was measured with trypan blue exclusion (left axis), and intracellular concentrations of 3-nitrotyrosine (□) were quantified by LC/ECI/MS/MS and expressed as picomoles of 3-nitrotyrosine per mole of tyrosine (right axis) as described in Materials and Methods. B, The same treatment and quantification were performed PC12 cells. The values represent mean ± SD of three independent determinations. ∗p < 0.05, ANOVA with Tukey's post hoc analysis.

3-Nitrotyrosine induced apoptosis in PC12 cells. Apoptotic PC12 cell death was evaluated by flow cytometry using annexin V and propidium iodide labeling in control untreated cells and cells with intracellular levels of 133 ± 47 μmol of 3-nitrotyrosine (NT) per moles of tyrosine. Addition of the caspase-1 inhibitor (Ac-YVAD-CMK, 50 μm), the caspase-3 inhibitor (Z-DEVD-FMK, 50 μm), and the general caspase inhibitor (Z-VAD-FMK, 50 μm) during incubation with 3-nitrotyrosine prevented apoptotic cell death. Pretreatment of cells with 1 mm cysteine, 100 μm BCH, or 10 μm of the dopamine transporter inhibitor GBR12935 did not prevent apoptotic cell death. Pretreatment of PC12 cells for 18 h with both 100 μm BCH plus 10 μm GBR12935 inhibited the 3-nitrotyrosine-induced apoptotic cell death. The values represent mean ± SD for n = 3–6 independent determinations. ∗p < 0.05 difference from 3-nitrotyrosine-treated group by ANOVA with Tukey's post hoc analysis.
Pretreatment of PC12 with the l-aromatic amino acid transporter inhibitor BCH resulted in a marginal inhibition of cell death (Fig. 3). Under the same conditions, pretreatment of PC12 with the dopamine transporter inhibitor GBR12935 resulted in a 56 ± 2% reduction in the intracellular 3-nitrotyrosine levels and in a 15% decline in cell death (Fig. 3). By combining both BCH and GBR12935 pretreatments, the magnitude of cell death was comparable with controls (Fig. 3). We thus conclude that both the l-aromatic amino acid and dopamine transporters mediate the uptake of 3-nitrotyrosine in PC12 cells.
Incorporation of 3-nitrotyrosine into α-tubulin disrupts microtubule morphology in a reversible manner in NT2 cells
In contrast to PC12 cells, intracellular 3-nirotyrosine did not compromise cell viability in NT2 cells. However, the incorporation of 3-nitrotyrosine in the C terminus of α-tubulin resulted in the progressive disruption of the normal architecture of microtubules, as revealed by confocal immunofluorescence microscopy (Fig. 4). Although some filamentous microtubules were visualized in cells with intracellular levels of 56 μmol of 3-nitrotyrosine per mole of tyrosine (Fig. 4B), none were observed after the intracellular levels reached 180 μmol of 3-nitrotyrosine per mole of tyrosine (Fig. 4C). Instead, cells contained numerous well defined α-tubulin-positive, rounded structures resembling aggregates, which were located primarily in the cytosol (Fig. 4C). These aberrant α-tubulin-positive structures were not immunoreactive for either lysosome-associated membrane protein-1 or ubiquitin, suggesting that these structures are not targeted for degradation by the lysosomal or proteasomal pathway (data not shown). Treatment of NT2 with 3-nitrotyrosine for 24 h in the presence of nocodozole, a microtubule destabilizing agent (Gundersen et al., 1984), prevented the incorporation of 3-nitrotyrosine into α-tubulin (Fig. 4D). Nocodozole sequesters α-tubulin dimers and forms an inactive complex that renders the α-tubulin dimers incapable of incorporating either tyrosine or 3-nitrotyrosine by tyrosine tubulin ligase.

Incorporation of 3-nitrotyrosine to α-tubulin monomers is mediated by tyrosine tubulin ligase and disrupts the microtubule architecture in the NT2 cells. Undifferentiated NT2 cells were either untreated (A) or treated with 2.5-fold (B) and fivefold (C) excess 3-nitrotyrosine over tyrosine for 24 h, and confocal imaging of the cells are depicted using anti-α-tubulin (green) and anti-3-nitrotyrosine (red) antibodies. Cells pretreated with 5 μm nocodozole or previous incubation with 250 μm 3-nitrotyrosine for 24 h (D) did not incorporate 3-nitrotyrosine into α-tubulin.
To determine whether incorporation of 3-nitrotyrosine into α-tubulin was reversible, cells were cultured for 48 h with 3-nitrotyrosine-supplemented medium and then in medium without 3-nitrotyrosine for 2–24 h. Already after 2 h incubation in fresh medium, a decrease in 3-nitrotyrosine-labeled α-tubulin and a concomitant increase in glutamate (Glu)–tubulin was detectable (supplemental Fig. 1, available at www.jneurosci.org as supplemental material). Immunoblotting and immunofluorescence showed that nitrotyrosinated α-tubulin was no longer detectable after 24 h of incubation in fresh medium, and the normal filamentous architecture of microtubules was restored. Inhibition of protein synthesis using cycloheximide did not prevent the disappearance of nitrated α-tubulin. Moreover, the total level of α-tubulin did not change over the time course of this experiment, and Glu–tubulin levels remained comparable with control levels after 24 h incubation in fresh medium (supplemental Fig. 1, available at www.jneurosci.org as supplemental material). These data suggest that the loss of nitrotyrosinated α-tubulin is attributable to a removal of the modified amino acid by tubulin carboxypeptidase and not to a turnover of the modified protein.

Metabolism of 3-nitroyrosine required for cell death. A, Preincubation of PC12 cells with either NSD105 or pargyline reduced PC12 cell death to control levels. The values represent mean ± SD, n = 5–6; ∗p < 0.05, ANOVA with Tukey's post hoc analysis. NT, 3-Nitrotyrosine. B, PC12 cells were treated with a range of 3-nitrotyramine concentrations for 24 h in the absence (♦) or presence of 0.1 mm pargyline (⋄). Cell death was evaluated with trypan blue exclusion. 3-Nitrotyramine was synthesized as described in Materials and Methods, and purity was verified by HPLC-MS. The values represent mean ± SD, n = 3; ∗p < 0.05, Student's t test. C, 1, Tyrosine hydroxylase-positive neurons under control conditions; 2, 72 h after treatment with 3-nitrotyrosine; 3, pretreatment with NDS1015 before 3-nitrotyrosine exposure; 4, tyrosine hydroxylase-positive neurons under control conditions; 5, 72 h after treatment with 3-nitrotyramine; 6, pretreatment with pargyline before 3-nitrotyramine exposure. The values represent mean ± SD, n = 12–15 separate wells from two independent cultures. ∗p < 0.05, ANOVA with Tukey's post hoc analysis.
Effect of 3-nitrotyrosine on dopamine biosynthesis and metabolism in PC12 cells
3-Nitrotyrosine does not interfere with the activity of tyrosine hydroxylase in PC12 cells (Ischiropoulos et al., 1995). However, like dopamine, 3-nitrotyrosine is modified in one of the two equivalent ortho carbons of the aromatic ring of tyrosine, suggesting that it may be substrate for the aromatic amino acid decarboxylase. Consistent with this view, incubation of PC12 cells with 100 μm 3-nitrotyrosine for 72 h led to a concentration-dependent increase in intracellular l-DOPA and DOPAC levels (Table 1). The effect of 3-nitrotyrosine on catechol levels was compared with the effect of NSD1015, an inhibitor of the aromatic amino acid decarboxylase, and of pargyline, a monoamine oxidase inhibitor. Treatment with NSD1015 abolished dopamine and DOPAC and raised the intracellular levels of l-DOPA by nearly ninefold compared with control (Table 1). Treatment with pargyline did not affect l-DOPA levels, increased dopamine levels, and prevented DOPAC formation (Table 1). These results indicated that, similar to NSD1015, 3-nitrotyrosine interferes with the activity of aromatic amino acid decarboxylase but not tyrosine hydroxylase, which is consistent with previous results (Ischiropoulos et al., 1995). However, unlike NSD1015, the levels of DOPAC were increased in 3-nitrotyrosine-treated cells, indicating that 3-nitrotyrosine also interferes with the activity of monoamine oxidase.
Interference of 3-nitrotyrosine on dopamine production and metabolism
Using purified aromatic amino acid decarboxylase and monoamine oxidase, we confirmed that the aromatic amino acid decarboxylase converted 3-nitrotyrosine to 3-nitrotyramine and monoamine oxidase converted 3-nitrotyramine to 3-nitro-4-hydroxyphenylacetate (supplemental Fig. 2, available at www.jneurosci.org as supplemental material). This indicated that 3-nitrotyrosine is not only an inhibitor of aromatic amino acid decarboxylase and monoamine oxidase but also a substrate. Moreover, tyrosine was a noncompetitive inhibitor for the conversion of 3-nitrotyrosine to 3-nitrotyramine by aromatic amino acid decarboxylase, whereas tyramine, a natural substrate of monoamine oxidase, was an uncompetitive inhibitor for the conversion of 3-nitrotyramine to 3-nitro-4-hydroxyphenylacetate (supplemental Fig. 2, available at www.jneurosci.org as supplemental material). In addition, after exposure to 3-nitrotyrosine for 48 h, 0.6 pmol of 3-nitro-4-hydroxyphenylacetate was detected by LC/ESI/MS/MS in PC12 cell lysates. These data support the observed inhibition of dopamine production and indicated that 3-nitrotyrosine was metabolized by the aromatic amino acid decarboxylase and monoamine oxidase to 3-nitro-4-hydroxyphenylacetate. Although 3-nitro-4-hydroxyphenylacetate has the potential for additional cytotoxicity, it is not a substrate for tubulin tyrosine ligase and thus did not incorporate into α-tubulin (Eiserich et al., 1999).
Metabolism of 3-nitrotyrosine to 3-nitro-4-hydroxyphenylacetate leads to death of PC12 cells and primary rat midbrain neurons
Pretreatment with NSD1015 or pargyline before 3-nitrotyrosine incubation reduced the level of PC12 cell death to control levels (Fig. 5). To assess whether the metabolism of 3-nitrotyrosine is neurotoxic to primary dopaminergic neurons, rat ventral midbrain cultures were exposed to 3-nitrotyrosine for 72 h. This incubation resulted in a significant 41% reduction in tyrosine hydroxylase-positive neurons (Fig. 6). Similarly, as in PC12 cells, 3-nitrotyrosine-associated cell death in ventral midbrain neurons was prevented by a pretreatment with NSD1015 (Fig. 6). Incubation of PC12 cells and rat ventral midbrain neurons with 3-nitrotyramine also led to cell death in both culture systems (Fig. 6B,C). The toxicity of 3-nitortyramine was prevented by pargyline (Fig. 6B,C). These results suggest that cell death was linked to the metabolism of 3-nitrotyrosine by the aromatic amino acid decarboxylase and monoamine oxidase.
Discussion
Free 3-nitrotyrosine is formed in vivo by the reaction of tyrosine with nitrating oxidants and potentially by the degradation of nitrated proteins by the proteasome or other proteolytic enzymes (Souza et al., 2000). Until recently, the detection of free 3-nitrotyrosine under physiological or pathological conditions has been considered as a marker of oxidative and nitrative stress (Ohshima et al., 1990; Greenacre and Ischiropoulos, 2001; Turko and Murad, 2002). However, the data presented herein indicate that 3-nitrotyrosine at intracellular levels comparable with levels measured in the brain (Schulz et al., 1995; Pennathur et al., 1999) can be a cell-specific neurotoxin. The neurotoxicity of 3-nitrotyrosine is linked to its enzymatic conversion via the concerted action of the aromatic amino acid decarboxylase to 3-nitro-4-phenylacetate.
The finding that 3-nitrotyrosine is metabolized to a neurotoxic metabolite provides a novel biochemical pathway that explains the neurotoxic effects of direct 3-nitrotyrosine injection into rat striatum. Striatal injections of 3-nitrotyrosine at relative high concentrations (8 mm) produced selective loss of dopaminergic neurons, primarily attributable to apoptotic cell death, without any apparent incorporation into striatal proteins (Mihm et al., 2001). 3-Nitrotyrosine was also capable of inducing apoptosis in rat motor neurons without any apparent nitrotyrosination of tubulin but failed to induce astrocyte death in which incorporation of 3-nitrotyrosine into α-tubulin was observed (Peluffo et al., 2004). Although the molecular mechanisms for the neurotoxicity of 3-nitrotyrosine in motor neurons are not known at present, collectively these results indicate that a product of nitrative stress causes neurotoxicity in neuronal cells that is not related to its incorporation to α-tubulin.
Incorporation of 3-nitrotyrosine into α-tubulin had a profound but reversible effect on the organization of microtubules in NT2 cells without any detrimental effect on cellular viability. The incorporation of 3-nitrotyrosine into α-tubulin is the only recognized pathway for incorporation of 3-nitrotyrosine into proteins because other studies have confirmed that 3-nitrotyrosine does not incorporated to the tRNA pool of amino acids and, as such, will not be incorporated into newly synthesized proteins (Greene, 1971; Ischiropoulos et al., 1995). The lack of a toxic effect of tubulin nitrotyrosination is consistent with previous reports in other cell types, which also indicated a reversible incorporation without a significant effect on viability (Bisig et al., 2002). We extended these observations by providing evidence that the reversible incorporation into α-tubulin was attributable to the tubulin decarboxylase. Although the incorporation into α-tubulin does not compromise cellular viability, it alters vascular permeability and myogenic differentiation (Eiserich et al., 1999; Chang et al., 2002). Moreover, systemic administration of 3-nitrotyrosine to rodents resulted in the induction of hypothyroidism by inhibiting the function of the thyroid tyrosine deiodinase (Greene, 1971), modulated vascular hemodynamic responses to angiotensin II by acting as an α,β-adrenoreceptor antagonist (Kooy and Lewis, 1996), and caused vascular endothelial dysfunction (Mihm et al., 2000).
Collectively, the data suggest a new paradigm for the oxidative stress-mediated neurotoxicity. Presently, it has been suggested that deregulated overproduction of reactive species accompanied by a decline in the antioxidant defenses permits the destruction of neuronal macromolecules and results in the demise of neurons (Beal, 2002; Dawson and Dawson, 2003; Dauer and Przedborski, 2003; Ischiropoulos and Beckman, 2003). However, unless the reactive species are produced continuously, they are incapable of sustaining pressure onto cells over long periods of time. In contrast to the highly reactive oxygen and nitrogen species, relatively more stable products such as 3-nitrotyrosine can sustain a toxic effect over longer periods of time because metabolism to non-oxidizing metabolites is required for toxicity. These metabolites might have more subtle, long-lived and cell-specific cytotoxicity than the more generalized oxidant damage by reactive oxygen and nitrogen species. Therefore, 3-nitrotyrosine and possibly other unusual amino acids need to be considered in the biochemical and molecular mechanisms of neurotoxicity in addition to oxidant damage imposed by reactive nitrogen species.
Footnotes
-
The work was supported by National Institutes of Health (NIH) Grant HL076491 (S.L.H.), Department of Defense DAMD Grants 17-99-1-9474 and 17-03-1-0002, and Morris K. Udall Parkinson's Disease Research Center of Excellence Grant NS38370 (S.P.), and NIH Grants HL54926 and AG13966 (H.I.). We thank Xiaoming Fu for mass spectrometric analysis, Dr. L. Lafanechere (Commissariat à l'Energie Atomique, Grenoble, France) for the generous gift of the anti-Glu-tubulin antibody, and R. Lightfoot for helpful discussions.
- Correspondence should be addressed to Dr. Harry Ischiropoulos, Stokes Research Institute, Children's Hospital of Philadelphia, 416D Abramson Research Center, 34th Street and Civic Center Boulevard, Philadelphia, PA 19104-4399. Email: ischirop{at}mail.med.upenn.edu


