

Article Figures & Data
Figures
- Figure 1.
Tasks. a, Delayed saccade trials. Subjects fixated (±2°) a centrally located yellow LED. After a delay, a target LED was illuminated; subjects were required to maintain fixation until the central light was extinguished (200–600 ms) and then shift gaze to the target (2–3°) and maintain fixation of it for 500 ms to receive a juice reward. b, Retinocentric versus nonretinocentric test. The fixation LED appeared at either the center of the LED panel or 10° to the left or right of the center. Targets were drawn from an array of 10 LEDs, spaced 4° apart from −18 to 18° and typically 10° above or below the array of fixation points. c, Egocentric versus allocentric test. Subjects performed delayed saccades from the central fixation point to the array of 10 targets after passive whole-body rotation 20° in either direction around the vertical axis. d, Expected tuning curves in the retinocentric versus nonretinocentric test. Tuning curves, separated by fixation point, are expected to align when plotted as a function of retinocentric target position if these neurons encode only information about the saccade vector/retinal vector. If these neurons encode information with respect to the subject but not the eye, tuning curves will align when plotted as a function of the nonretinocentric target position. e, Expected tuning curves in the egocentric versus allocentric test. Tuning curves, separated by rotation, are expected to align when plotted as a function of target position with respect to the subject if these neurons encode spatial information in egocentric coordinates. If these neurons encode spatial information allocentrically, the tuning curves will align when plotted as a function of the target position in the room.
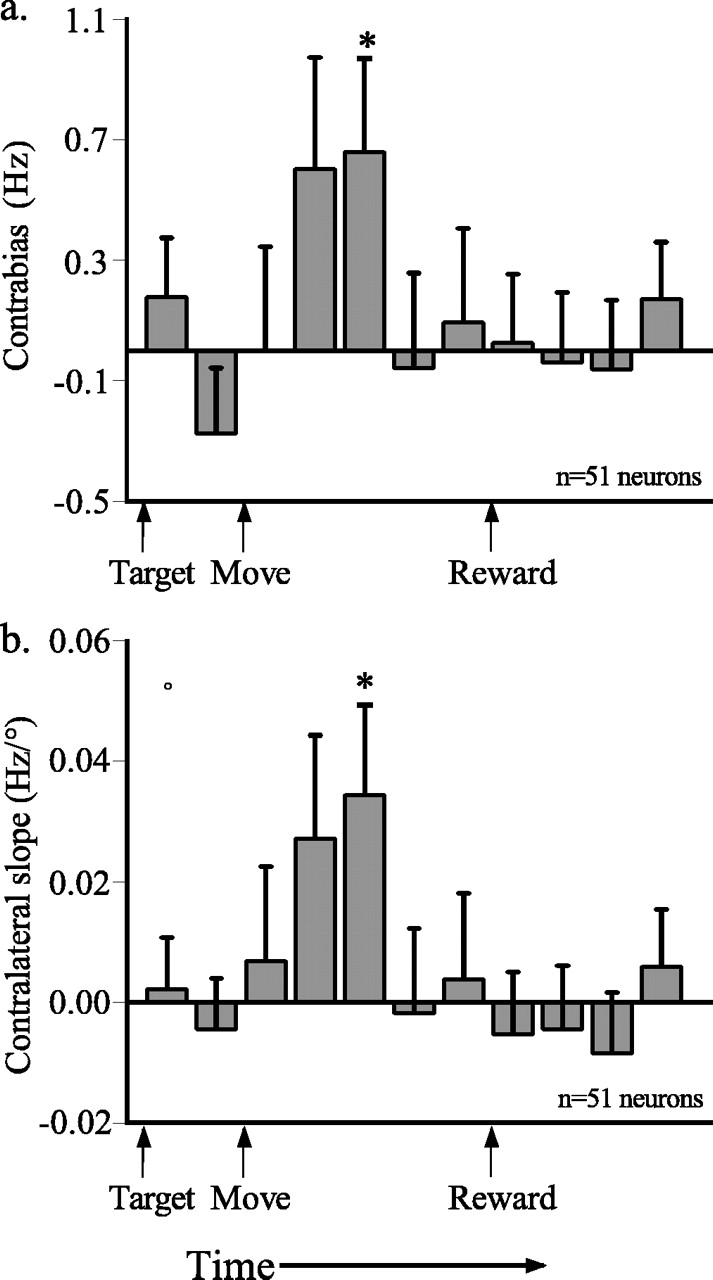
- Figure 2.
Spatial and temporal properties of responses to saccades initiated from the central fixation stimulus. a, Average differences in firing rate for trials with contralateral and ipsilateral targets (contrabias) plotted as a function of time for 11 200-ms epochs aligned on trial events. b, Mean ± SE slopes of lines fit to response versus target position plot for the same 200 ms epochs. Positive slopes indicate a greater neuronal response on trials in which the target appeared in the hemifield contralateral to the recording site. Significant differences between firing rates for each fixation are indicated by t test at *p < 0.05.
- Figure 3.
Tuning curves from two example cells in experiment 1 for the epochs after movement onset (a) (number of trials for each fixation position: left, n = 107; center, n = 81; right, n = 88) and preceding reward presentation (b) (left, n = 154; center, n = 144; right, n = 152). Firing rate is plotted against either retinocentric or nonretinocentric target position for each cell. Blue curves represent movements that began 10° left of center, red curves represent those beginning at the central fixation point, and green curves represent those beginning the point 10° right of center.
- Figure 4.
Nonretinocentric bias in the CGp population as a function of time. The percentage of cells with a significant effect of either the nonretinocentric (black) or retinocentric (gray) position of the target on firing rate in an ANOVA in each of 11 200-ms epochs.
- Figure 5.
Tuning curves from two example cells in experiment 2 for the epochs after movement onset (a) (number of trials for each rotation position: left, n = 183; center, n = 322; right, n = 151) and preceding reward presentation (b) (left, n = 153; center, n = 278; right, n = 202). Firing rate is plotted against either target position with respect to the subject or target position in the room for each cell. Blue curves represent trials during which the subject was rotated 20° to the left, red curves represent those during which the subject was centered, and green curves represent those during which the subject was rotated 20° to the right. For each neuron, the number of trials beginning at each rotation position (−20°, 0°, 20°) is indicated by the blue, red, and green numbers, respectively.
- Figure 6.
Allocentric bias in the CGp population as a function of time. The percentage of cells with a significant effect of either the allocentric (black) or egocentric (gray) position of the target on firing rate in an ANOVA in each of 11 200-ms epochs.
- Figure 7.
Aggregate population tuning curves for the post-movement epoch in experiment 1 (a) (number of trials for each fixation position: left, n = 8368; center, n = 9090; right, n = 8485) and experiment 2 (b) (number of trials for each rotation position: left, n = 5943; center, n = 13, 400; right, n = 8233). In a, firing rate, normalized for each neuron, rotated so that contralateral targets were positive, and averaged across the population, is plotted against either the retinocentric or nonretinocentric target position. Blue curves represent movements that began 10° left of center, red curves represent those beginning at the central fixation point, and green curves represent those beginning 10° right of center. Colored arrows at the bottom of each plot indicate the y = 1 intercept for each curve. In b, firing rate, normalized for each neuron, rotated so that contralateral targets were positive, and averaged across the population, is plotted against either egocentric or allocentric target position. Blue curves represent trials during which the subject was rotated 20° to the left, red curves represent those during which the subject was centered, and green curves represent those during which the subject was rotated 20° to the right. Colored arrows at the bottom of each frame indicate the y = 1 intercept for each curve.
- Figure 8.
Average firing rate in the CGp population during initial fixation across all trials in experiment 1 (a) and experiment 2 (b). In a, all trials for all neurons studied in experiment 2 (n = 51) are included (−10, n = 8368 trials; 0, n = 9090; 10, n = 8485). In b, only neurons in which data were collected after rotation in both directions (n = 23) are included (−20, n = 4402 trials; 0, n = 6315; 20, n = 4886). Significant differences between firing rates for each fixation are indicated by t test at *p < 0.05 and **p < 0.01 level.


