

Article Figures & Data
Figures
- Figure 1.
Ca2+ channel currents carried by Ba2+ (10 mm) in mouse outer hair cells around and after the onset of hearing. A, Peak inward IBa (single trace) elicited by a step depolarization from −70 to 0 mV for 8 ms in a P12 apical OHC. Capacitive current transients attributable to prestin action at the start and end of the current response were cut off. Dashed line, Zero current trace. B, Corresponding I–V. C, IBa I–V for another apical OHC (P12) before (control) and during superfusion with 5 μm Bay K 8644 indicates that IBa is an L-type current. D, E, Non-inactivating peak current trace of an apical OHC at P19 in response to a long inactivation protocol (single trace; command voltages are given, D) and corresponding steady-state I–V (E) at the end of the first 400 ms depolarizing pulse in Tris-lactobionate solution. Large current transients in A and D were attributable to the nonlinear capacitance of OHCs. F, Developmental upregulation and downregulation of peak IBa as a function of age. Data for P1–P8 were adopted from Michna et al. (2003). Number of cells for ages older than P8 are as follows: P9, 4; P10, 2; P11, 2; P12, 4; P13, 1; P15, 2; and P19, 3. OHCs older than P8 were from apical half-turns, except two medial OHCs at P15.
- Figure 2.
Ca2+ channel currents carried by Ba2+ (10 mm) in neonatal rat outer and inner hair cells at the age of their respective developmental peaks. A–C, IBa traces and I–V of a rat OHC at P1; C = 7.1 pF, Rleak = 6.1 GΩ, bath solution (B1) included local perfusion with Tris-Cl solution. A, Selected current traces in response to step depolarizations from a holding potential of −68 mV to the potentials indicated for 8 ms. B, Corresponding I–V taken at the last millisecond of the depolarizing pulse in A and fit according to Equation 1 (Vh = −10.4 mV; k = 13.8 mV). C, Selected IBa traces in response to a long inactivation protocol (command voltages are given) show little voltage-dependent inactivation. D–F, IBa of a rat IHC at P9; C = 10.1 pF, Rleak = 2.8 GΩ, bath included Tris-Cl solution. D, Selected current traces in response to short step depolarizations from a holding potential of −70 mV to the potentials indicated. E, Corresponding I–V taken at the last millisecond of the depolarizing pulse and fit (Vh = −19.4 mV, k = 13.6 mV). F, Selected IBa traces in response to a long inactivation protocol (command voltages are given) reveal very little voltage-dependent inactivation.
- Figure 3.
Ca2+ channel currents carried by Ba2+ (10 mm) in mature rat outer and inner hair cells. A–D, IBa of a rat OHC at P28; C = 16.1 pF, Rleak = 1.8 GΩ, bath included TEA-lactobionate solution. A, Overview of the current responses to step depolarizations from a holding potential of −68 to +52 mV for 20 ms shows large capacitive current transients at the start and the end of the voltage pulses, respectively, attributable to the nonlinear capacitance of the OHC. Selected small inward currents within the rectangle in A are magnified in B; command voltages are indicated. C, Corresponding I–V taken at the last millisecond of the depolarizing pulse in B and fit (Vh = 2.2 mV, k = 13.6 mV). D, Selected IBa traces in response to a long inactivation protocol of another OHC at P28 (C = 17.6 pF, Rleak = 1.7 GΩ), showing little voltage-dependent inactivation (command voltages are given). E–G, IBa of a rat IHC at P30; C = 14.7 pF, Rleak = 1.6 GΩ, bath included TEA-lactobionate solution. E, Selected current traces elicited by step depolarizations from a holding potential of −68 mV to the potentials indicated. F, Corresponding I–V taken at the last millisecond of the depolarizing pulse and fit (Vh = −7.1 mV, k = 11.8 mV). G, Selected IBa traces in response to a long inactivation protocol (command voltages are given) showing lack of voltage-dependent inactivation.
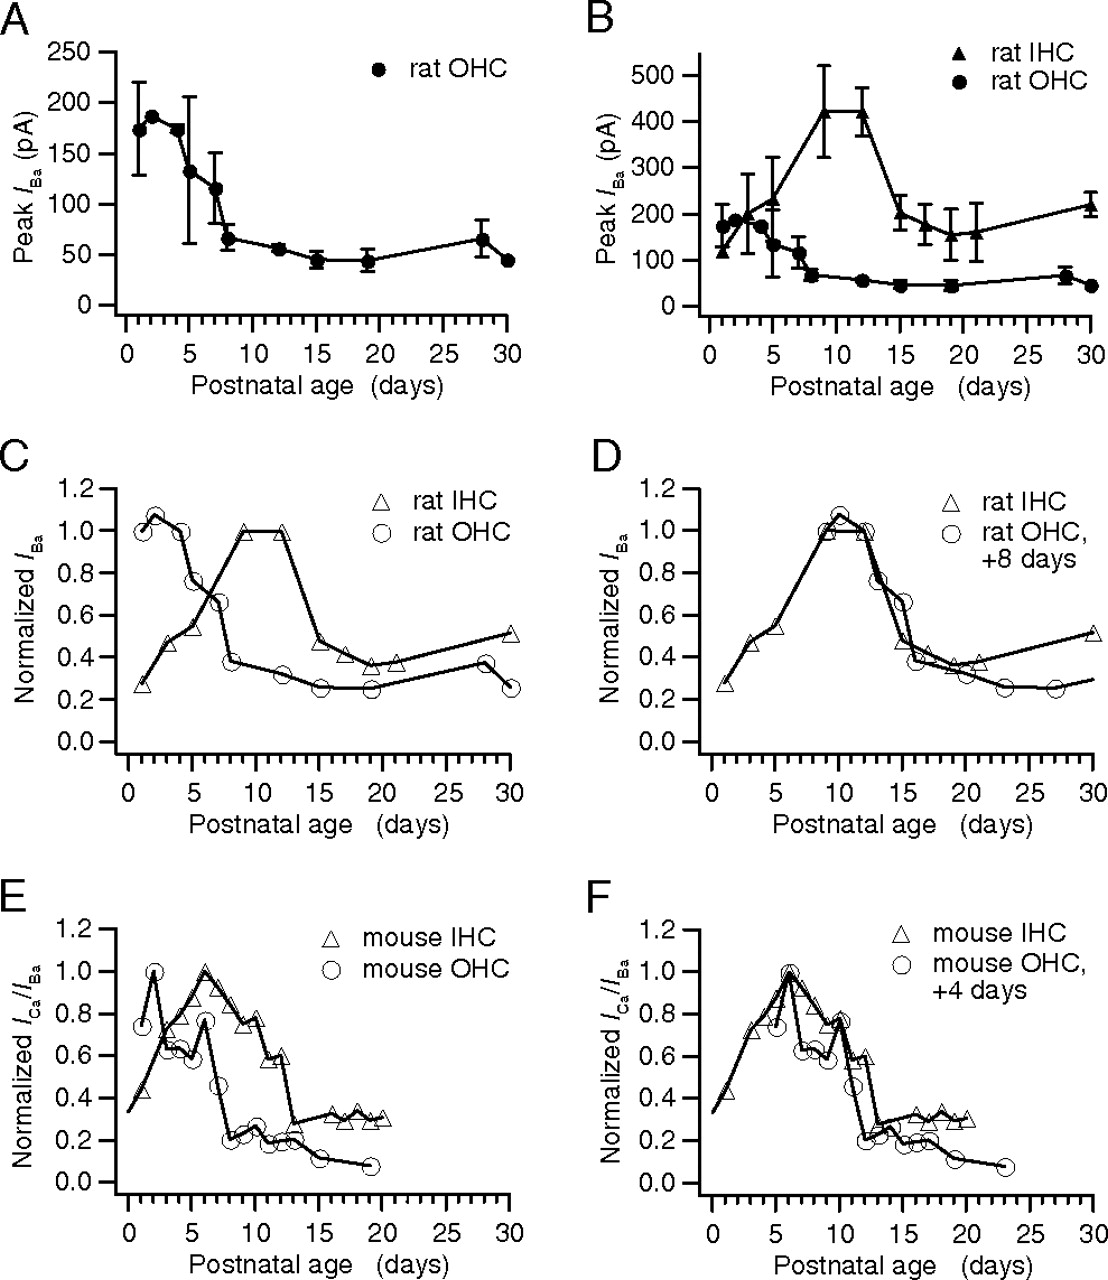
- Figure 4.
Ca2+ channel currents show a developmental upregulation and downregulation in both outer and inner hair cells in rats and mice, with the current maximum of OHCs preceding that of the IHCs by several days. A, Average peak IBa in rat OHCs as a function of age. Number of OHCs were as follows: P1, 6; P2, 1; P4, 2; P5, 5; P7, 6; P8, 3; P12, 2; P15, 5; P19, 6; P28, 13; and P30, 1. OHCs were from apical or medial cochlear half-turns from mice younger than P9 and from apical half-turns older than that. B, Average peak IBa in rat IHCs (triangles) and the much smaller average IBa for rat OHCs (circles) as a function of age. Number of IHCs were as follows: P1, 1; P3, 2; P5, 14; P9, 3; P11, 7; P15, 13; P17, 10; P19, 3; P21, 5; and P30, 6. C, Rat OHC and IHC average IBa values were normalized to their developmental peaks, respectively, to compare the time course of their IBa downregulation. D, When the OHC normalized IBa curve was shifted by 8 d to the right, it matched that for the IHC IBa development. E, Mouse OHC IBa data from Figure 1F were normalized to their developmental peak. The same was done for mouse IHCs using Ca2+ current data from Marcotti et al. (2003) (their Fig. 2C). F, Shifting the mouse OHC normalized IBa curve by 4 d reveals similar kinetics of developmental downregulation of IBa/ICa in mouse outer and inner hair cells.
- Figure 5.
The voltage for half-maximal activation of IBa, Vh, increases in rat outer hair cells in physiological extracellular Cl− concentration on maturation and is affected by reduction of [Cl−] e. A, B, Average Vh for OHCs (A) and IHCs (B) as a function of age recorded in either Tris-Cl solution (155 mm [Cl−]e; white bars) or TEA-lactobionate solution (95 mm [Cl−]e; gray bars). The number of cells is indicated above/below the bars. A, Vh of OHCs started from negative values in both solutions from P0–P2, increased steadily, and stabilized at different levels of at least P12, with Vh of −8.3 mV in Tris-Cl solution (dashed line) at P15–P17 contrasting Vh of ∼10 mV in TEA-lactobionate solution at P12–P30. B, In IHCs, Vh stayed nearly constant at negative values (P15–P17, −17.7 mV; dashed line) in Tris-Cl solution. In the TEA-lactobionate solution, Vh increased on maturation and stabilized at values of approximately −7 mV at ages older than P11.
- Figure 6.
Detection of Cav1.3-specific transcripts in mouse and rat hair cells around and after the onset of hearing (P12–P32) by cell-specific RT-PCR. A, B, A 421 bp, Cav1.3-specific transcript was amplified in mouse (A) and rat (B) IHC and OHC samples at the ages indicated. Inner and outer hair cells were collected from apical cochlear turns.
- Figure 7.
Expression of Cav1.3 mRNA in mature inner and outer hair cells using whole-mount in situ hybridization with organs of Corti of mouse and rat. A, C, Cav1.3 mRNA expression could be specifically detected in IHCs and in all three rows of OHCs in the mouse (A) and rat (C) organ of Corti (midbasal half-turn) at P19. B, D, No mRNA was detected when corresponding sense riboprobes were used in either mouse (B) or rat (D) whole-mount preparations. Large arrows indicate the row of inner hair cells, and small arrows indicate the rows of outer hair cells. Irregularities in IHC rows were a result of tissue shrinkage during the in situ hybridization procedure. Scale bar, 20 μm.
- Figure 8.
Localization of Cav1.3 immunoreactivity in the organ of Corti. A, Anti-Cav1.3 immunoreactivity (red) in a mouse cochlear cryosection at P9 (medial half-turn) revealed dot-like staining at the basolateral membrane of the IHC and two to four immunopositive dots at the base of the OHCs. The IHC is indicated by a thick arrow, OHCs are denoted by thin arrows, dot-like Cav1.3 immunoreactivity is indicated by arrowheads, and cell nuclei were stained with DAPI (blue). B, Projection of confocal images of a rat whole-mount preparation of the organ of Corti (medial half-turn) at P22 stained for Cav1.3 (top, visualized in green) and CtBP2/RIBEYE (middle, visualized in red). The anti-CtBP2 antibody also diffusely stained the nuclei; for explanation, see Materials and Methods. The merge of both images shows extensive colocalization of Cav1.3 and CtBP2/RIBEYE (bottom, yellow). C, Higher magnification of a single OHC viewed from the base, with Cav1.3 (left) and CtBP2/RIBEYE (middle) staining forming a ring at the OHC base; the nucleus is stained in blue. Both stainings primarily colocalize, as demonstrated by the yellow–brownish color in the merged image (right). D, Three-dimensional reconstruction of a stretch of OHC nuclei (blue) with a ring of Cav1.3- and CtBP2/RIBEYE-positive staining below each nucleus. E, Projection of confocal images of a rat whole-mount preparation of the organ of Corti (basal half-turn) at P20 costained for Cav1.3 (green) and CtBP2/RIBEYE (red). In all three OHC rows, a central Cav1.3-positive spot (green) is surrounded by and partially colocalized with CtBP2/RIBEYE-positive dots (red; colocalization is visible as small yellow dots). The anti-CtBP2 antibody again diffusely stained nuclei. F, Higher magnification of two OHCs from the basal cochlear half-turn viewed from the basal pole onto the nucleus (blue). Cav1.3 (green) stains the center of the OHCs pole, which is surrounded by CtBP2/RIBEYE staining (red) and partially colocalizes with it (yellow–brown). Scale bars: A, 20 μm; B–F, 5 μm.


