

Article Figures & Data
Figures
- Figure 1.
Schematic drawings of the driver and the responder transgene constructs. In the driver construct, rtTA with an SV40 poly(A) sequence (PA) was inserted between the Tie-2 promoter and the Tie-2 enhancer initially generated by Dr. Tom Sato's group (Schlaeger et al., 1997). In the responder construct, the bidirectional TRE was flanked by EGFP and antisense IL-1R1.
- Figure 2.
Identification of eIL-1R1 founder animal. A, Examples of PCR results from testing the presence of rtTA in genomic DNA in a litter of potential transgenic mice. Animals 5, 6, and 12 are shown to have acquired the driver rtTA gene (the arrow points to the predicted amplicon size). B, PCR results from testing the presence of EGFP in genomic DNA in the same litter of mice. Animals 3, 5, and 6 contained the responder EGFP gene (the arrow points to the predicted amplicon size). The mRNA expressions of these genes from animal 6 were further tested by real-time PCR and are presented in C (rtTA) and D (EGFP). The mRNA for rtTA was expressed in this animal with and without Dox treatment (+Dox and −Dox). No cDNA was detected in the control samples generated from the same mRNA sample without reverse transcription (Ctrl lines in C and D; the threshold detection level by our real-time PCR is 31 cycles). Dox treatment dramatically increased the expression of EGFP compared with that detected in this animal without Dox treatment. Animal 6 and its offspring carrying both transgenes are designated as the eIL-1R1 mice.
- Figure 3.
Representative microphotographs showing EGFP expression in the brain. A, No green fluorescence was found in nontransgenic animals. B, In eIL-1R1 animals that received no Dox in their drinking water (eIL-1R1-water), only sparse and weak green fluorescence on blood vessels were found (arrow). C, In eIL-1R1 animals that were fed with Dox (eIL-1R1-Dox) for at least 7 d, uniform and universal expression of EGFP was seen in endothelial cells of all the blood vessels in the brain. The inset in C shows a high-magnification photograph of a cell double labeled by anti-EGFP and anti-PECAM. Scale bar, 100 μm.
- Figure 4.
In-cell Western measurement of IL-1R1 expression in leukocytes of normal, eIL-1R1-water, and eIL-1R1-Dox animals. IL-1R1 was detected in leukocytes of all of these animals without significant difference. Mean ± SE are shown (n = 5/group).
- Figure 5.
Representative IHC labeling of IL-1R1 and ISSH labeling of c-fos in the PVN. A–C, No IL-1R1 labeling was found in IL-1R1 knock-out mice (A); IL-1R1 was detected in nontransgenic mice 2 h after intracerebroventricular injections of saline (B) or IL-1 (20 ng/mouse) (C). D, E, IL-1R1 was also found in eIL-1R1-water mice after intracerebroventricular injections of saline (D) and IL-1 (E). F, IL-1R1 was absent in eIL-1R1-Dox mice after intracerebroventricular injections of saline (data not shown) and IL-1. The boundaries of PVN were indicated by the dashed line. The inset in E shows a high-magnification photograph of IL-1R1 (green)- and PECAM (red)-labeled cells. a, ISSH labeling of c-fos was absent in the PVN of IL-1R1 knock-out mice after intracerebroventricular IL-1 injection. b, d, After intracerebroventricular saline injections, c-fos was absent in nontransgenic (b) and eIL-1R1-water mice (d). c, e, Two hours after intracerebroventricular IL-1 injection, c-fos expression was induced in nontransgenic (c) and eIL-1R1-water mice (e). f, In eIL-1R1-Dox mice, the induction of c-fos was absent after intracerebroventricular IL-1 injection. Scale bar, 100μm.
- Figure 6.
Quantitative analyses of ISHH labeling of c-fos-expressing cells in PVN (A) and VMPO (B) area of nontransgenic, eIL-1R1-water, and eIL-1R1-Dox mice 2 h after intracerebroventricular saline or IL-1 injection. Significant increases of c-fos-labeled cells were found in both PVN and VMPO after intracerebroventricular IL-1 injection in nontransgenic and in eIL-1R1-water animals, but was blunted in eIL-1R1-Dox animals. Mean ± SEM are shown (n = 5/group). The square in the inset in B indicates the region of quantification of c-fos-expressing cells in the VMPO. *Significant increase of c-fos-labeled cells (p < 0.05, Student's t test, saline vs IL-1). #Significant change of c-fos-labeled cells (p < 0.05, Student's t test, eIL-1R1-water vs eIL-1R1-Dox after IL-1 injection). MnPO, Median preoptic nucleus; MPA, medial preoptic area; LPO, lateral preoptic area; VOLT, vascular organ of the lamina terminalis; AVPe, anteroventral periventricular nucleus; 3V, third ventricle.
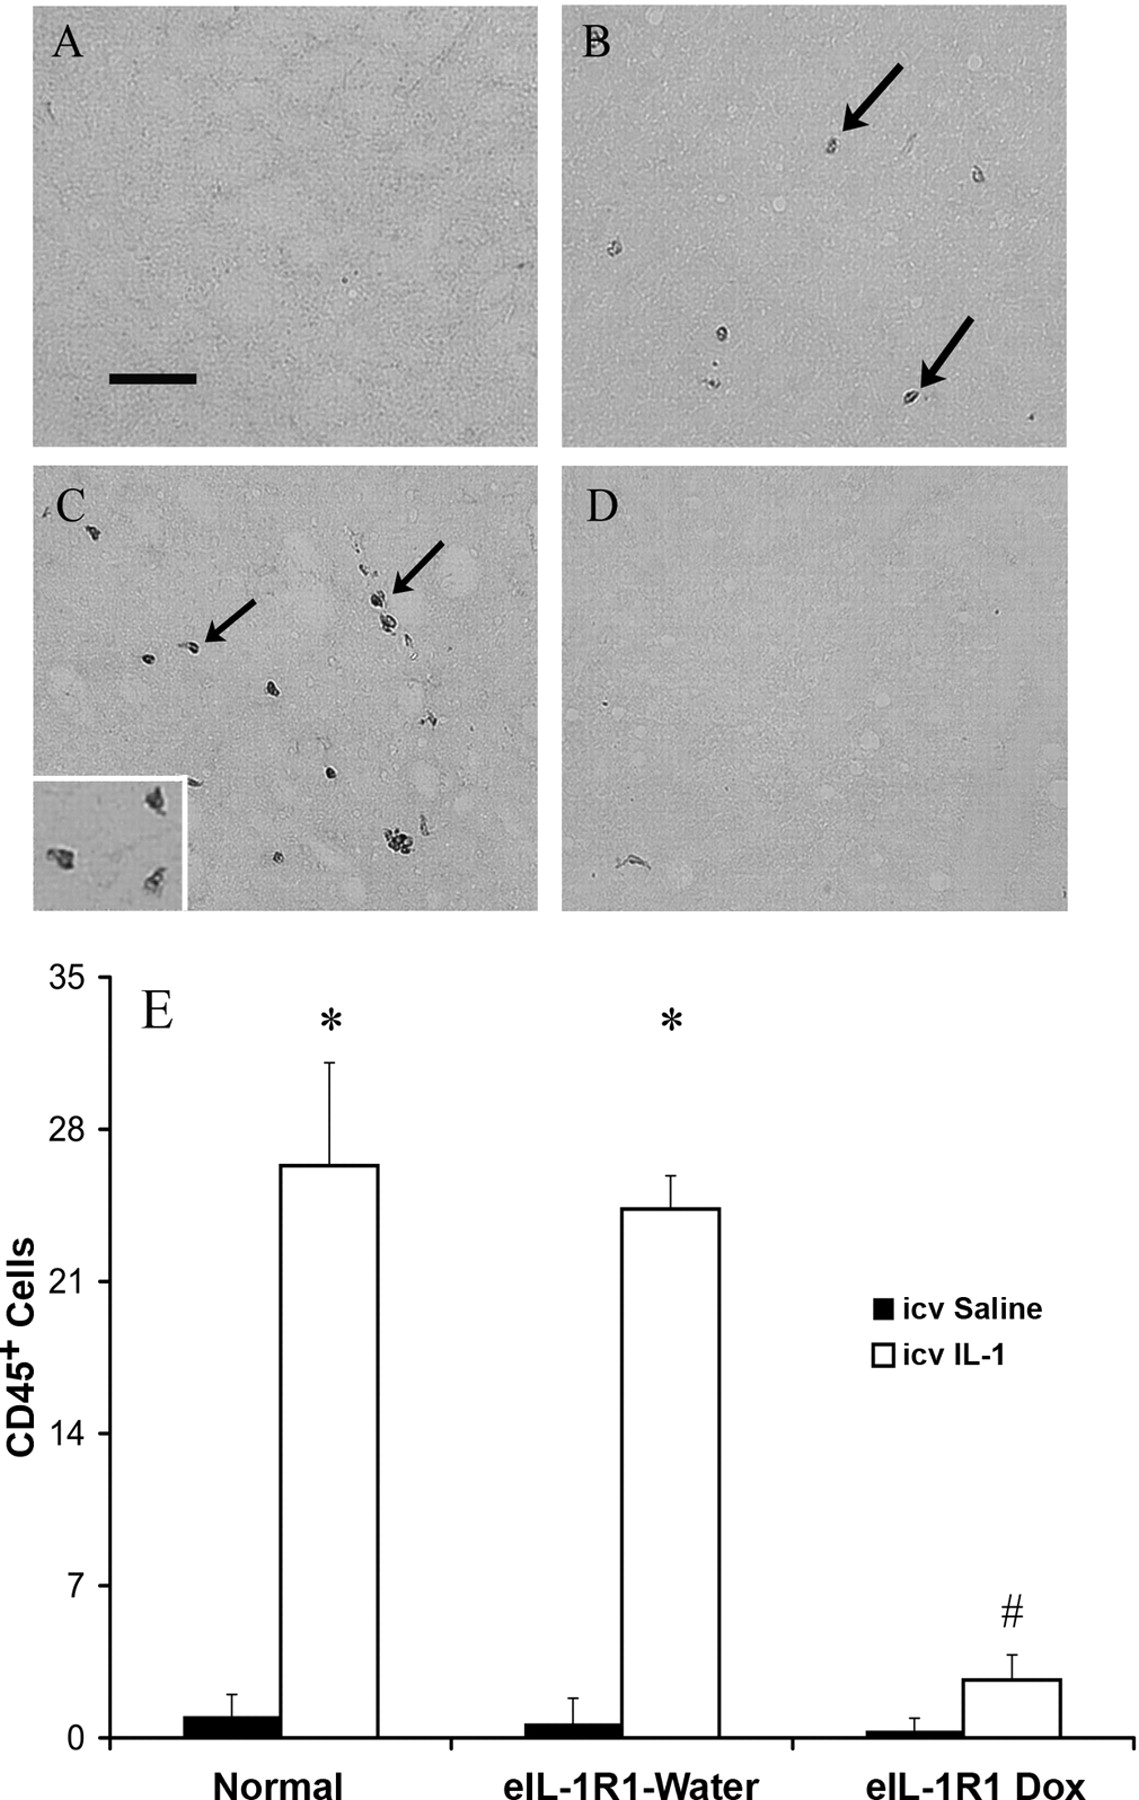
- Figure 7.
Representative microphotographs of CD45 labeling in brain parenchyma. The arrows in B and C point to CD45+ cells. Scale bar: (in A) A–D, 100 μm. A, No CD45+ cells were found in normal saline-injected animals. B, C, Widespread appearance of CD45+ cells was found 16 h after intracerebroventricular IL-1 injection in the brain parenchyma of nontransgenic (B) and eIL-1R1-water (C) animals. The presence of CD45+ cells in the brain parenchyma of eIL-1R1-Dox was absent after IL-1 injection. The inset in C shows a high-magnification picture of CD45+ cells. E, Quantitative analysis of the number of CD45+ cells. Mean ± SEM are shown (n = 5/group). *Significant increase of CD45-labeled cells (p < 0.05, Student's t test, saline vs IL-1). #Significant change of CD45-labeled cells (p < 0.05, Student's t test, eIL-1R1-water vs eIL-1R1-Dox after IL-1 injection).
- Figure 8.
Changes in core body temperature (ΔTco, °C) and activity counts (counts/min) in eIL-1R1-water and eIL-1R1-Dox animals that received intracerebroventricular injection of saline or IL-1β (20 ng/mouse) are shown. Mean ± SEM are shown (n = 5/group). The injections were always made at 10:00 A.M. (arrow). Time periods in which significant differences were detected between saline-injected and IL-1-injected animals are marked by black bars (p < 0.05). The x-axis depicts time of the day.
- Figure 9.
Changes in core body temperature (ΔTco, °C) and activity counts (counts/min) in eIL-1R1-water and eIL-1R1-Dox animals that received intraperitoneal injection of saline or IL-1β (25 μg/kg) are shown. Mean ± SEM are shown (n = 5/group).
- Figure 10.
Changes in core body temperature (ΔTco, °C) and activity counts (counts/min) in eIL-1R1-water and eIL-1R1-Dox animals that received intravenous injection of saline or IL-1β (30 μg/kg) are shown. Mean ± SEM are shown (n = 7/group).
- Figure 11.
Representative microphotographs showing Cox-2 IHC labeling in the preoptic area of the hypothalamus. The arrows point to example Cox-2 labeling on blood vessels. A, B, Induction of Cox-2 was found in eIL-1R1-water mice (B) 4 h after intracerebroventricular IL-1 injection but not in Cox-2 knock-out mice (A). C, D, Much less Cox-2 labeling was found after intraperitoneal (4 h after injection; C) and intravenous (2 h after injection; D) IL-1 injection. E, F, Cox-2 labeling was not detected in the brain of eIL-1R1-Dox animals after intracerebroventricular (E), intraperitoneal (data not shown), and intravenous (F) IL-1 injection. Double labeling of Cox-2 with PECAM shows colocalization of Cox-2 and PECAM after all three routes of IL-1 administration (insets in B–D). Scale bar, 100 μm. G, Quantitative analysis of the number of Cox-2-expressing blood vessels in eIL-1-R1-water and eIL-1R1-Dox mice after three different routes of IL-1 injection. Mean ± SEM are shown (n = 5/group). The number of Cox-2-labeled blood vessels was significantly reduced in eIL-1R1-Dox animals after intracerebroventricular IL-1 injection. *Significant decrease of Cox-2-labeled blood vessels (p < 0.05, Student's t test, eIL-1R1-water vs eIL-1R1-Dox). After intraperitoneal and intravenous IL-1 injection, Cox-2-labeled blood vessels were not detected in eIL-1R1-Dox animals. ND, Not detected.
- Figure 12.
Quantitative analyses of ISHH labeling of c-fos-expressing cells in PVN and VMPO. Induction of c-fos was found in the PVN of eIL-1R1-water mice 4 h after intraperitoneal and 2 h after intravenous IL-1 injection and in eIL-1R1-Dox mice 4 h after intraperitoneal IL-1 injection. A, Induction of c-fos was absent in the PVN of eIL-1R1-Dox mice 2 h after intravenous IL-1 injection. Similarly, induction of c-fos was found in VMPO of eIL-1R1-water mice after intraperitoneal and intravenous IL-1 injections and eIL-1R1-Dox mice after intraperitoneal IL-1 injection. B, Induction of c-fos was absent in VMPO in eIL-1R1-Dox mice after intravenous IL-1 injection. *Significant decrease of c-fos-expressing cells after intravenous IL-1 injections (p < 0.05, Student's t test, eIL-1R1-water vs eIL-1R1-Dox).


Additional Files
Supplemental Data
Files in this Data Supplement:
- supplemental material - Supplemental Legend
- supplemental material - Supplemental Figure 1
- supplemental material - Supplemental Figure 2


