

Article Figures & Data
Figures
- Figure 1.
Experimental protocol performed on days 0, 1, and 5. Subjects participated in two sets of experiments using this experimental protocol, testing the effect of PAS25 and PAS10 separately. All experiments and sessions of motor practice were performed in the morning.
- Figure 2.
Behavioral data showing the peak acceleration averaged for each minute of practice on each day. The practice was performed in two 4 min blocks, with a 4 min break in between to prevent fatigue. The data are normalized to the performance during the first minute of practice on day 1, which was not significantly different between the subjects (one-way ANOVA for subject, F(5,42) = 7.07; p = 0.09). The data obtained in the PAS25 and PAS10 studies have been pooled in this graph because there was no significant difference in performance on the two occasions.
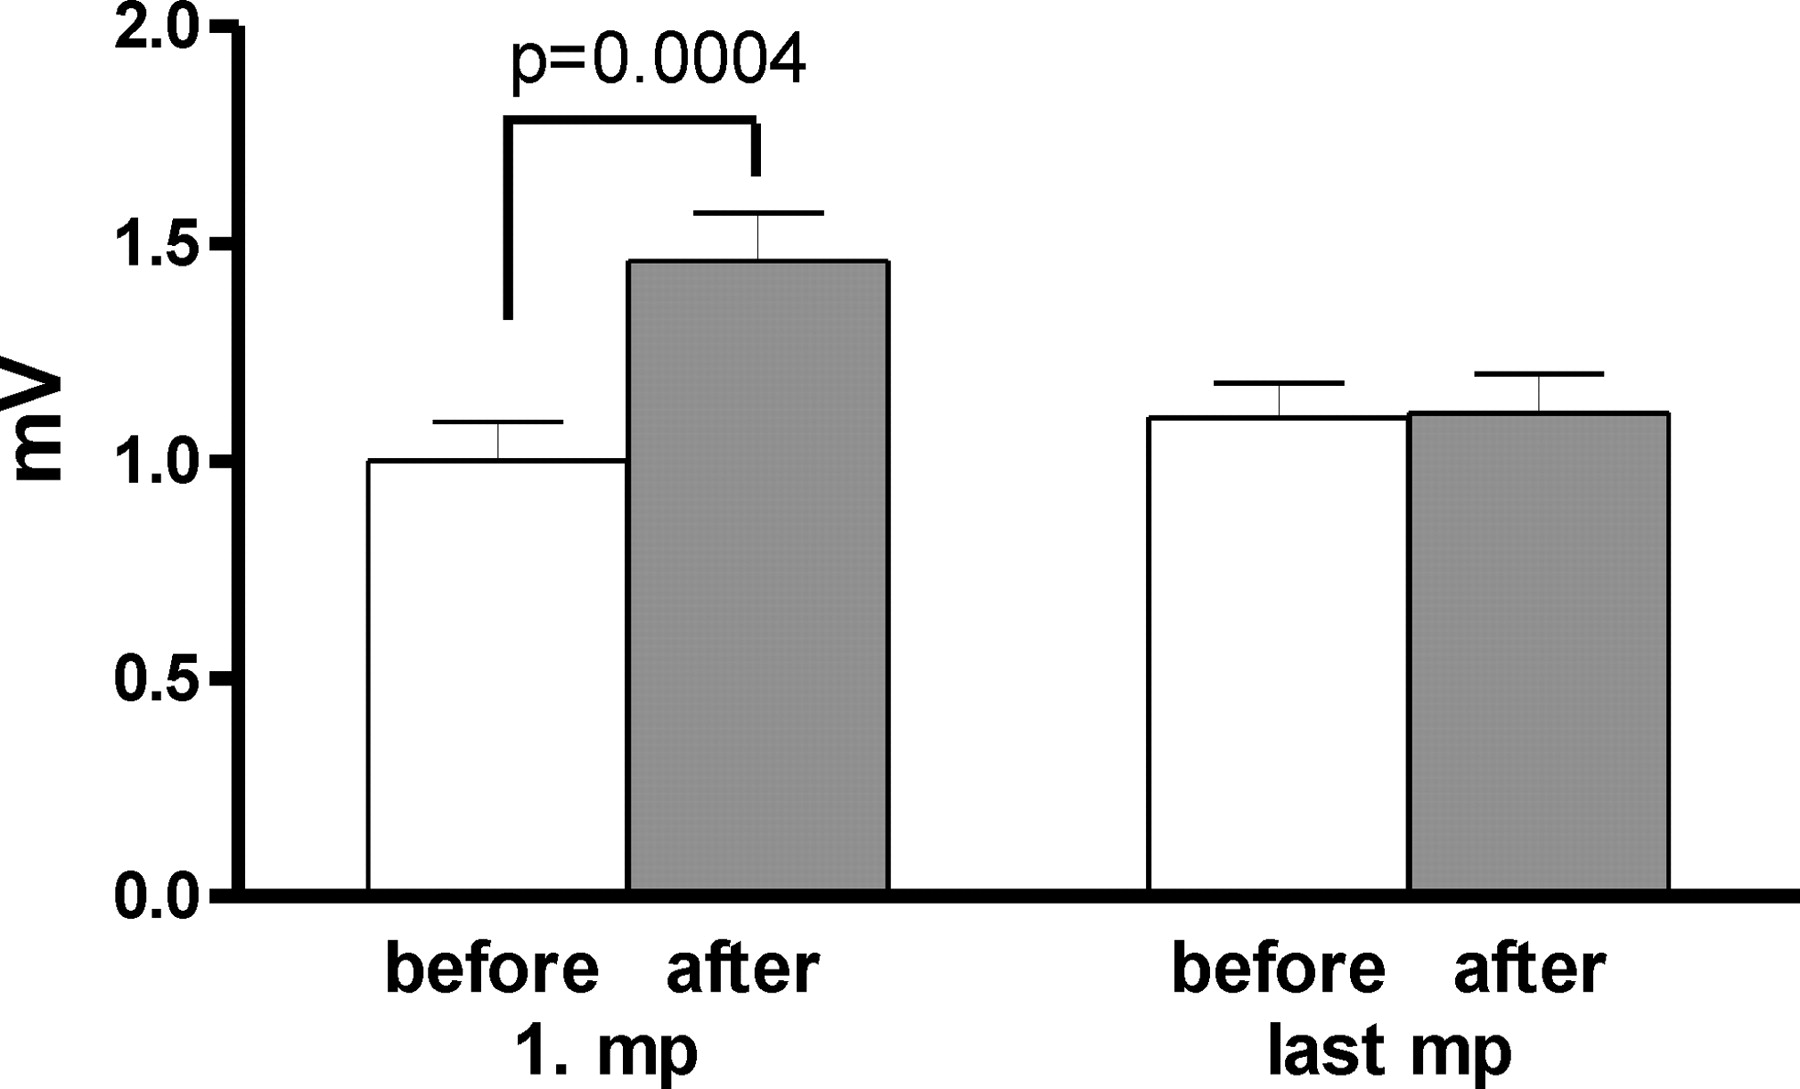
- Figure 3.
Mean (±SE) amplitude of the MEPs of APB on days 1 and 5, before and after the first or last motor practice. On day 1, motor practice increased the MEP size significantly (t test, p = 0.0004), although it had no influence on day 5. (ANOVA, day 1/day 5 by motor practice, F(1,5) = 187.43; p < 0.0001).
- Figure 4.
IO curves measured in the APB muscle on days 1 and 5, before and after motor practice. A–C display the mean MEP amplitude (±SE) on the y-axis against the stimulus intensity on the x-axis (in percentage of SI1mV). A shows the IO curves measured on day 1 before and after the first motor practice. B shows the data for day 5 before and after the last motor practice. C compares the baseline IO curve on days 1 and 5 before motor practice. Asterisks indicate statistically significant differences between the displayed curves (paired t test, *p ≤ 0.05; **p ≤ 0.01). D displays the slopes of the IO curves on day 1 and day 5 before (white column) and after (gray column) motor practice. The slope of the curve has been calculated for the approximately linear part between 90 and 130% SI1mV. The IO curve on day 1 was significantly steeper after motor practice. In contrast, practice had no effect on the IO curve on day 5. However, the baseline IO curve on day 5 was steeper than on day 1. Statistical results (t test, p values) of the direct comparison of the slopes before and after motor practice on days 1 and 5 are given in D.
- Figure 5.
SICI obtained with a stimulus intensities of 70, 80, and 90% of aMT. The amount of inhibition is displayed as the size of the conditioned MEP as a percentage of MEP evoked by the test pulse alone (±SE). A displays the SICI before and after the first motor practice on day 1. B shows the same data for day 5. C displays a comparison of the SICI on day 1 and day 5 before motor practice. Higher values indicate reduced SICIs; lower values indicate increased SICIs. On day 1, practice reduced SICI, although this was not the case on day 5. However, there was less SICI before motor practice on day 5 than on day 1 (ANOVA, day 1/day 5 by conditioning SI, F(2,10) = 12.61; p = 0.002). Asterisks indicate statistically significant differences when comparing the displayed data directly (paired t tests, *p ≤ 0.05; **p ≤ 0.001).
- Figure 6.
Effect of motor practice on SMO. SICI (±SE) is expressed as percentage inhibition relative to unconditioned control values. A–C show data obtained in APB, FDI, and ADM, respectively. Each graph shows two sets of data, for days 0 and 5. On each day, the four columns display the amount of SICI measured without muscle vibration (novib), during vibration of APB (vibAPB), during vibration of FDI (vibFDI), and during vibration of ADM (vibADM). A decrease in SICI is shown as increased column size and an increase in SICI as reduced column size. On day 1, short-term vibration decreases SICI in the vibrated muscle and increases SICI in the nonvibrated muscles. On day 5, vibAPB causes a stronger decrease of SICI, especially in the APB and FDI. Statistical results (t test; p values) of direct comparisons of days 0 and 5 are given in the figure.
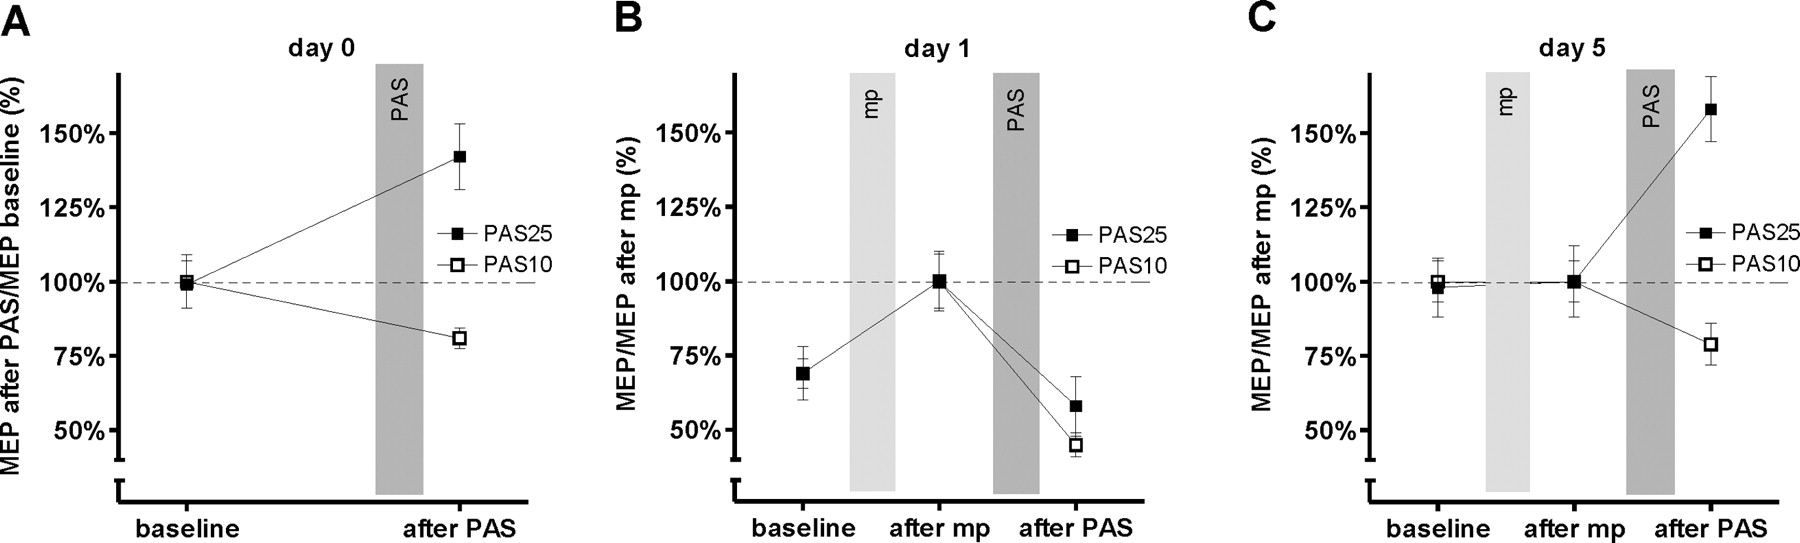
- Figure 7.
Mean MEP (±SE) on days 0, 1, and 5 in the APB. A shows the MEPs on day 0 expressed as percentage of baseline MEPs. B and C show the MEPs on days 1 and 5, respectively, expressed as percentages of MEPs after motor practice. On day 0, PAS25 enhanced and PAS10 decreased the MEPs. On day 1, motor practice increased the MEP relative to baseline, but the subsequent PAS effect was changed: both PAS10 and PAS25 decreased the MEP. On day 5, motor practice did not change MEP size relative to baseline whereas the PAS effects were similar to those on day 0. The interaction of day 0/day 1/day 5 by PAS type by before/after PAS was significant (three-way ANOVA, p < 0.004).
- Figure 8.
IO curves on days 0, 1, and 5. A–C display the mean MEP amplitude (±SE) on the y-axis against the stimulus intensity on the x-axis (in percentage of SI1mV). The IO curves obtained before and after motor practice were not significantly different in the experiments testing PAS25 and PAS10 and were therefore pooled. A shows the IO curves measured on day 0 before and after PAS25 and PAS10, respectively. B and C show the IO curves measured on days 1 and 5, respectively. PAS25 increased and PAS10 decreased the steepness of the IO curve on day 0. On day 1, motor practice made the IO curve steeper whereas subsequent PAS25 and PAS10 now reduced the IO curve below baseline levels. On day 5, motor practice had no effect on the IO curve and the effects of PAS25 and PAS10 had returned to those seen on day 0. D shows the slopes for all IO curves as displayed in A–C. Statistical analysis performed on these data with three-way ANOVA showed a significant interaction of day 0/day 1/day 5 by before/after PAS by PAS type (p < 0.01).


Tables
- Table 1.
The mean stimulus intensities (±SE) are given for the aMT, SI1mV, and SMO condition SIs in percentage of stimulator output, and for the sensory threshold
PAS25 PAS10 aMT (%) SI-1mV (%) SMO SI (%) Sensory threshold (mV) aMT (%) SI-1mV (%) SMO SI (%) Sensory threshold (mV) day 0 31.3 ± 2.5 47.2 ± 3.9 28.7 ± 4.2 32.0 ± 6.3 30.8 ± 2.4 47.7 ± 4.4 29.0 ± 4.2 32.5 ± 8.2 day 1 31.5 ± 3.0 48.3 ± 4.4 32.0 ± 4.1 34.3 ± 4.0 30.5 ± 2.5 48.0 ± 4.5 29.7 ± 4.3 31.3 ± 6.0 day 5 31.5 ± 3.0 45.2 ± 4.4 32.0 ± 4.1 34.3 ± 4.0 29.3 ± 2.6 45.0 ± 4.3 28.8 ± 3.5 29.7 ± 5.2


