

Article Figures & Data
Figures
- Figure 1.
Amplification of the EPSPs induced by sinusoidal stretches of the TS muscle. A, Control condition (no artificial PIC, A1) and effect of an artificial PIC (ḡPIC = 100 nS, A2–A4). Bottom traces, Variations of the muscle length when the frequency increases from 1 to 25 Hz. Top traces, Intracellular record of a TS motoneuron (average of 3 recordings). Dashed line, Resting potential in control condition. Hyperpolarization of the baseline at high frequencies was likely attributable to the deactivation of Ih. B, Amplification gain against stretch frequency. Filled circles, τPIC = 50 ms; open triangles, τPIC = 10 ms; filled triangles, τPIC = 1 ms. Gin = 1.1 μS. Axonal conduction velocity, 90 m/s. Inset, Response of a TS spindle primary ending. Bottom, Muscle length. Middle, Extracellular recording of an Ia afferent within the dorsal column. Top, Instantaneous frequency of the discharge. This afferent fiber was identified as an Ia fiber because: (1) its conduction velocity was 90 m/s; (2) although the receptor was silent at the initial length, a spontaneous stationary discharge at ∼10 Hz was observed when the length was increased by 160 μm (data not shown); (3) the frequency modulations increased with the stretch frequency because of the dynamic sensitivity of the primary ending.
- Figure 2.
Subthreshold resonance in a motoneuron. A, Voltage response (average of 4 recordings, top trace) to a ZAP current (bottom trace) of constant amplitude (4 nA peak-to-peak) and increasing frequency (from 0 to 40 Hz; see Materials and Methods). B, Impedance computed as the ratio of the fast Fourier transforms of voltage and current. Peak at 12 Hz indicates the resonance (dashed line). Same motoneuron as in Figure 1.
- Figure 3.
Membrane hyperpolarization increases the resonance quality. A, Voltage (top) and modulus of the impedance (IZI) (bottom) in response to the same ZAP (middle) at −80 mV (left), −71 mV (resting potential; middle), and −60 mV (right). TS motoneuron; Gin = 1.2 μS; conduction velocity, 100 m/s. B, Quality factor variations (Q − Qrest)/Qrest against holding potential (relative to rest). Neurons are identified by different symbols (filled circles, neuron in A). For two motoneurons, the resonance was maximal at rest and decreased during hyperpolarization (bottom left quadrant). Ih was likely fully activated at hyperpolarized levels and became insensitive to voltage changes.
- Figure 4.
Resonance quality was linearly correlated to sag ratio. Quality factor against sag ratio for 45 motoneurons. Dashed line, Best linear fit. Open circles, The six motoneurons without resonance.
- Figure 5.
Modeling the impact of the dendritic Ih current on the resonance properties. A, FRC curve (semilogarithmic scale). The modulus of the impedance (IZI) is normalized to 1 at zero frequency. It is shown for four distributions of Ih in the soma and dendrites: a, Passive dendrites (with 5 ms time constant), somatic Ih of strength KhS = −0.5, and activation time constant τh = 100 ms (solid line). b, Same conductance of the Ih current in the soma and in the dendrites (KhS = KhD = −0.5; dashed line). c, Conductance of the dendritic Ih doubled (KhD = −1; dash-dotted line). d, No somatic Ih (KhS = 0, KhD = −0.5; dotted line). B, The sag ratio at the soma, R, is displayed against the ratio of the dendritic and somatic conductances of the Ih current. The black dots labeled from a to c correspond the first three distributions of Ih considered in A.
- Figure 6.
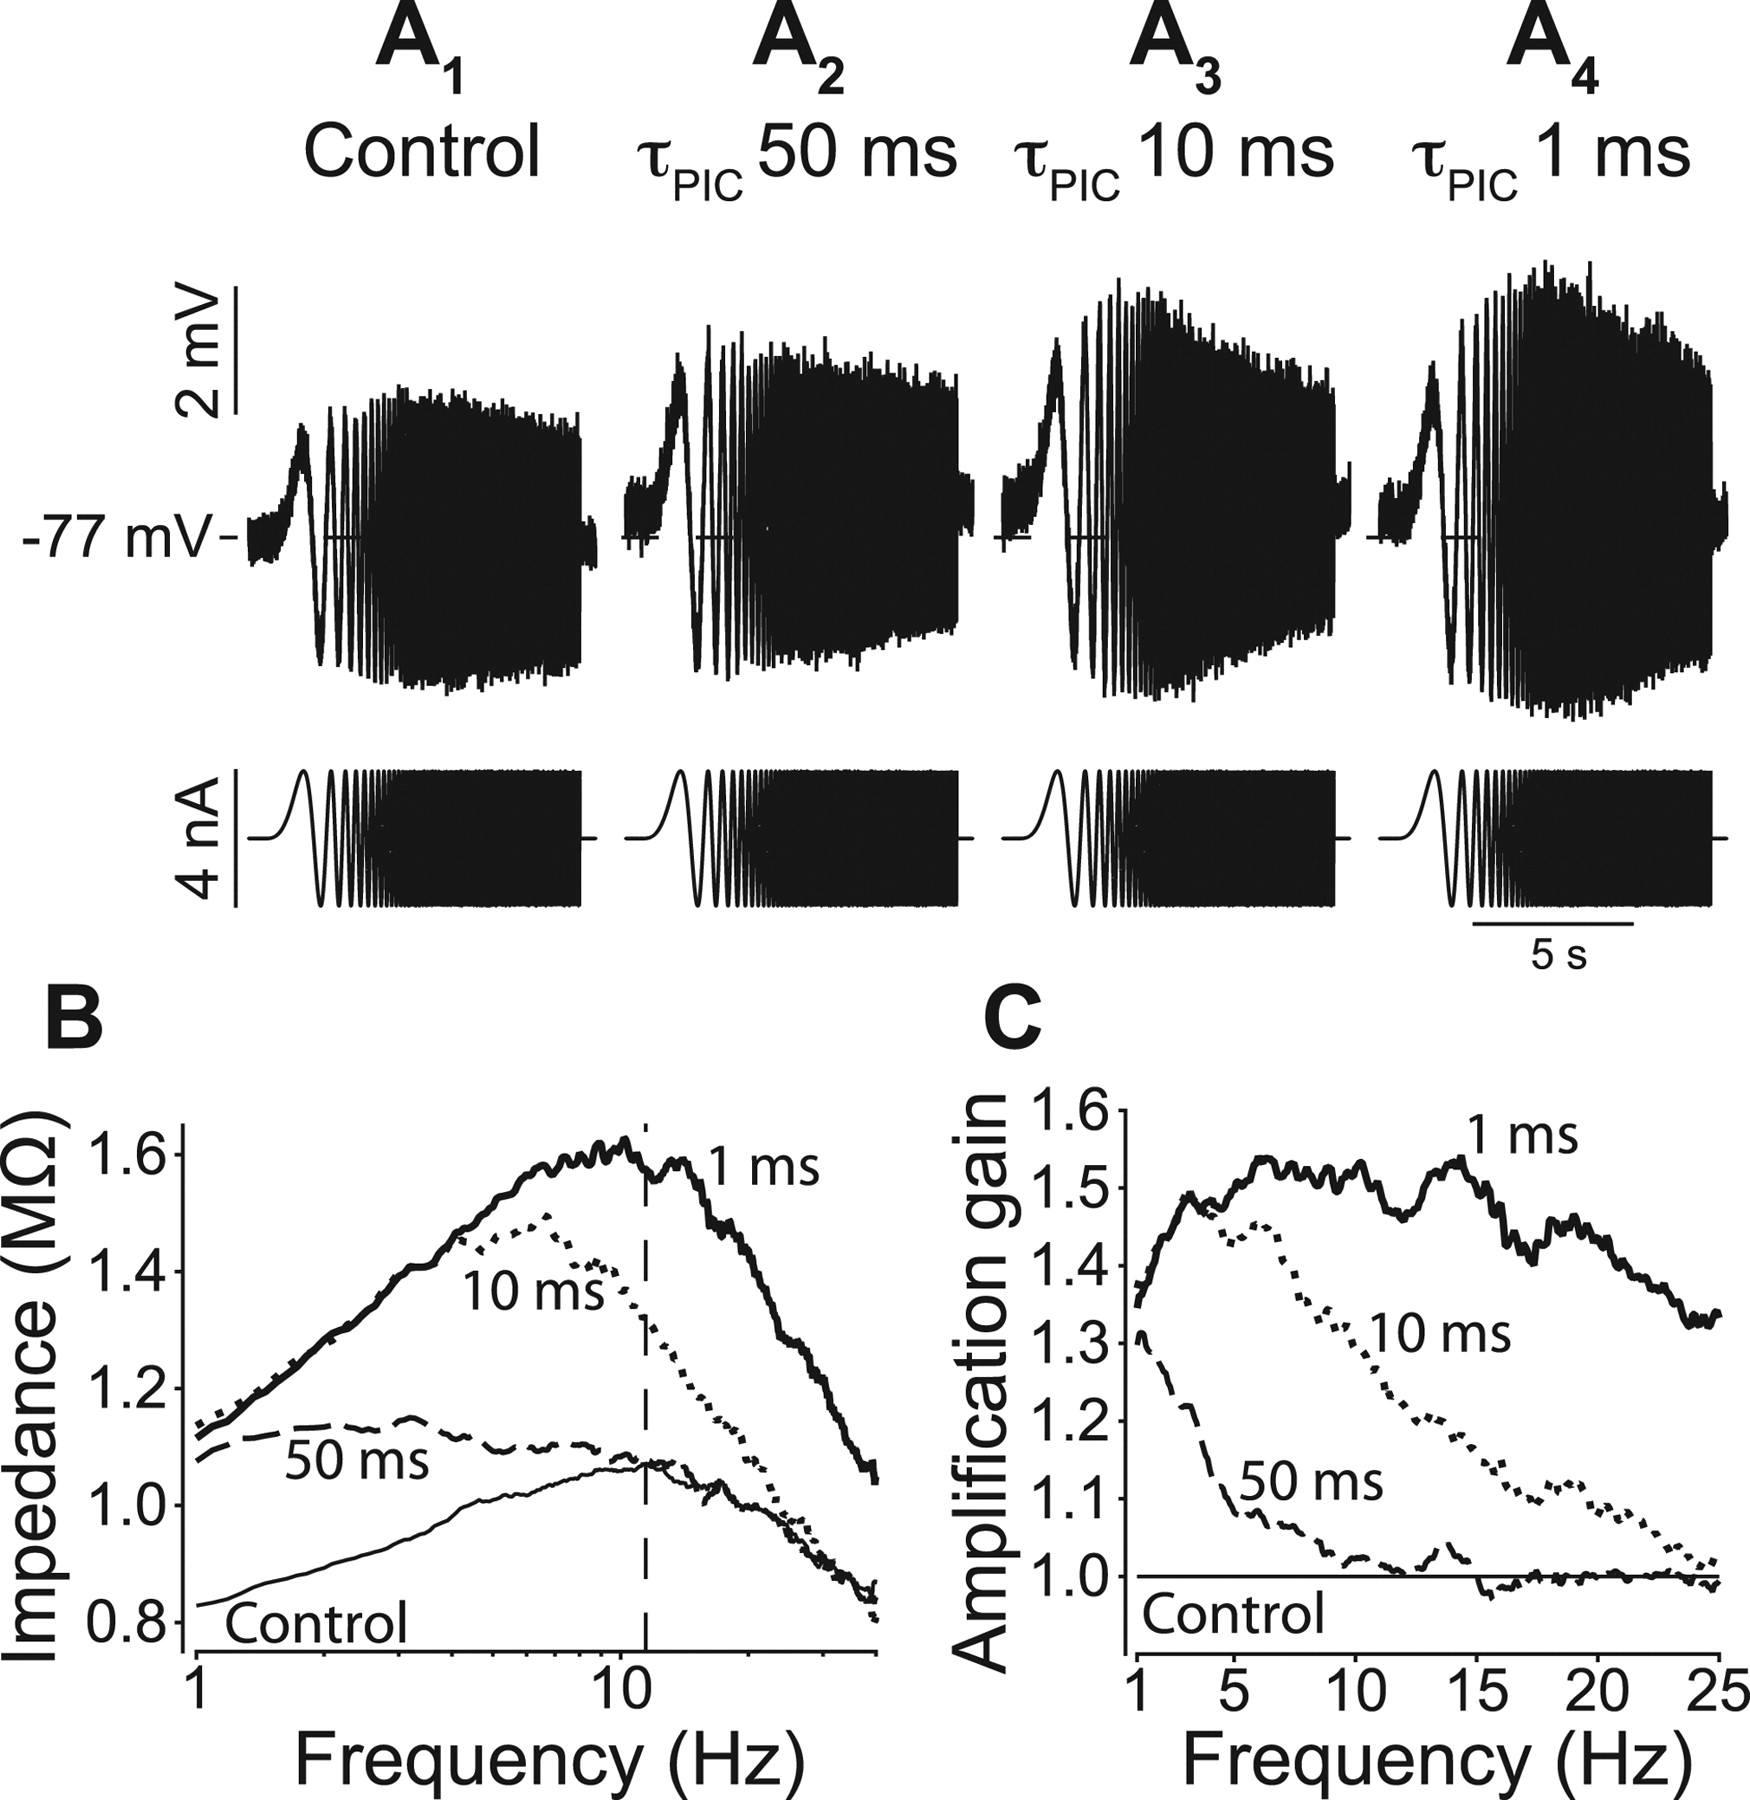
Changes in FRC elicited by artificial PICs. A1–A4, Bottom, ZAP. Top, Voltage (average of 3–4 records). Dashed line, Resting potential in control condition. B, Control FRC (thin solid line) and FRC with PIC. τPIC = 1 ms (thick solid line), 10 ms (dotted line), or 50 ms (dashed line). C, Amplification gain against frequency (ratio of FRC with PIC to control FRC). Same symbols as in B. Horizontal line indicates no amplification. Same motoneuron as in Figures 1 and 2.
- Figure 7.
Impact of dendritic PICs on the transfer impedance from the dendrite to the soma in the motoneuron model. The transfer impedance (Ztrans) is plotted against the frequency: control (no PIC, KhS = 0, KhD = −0.5; solid line), fast PIC (τPIC = 1 ms, KPICD = 0.5; dashed line), slow PIC (τPIC = 100 ms) of same strength (KPICD = 0.5; dash-dotted line), and doubled strength (KPICD = 1; dotted line).
- Figure 8.
Differential amplification of dynamic and static components of Ia input elicited by a ramp-and-hold stretch. A1–A3, Bottom, Muscle length. Top, EPSPs (average of 3–4 records) in control condition (no PIC, A1) and with a fast (A2) or a slow (A3) PIC. Dynamic response measured by the peak amplitude (filled arrow). Static response measured by average amplitude over the last 500 ms of holding (open arrow). B, Amplification of dynamic (filled squares) and static (open circles) components against τPIC. TS motoneuron; Gin = 1.0 μS; conduction velocity, 90 m/s (probably fast type).
- Figure 9.
Input amplification in nonresonant motoneurons. A1–A4, Bottom, ZAP. Top, Voltage (average of 3 records). ḡPIC = 50 nS. B, FRC without PIC (thin solid line) and with PIC. τPIC = 1 ms (thick solid line), 10 ms (dotted line), or 50 ms (dashed line). C1–C3, Bottom, Muscle length. Top, EPSPs without PIC (C1), with fast PIC (1 ms), ḡPIC = 25 nS (C2) or 50 nS (C3). Average of three to five recordings. Note aborted plateau potential in C2 (arrow). TS motoneuron (Gin = 0.4 μS) with no Ih current (neither sag nor resonance, probably slow type).
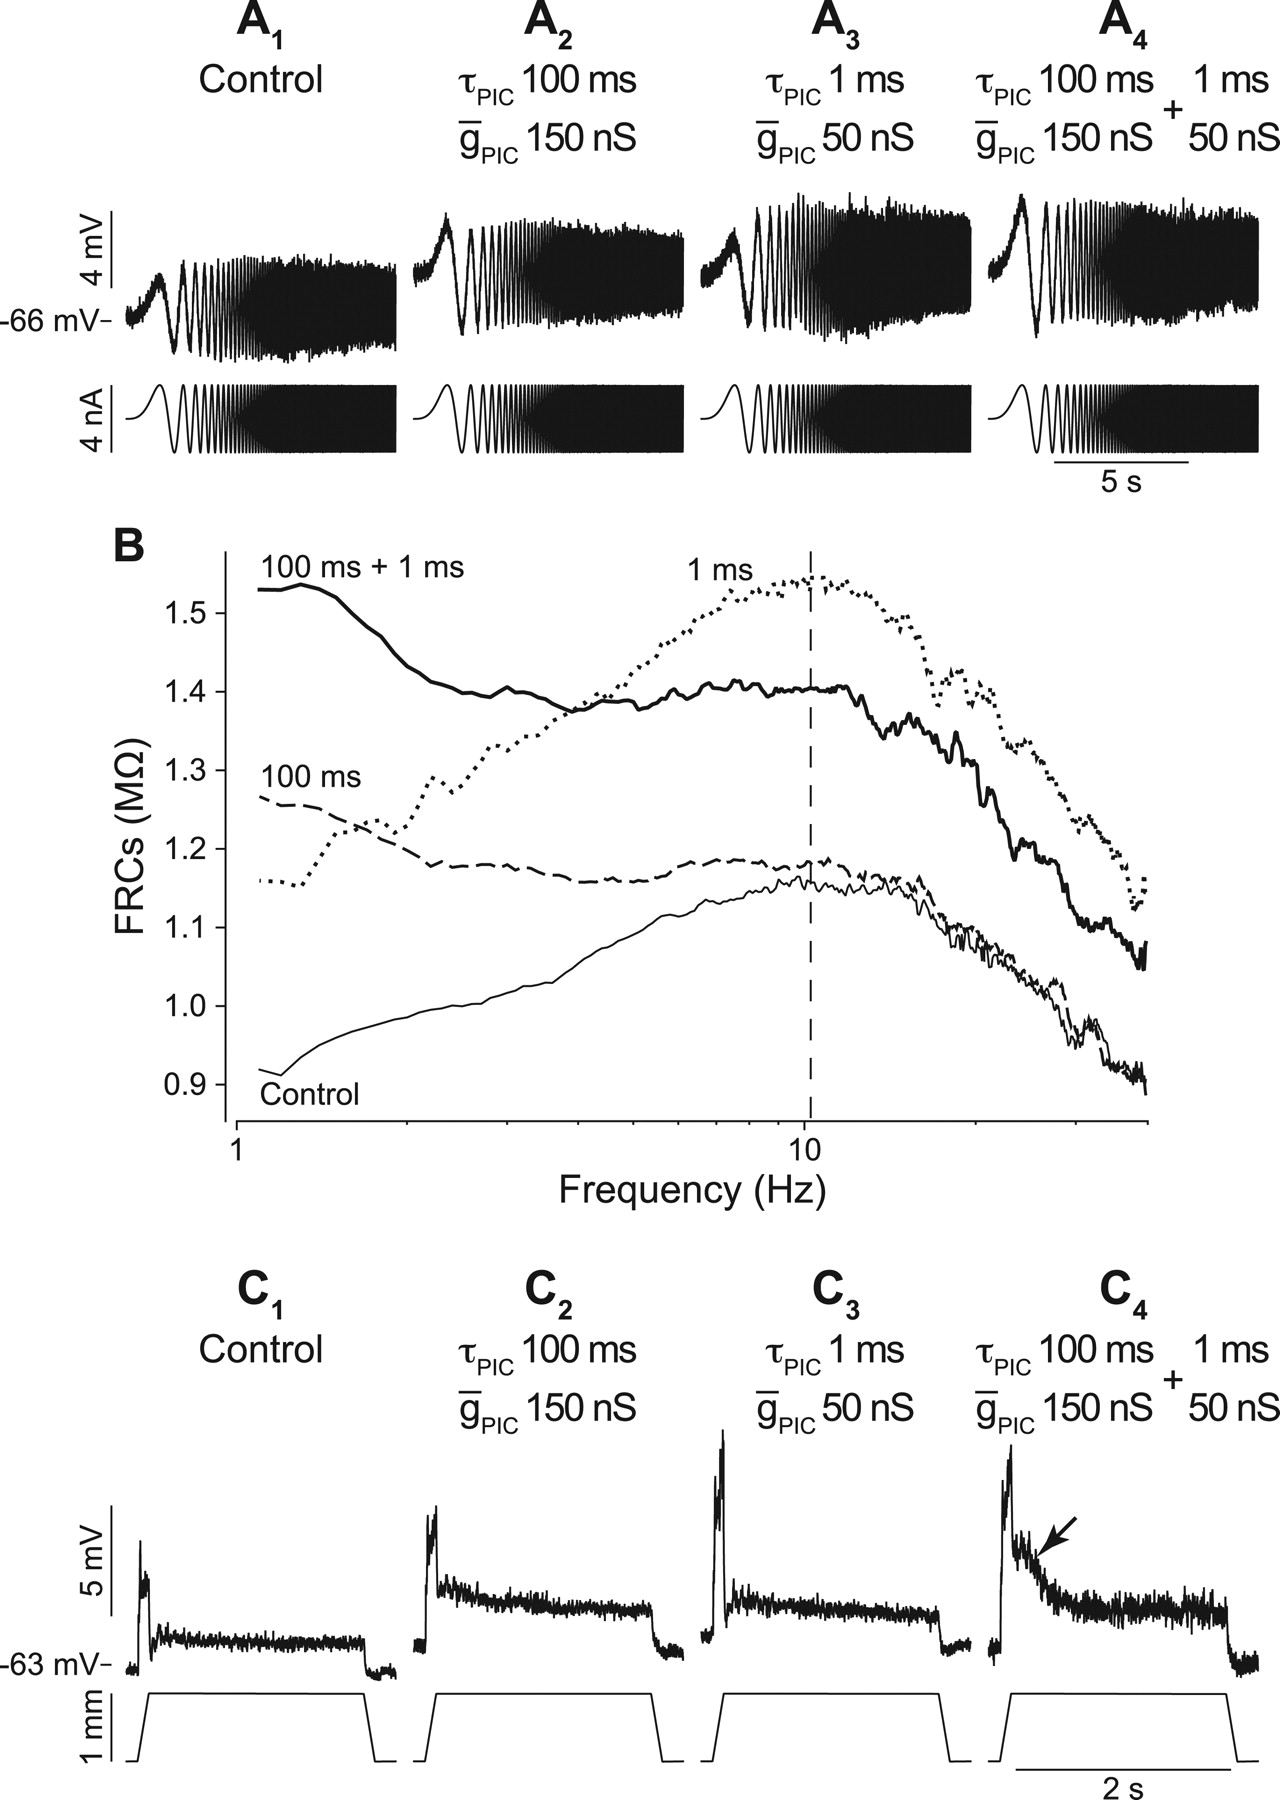
- Figure 10.
Slow PIC conditioned the impact of fast PIC. A1–A4, Bottom, ZAP. Top, voltage (average of 3–4 records). In A4, a slow PIC and a fast PIC were added concurrently. B, FRC without PIC (thin solid line), with slow PIC alone (dashed), with fast PIC alone (dotted), and with both PICs (thick solid line). C1–C4, Bottom, Muscle length. Top, EPSPs without PIC (C1), with slow PIC (C2), with fast PIC (C3), and with both PICs (C4). Average of two to five recordings. Arrow in C4 points to an aborted plateau potential. TS motoneuron; Gin = 1.2 μS; conduction velocity, 100 m/s (probably fast type).


