

Article Figures & Data
Figures
- Figure 1.
Effects of the Kv7/KCNQ/M-channel opener retigabine (Ret) on somatic subthreshold responses and excitability in CA1 pyramidal neurons. A, The somatic voltage responses of a neuron to injection of current ramp at the soma, under control conditions [(1), black], after focal perisomatic application of retigabine (20 μm) [(2), red], and after bath application of retigabine (20 μm) [(3), green]. B, The same traces as in A, shown at an expanded voltage scale (the spikes are clipped). C, D, The somatic chord resistance (RChord) (C) and current threshold (IThreshold) (D) values of five neurons under control conditions, after focal perisomatic application of retigabine, and after subsequent bath application of retigabine. **p < 0.01; NS, not significant.
- Figure 2.
Effects of retigabine on dendritic subthreshold responses and excitability in CA1 pyramidal neurons. A, The dendritic voltage responses of a neuron to dendritic current ramp injection before (black) and after (red) focal application of retigabine (Ret; 20 μm) to the dendritic recording site (218 μm from the soma). B, Typical example of the dendritic voltage responses to dendritic current ramp injection (239 μm from the soma) before (black) and after (green) bath application of retigabine (20 μm). Arrows indicate the first backpropagating spikes, and asterisks indicate dendritic Ca2+ spikes. C, D, The same traces as in A and B, respectively; the voltage responses between −66 mV and spike threshold were superimposed on expanded scales. Arrows indicate the first spikes evoked by current ramp injection before (black) and after (green) bath applying retigabine. E, F, The dendritic chord resistance (RChord) (E) and current threshold (IThreshold) (F) values of all of the six cells tested, under control condition, after dendritically applied retigabine, and after subsequent bath-applied retigabine. In three of the cells (▴), RChord was reduced after bath-applied retigabine, but retigabine caused no significant change in RChord in the set of all six cells (E) (NS, not significant), whereas IThreshold was significantly changed (F). **p < 0.01.
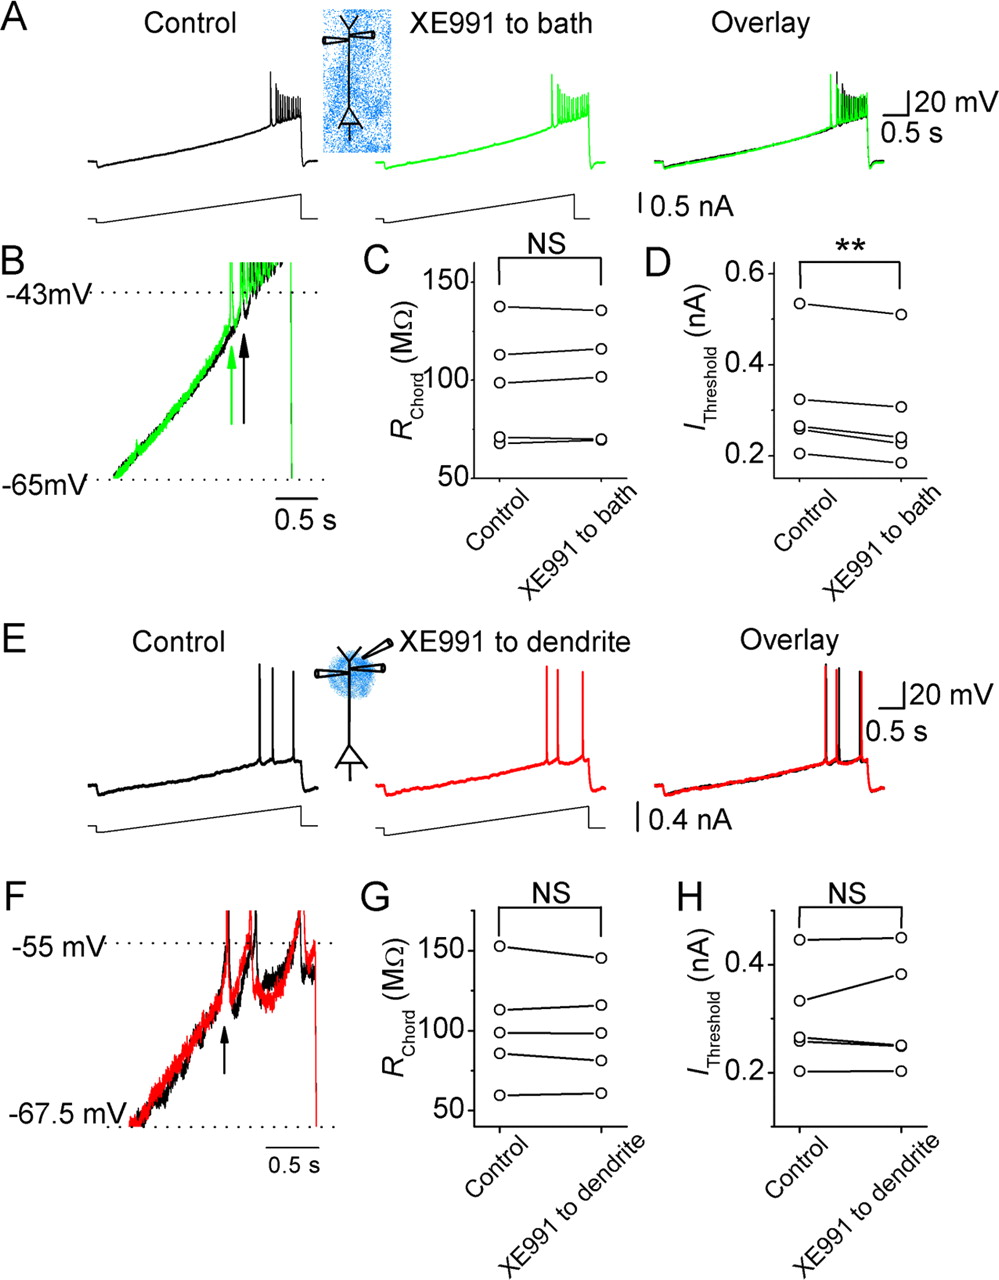
- Figure 3.
Effects of the Kv7/KCNQ/M-channel blocker XE991 on the somatic subthreshold excitability of CA1 pyramidal neurons. A, The somatic voltage responses of a CA1 pyramidal neuron to somatic injection of a current ramp before (black) and after (green) bath application of XE991 (20 μm). B, Traces from A superimposed on expanded scales. Arrows indicate the first action potentials in response to the somatic current ramp injection before (black) and after (green) bath application of XE991. C, D, The somatic RChord and IThreshold values of six cells before and after bath applying XE991 (20 μm). E, The somatic voltage responses of a neuron to somatic injection of a current ramp before (black) and after (red) focal application of XE991 (20 μm) to the perisomatic region. F, Traces from E superimposed on expanded scales. Arrows indicate the first spikes in response to somatic current ramp injection before (black) and after (red) focally applied XE991. G, H, The somatic RChord (G) and IThreshold (H) values of six cells before and after focal application of XE991 to the perisomatic region. *0.01 < p < 0.05; **p < 0.01.
- Figure 4.
Effects of XE991 on the dendritic subthreshold excitability of CA1 pyramidal neurons. A, Dendritic voltage (∼300 μm from the soma) responses to dendritic injection of a current ramp under control conditions (black) and after bath applying XE991 (20 μm; green). B, The traces from A superimposed on expanded scales. Note that the first backpropagating action potential appeared earlier in the response to current ramp injection after bath applying XE991. Arrows indicate the time point of the first backpropagating action potentials before (black) and after (green) XE991. C, D, The dendritic RChord (C) and IThreshold (D) values of five cells before and after bath-applied XE991. E, The dendritic (217 μm from the soma) voltage responses of a CA1 pyramidal cell to dendritic current ramp injection before (black) and after (red) focal application of XE991 (20 μm) near the recording site. F, The traces from E superimposed on expanded scales. Note that focally applied XE991 to the dendrite had no effect on the timing of the first action potential in response to current ramp injection. G, H, The dendritic RChord (G) and IThreshold (H) values of all five cells tested, before and after application XE991 (20 μm) to the dendrite. **p < 0.01; NS, not significant.
- Figure 5.
Effects of linopirdine on calcium spikes in CA1 pyramidal neurons. A, Typical example showing the effects of perisomatically applied linopirdine (30 μm; red) on the Ca2+ spike. B, Normalized time course of the effect of perisomatically applied linopirdine on the integral of the depolarizing response, including the Ca2+ spike. C, Summary diagram showing the effect of perisomatically applied linopirdine on the response integral (n = 4). D, The depolarizing response integral values from four cells before and after perisomatically applied linopirdine. E, Ca2+ spikes under control conditions [(1), black trace], after dendritic application of 30 μm linopirdine (212 μm from the soma) [(2), red], and then after bath applying 30 μm linopirdine [(3), green]. F, Normalized time course of the effect of dendritic focal application of linopirdine (Lin) and subsequent bath-applied linopirdine on the response integral. G, Summary diagram showing the response integral, under control conditions, after focally applying linopirdine to the dendrite, and then after bath applying linopirdine for all cells tested (n = 4). **p < 0.01; NS, not significant. H, Depolarizing response integral values from four cells under control conditions, after dendritic application of linopirdine, and subsequently after bath applying linopirdine. In all of the experiments illustrated in this figure, the hippocampal slices were incubated with 20 μm retigabine (to boost the M-current), 10 μm DNQX, 1 μm TTX, and 3 mm 4-AP, which were all routinely added to all the extracellular media. Ca2+ spikes were evoked by injecting a 300-ms-long depolarizing current pulse into the soma from a membrane potential of −68 mV.
- Figure 6.
Effects of retigabine on the excitability of CA1 pyramidal neurons under hyperexcitable conditions. A, Representative example showing that perisomatic application of retigabine (20 μm; Ret, red) reduced the excitability of the neuron. B, Normalized time course of perisomatically applied retigabine on the average action potential (AP) frequency in response to injection of 900-ms-long depolarizing current pulses of constant intensity. C, Average action potential frequency plotted against the amplitude of the current injected into the neuron, before (black) and after focal perisomatic application of retigabine (20 μm; red). *0.01 < p < 0.05; n = 4. D, Typical example showing the effects of 20 μm retigabine applied to the dendrite (292 μm from the soma; red trace) and subsequent bath-applied retigabine (20 μm; green) on the excitability of a CA1 pyramidal neuron. E, Normalized time course of dendritically applied and subsequent bath-applied retigabine (20 μm) on the average action potential frequency in response to injection of 900-ms-long depolarizing current pulses of constant intensity (n = 5). F, Average action potential frequency plotted against the amplitude of the injected current pulse, under control condition (black), after focal application of retigabine (20 μm) to the dendrite (red), and after subsequent bath-applied retigabine (green). *0.01 < p < 0.05; **p < 0.01; n = 5. Note that dendritically applied retigabine had no significant effect on the input (I)/output (mean spike frequency) properties of the cells. In all experiments used in this figure, the slices were incubated with 10 μm DNQX and 2–3 mm 4-AP. Action potential trains were evoked by injecting 900-ms-long depolarizing current pulses into the soma from a membrane potential of approximately −68 mV.
- Figure 7.
The M-channel-dependent mAHP at depolarized membrane potentials originates perisomatically in CA1 pyramidal neurons. A, Simultaneous whole-cell recording from the soma (black) and apical dendrite (195 μm from the soma; blue traces) of the same CA1 pyramidal neuron, showing the responses to somatic injection of a depolarizing current pulse (100 ms, 0.6 nA). At both recording sites, the background membrane potential was adjusted to approximately −58 mV with steady current injection. The depolarizing parts of the responses are truncated to emphasize the afterhyperpolarizations, but the insets show the full spike amplitudes (calibration: 30 mV, 0.1 s). Note that both the mAHP (filled triangle) and sAHP (open triangle) are smaller in the dendrite. B, The ratio of dendritic to somatic mAHP amplitude plotted against the distance between the dendritic and somatic recording pipettes. C, Summary diagram showing the effect of perisomatic application of XE991 (20 μm) on the mAHP (**p < 0.01; n = 4). D, The amplitude of the mAHP from four neurons before and after perisomatic XE991 application. E, Typical example showing the mAHP (filled triangle) after a train of four somatic action potentials, under control condition (black trace), after focal application of XE991 to the perisomatic area (red trace), and then after bath applying XE991 (green trace). Note that perisomatic XE991 fully blocked the mAHP and occluded the effect of subsequent bath-applied XE991. In the cell illustrated in E and two of the cells in C and D, the slice was incubated with 50 μm forskolin before testing to block sAHP.
- Figure 8.
Effects of retigabine (20 μm) on field EPSPs and population spikes (PS) recorded simultaneously in area CA1. A, A tungsten electrode positioned in the middle of the stratum radiatum was used to stimulate Schaffer collaterals at 50 Hz (11 shocks). Field electrode 1 was placed proximal to the stimulation electrode in the stratum pyramidale, and field electrode 2 was positioned more distal from the stimulation site in the stratum radiatum. The current amplitude of the stimulation was adjusted to just below the amplitude that evokes population spikes in the stratum radiatum as observed by field electrode 2. Bicuculline (10 μm) and APV (100 μm) were routinely added to the perfusion medium. B, Typical example of the responses in the stratum pyramidale and stratum radiatum. Application of 20 μm retigabine (red trace) reduced the population spikes but not the fEPSPs. C and D show the average normalized time course of the retigabine effect on the amplitude and area of the last evoked population spike and fEPSP, respectively (n = 7 slices). E, Summary data of the retigabine effect on the population spikes amplitude in response to the 2nd, 6th, and 11th stimulus (Sti.) (NS, not significant; *0.01 < p < 0.05; **p < 0.01; stimulus #2, n = 6; stimulus #6, n = 7; stimulus #11, n = 7). F as in E, summary data of the retigabine effect on the fEPSP area (stimulus #2, n = 6; stimulus #6, n = 4; stimulus #11, n = 7).
- Figure 9.
Effects of XE991 on somatic EPSP summation. A, EPSPs (in response to 11 stimuli at 50 Hz) before (black trace) and after (green trace) bath applying XE991 (10–20 μm). In the presence of bath-applied XE991, the same stimulation evoked larger EPSPs, which triggered an action potential (truncated). B, EPSPs before (black) and after (green) bath applying XE991 while QX222 (2 mm) was included in the whole-cell patch pipette to block voltage-gated Na+ channels in the postsynaptic neuron. C, EPSPs before (black) and after (red) perisomatic application of XE991. Again, 2 mm QX222 was included in the patch pipette. D, Normalized time course of the effects of bath-applied (green bar and symbols; n = 4) and perisomatically applied (red bar and symbols; n = 5) XE991 on the integral of the EPSPs. XE991 caused a significant increase in the summed EPSP integral (p < 0.01 and p < 0.05 for global and focal application, respectively). The effects of the two application methods were not significantly different (p = 0.27). For all the four perisomatic applications and four of the five bath applications of XE991, recordings were obtained with 2 mm QX222 in the patch pipette. E, Summary diagram of the effect of XE991 on EPSP summation [EPSP summation index = (late EPSP integral)/(early EPSP integral); the early EPSP integral includes 150 ms after the first stimulus; the late EPSP integral includes 150 ms after the 10th stimulus]. Both bath and perisomatic application of XE991 caused a significant increase of the EPSP summation index (*0.01 < p < 0.05). F, Single EPSPs before (black) and after (green) bath applying XE991. G, Summary diagram of the effect of XE991 on the integral of a single EPSP. There was no significant enhancement by bath-applied XE991 (n = 7; NS, not significant). In all of the experiments illustrated in this figure, the background membrane potential was depolarized to approximately −58 mV by injecting steady-state current through the somatic recording pipette. Gabazine at 10 μm and 200 μm saclofen (or hydrosaclofen) were routinely applied to bath to block GABAA and GABAB receptors.
- Figure 10.
M-current effects on EPSP summation in a CA1 pyramidal neuron model. A, Left, A series of steady-state activation curves as reported by Wang et al. (1998) and Wickenden et al. (2000). “Wang native” (black line) refers to the kinetics of native IM recorded from sympathetic neurons. “Wang expressed” (black dots) refers to expressed KCNQ2 and KCNQ3 channels in oocytes. “Wickenden control” (blue line) refers to expressed KCNQ2 and KCNQ3 channels in CHO cells, and “Wickenden retigabine” (blue dots) refers to KCNQ2/3 in CHO cells with 10 μm retigabine in the extracellular medium. In B, E, and F, “Wang native” was used. A, Right, Voltage dependence of the time constants of activation and deactivation. B, Voltage-clamp simulations at the soma, by stepping the voltage from −70 to −20 mV in 10 mV steps. For each voltage step, the difference in current response before and after removing IM from the model is shown. C, In the diagram, red indicates the presence of IM in the soma, axon hillock, initial segment, and axon nodes. A synaptic conductance in the apical dendrite 300 μm from the soma was activated 11 times at 50 Hz. Somatic voltage responses for IM with different kinetics (compare with A) are shown. D, The same synapse as in C was activated once, and the effects of IM on the somatic EPSP are shown, for different IM kinetics (compare with A). E, Effects of different IM distributions on synaptic summation. The synaptic stimulation was the same as in C. (1), Red indicates a uniform density of IM in all compartments except the myelinated axon segments. (2), IM was removed from the “perisomatic” region, i.e., from the soma, axon hillock, initial segment, and the first 50 μm of the proximal dendrites. (3), Model with no IM. F, Left shows the time constant of activation and deactivation for three different simulation temperatures. Right shows the effects of varying the simulation temperature on the somatic voltage in response to a series of EPSPs, evoked as in C.


Tables
- Table 1.
Effects of retigabine and XE991 on the somatic and dendritic RMP and the input resistance (Rinput) at RMP
Somatic RMP Somatic RInput at RMP Control −73.8 ± 6.7mV 95.8 ± 32.5 MΩ Applying retigabine to the soma −74.3 ± 6.2 mV 98.8 ± 9.6 MΩ p value (n) 0.54 (n = 4) 0.94 (n = 4) Dendritic RMP Dendritic RInput at RMP Control −74.5 ± 2.1 mV 68.8 ± 12.7 MΩ Applying retigabine to the dendrite (239 ± 15 μm away from the soma) −74.6 ± 2.7 mV 61.3 ± 8.3 MΩ p value (n) 0.9 (n = 4) 0.3 (n = 4) Somatic RMP Somatic RInput at RMP Control −81.9 ± 0.8 mV 85.1 ± 14.3 MΩ Applying XE991 to the soma −82.2 ± 0.6 mV 81.0 ± 7.5 MΩ p value (n) 0.75 (n = 6) 0.85 (n = 4) Dendritic RMP Dendritic RInput at RMP Control −73.9 ± 3.3 mV 63.5 ± 7.0 MΩ Applying XE991 to the dendrite (196 ± 9 μm away from the soma) −74.4 ± 3.4 mV 65.4 ± 4.5 MΩ p value (n) 0.43 (n = 5) 0.78 (n = 5)
Supplemental Data
Files in this Data Supplement:
- supplemental material - Figure legends
- supplemental material - Figure 1
- supplemental material - Figure 2
- supplemental material - Figure 3
- supplemental material - Figure 4


