

Article Figures & Data
Figures
- Figure 1.
Expression profiles of bipolar cells in retinas of dko and wild-type mice. Immunolabeling of retinal sections from 6-week-old wild-type (A, C, E, G, I, K) and dko (B, D, F, H, J, L) mice with markers for OFF (A–F) or ON and OFF (G–L) bipolar cells. Boundaries of inner nuclear layer (INL) and the inner plexiform layer (IPL) are indicated. Arrowheads in C and D point to Neto1 labeling in the dendrites of type 2 OFF cone bipolar cells. G–J, Brackets highlight laminar depth of CaBP5 labeling in type 3 OFF cone bipolar cell axonal terminals, arrows show CaBP5 staining in type 5 ON cone bipolar cell terminals, and arrowheads point to CaBP5-positive rod bipolar cell terminals. K, L, Brackets indicate the part of the inner plexiform layer normally occupied by type 3 OFF cone bipolar cell axon terminals. Scale bar, 50 μm for all panels, except I and J (23 μm).
- Figure 2.
Temporal and spatial RGC receptive field maps of representative recordings from wild-type (A, B), Vsx1+/−Irx5+/− (C, D) and dko (E, F) mice. RGC light responses were recorded in mice aged P80–P100. A, C, E, Temporal structure of receptive field centers of RGCs recorded from a single patch of wild-type (A, 15 RGCs), Vsx1+/−Irx5+/− (C, 18 RGCs), or dko (E, 13 RGCs) retina are shown. Spike-triggered average waveforms in these plots were normalized to their amplitude and color coded to indicate fast ON (magenta), medium ON (green), biphasic OFF (blue), and monophasic OFF (red) RGCs. B, D, F, Spatial distribution of RGC receptive fields from the same recordings as in A, C, E, respectively, is depicted by plotting the 1-SD contours of two-dimensional Gaussian fits to receptive field profiles. Receptive field contours are color coded as indicated, and plots of the different cell types are offset for visual clarity. Dots represent a common point on the multielectrode array.
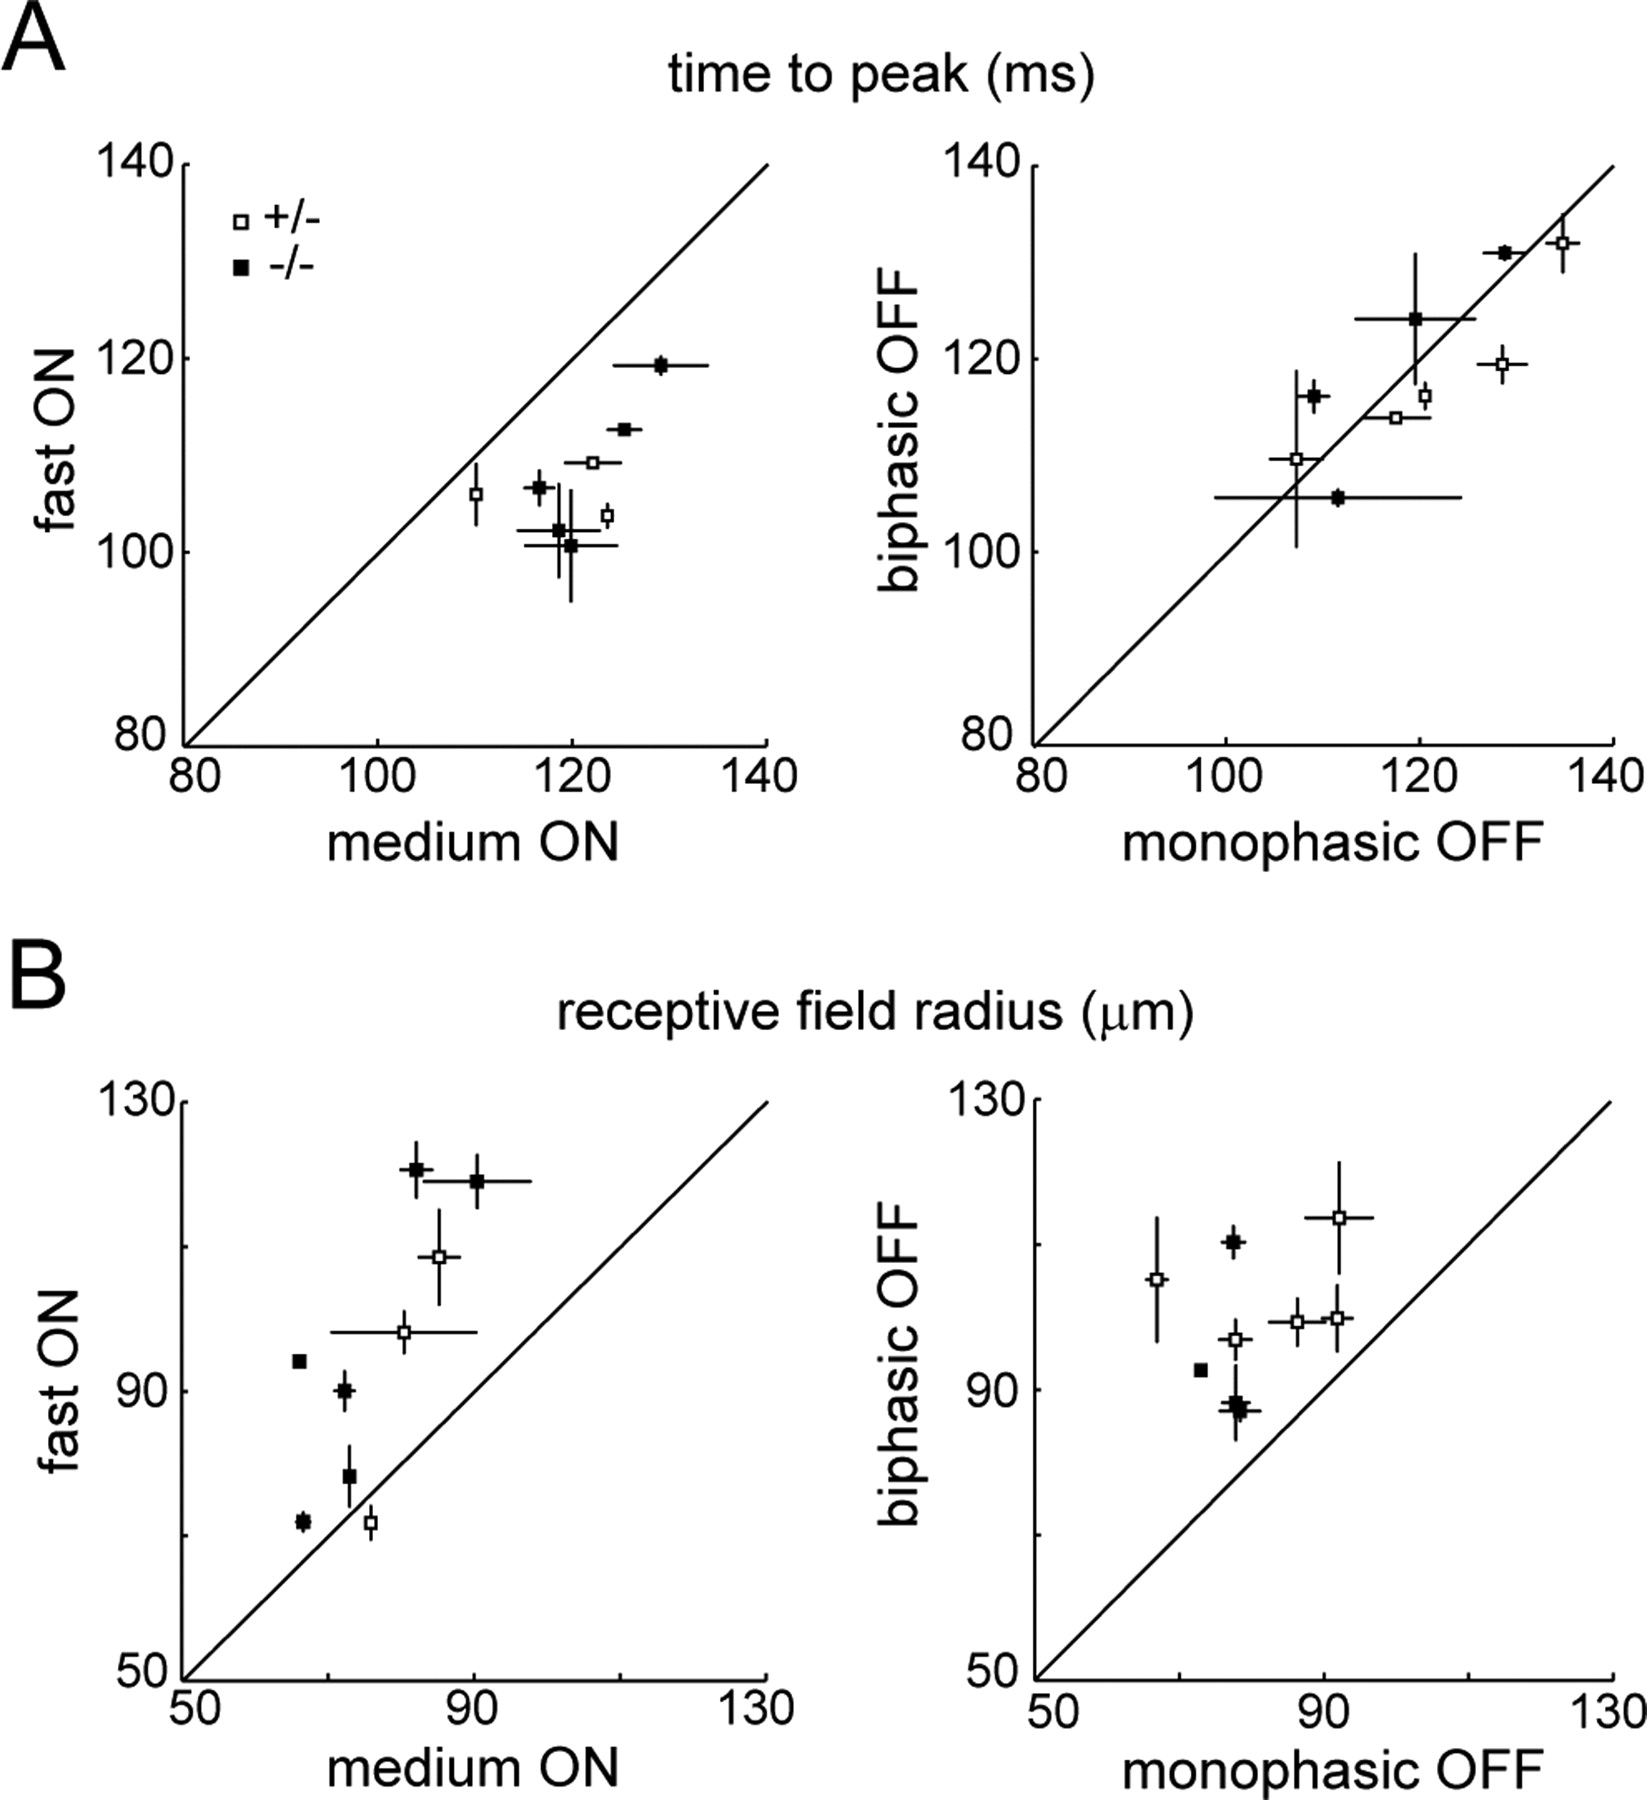
- Figure 3.
Comparison of space–time receptive field parameters of the different RGC types from control and dko mice. A, Plot of the time by which the peak modulation of the temporal receptive field precedes spiking of ON (left) and OFF (right) cells. x-Axis corresponds to peak time for medium ON RGCs (left) and monophasic OFF RGCs (right). Values on the y-axis indicate peak time for fast ON RGCs (left) and biphasic OFF RGCs (right). Each square (error bars) represents the mean ± SEM for all cells of the respective types recorded in one experiment. Only experiments in which at least three cells of the respective types were recorded were plotted in these graphs. Data from experiments on control mice (+/−, i.e., Vsx1+/−Irx5+/−) and dko mice (−/−, i.e., Vsx1−/−Irx5−/−) are marked by open and filled symbols, respectively. B, Plot of receptive field radii for the different cell types and genotypes. Axis orientation and symbols as in A. Likewise, as in A, each square (error bars) represents the mean ± SEM from one experiment.
- Figure 4.
Comparison of static nonlinearities for RGCs of the different cell and genotypes. Left panels show firing rate as a function of the generator signal for representative fast ON (A), medium ON (B), biphasic OFF (C), and monophasic OFF (D) RGCs recorded from control (+/−, open circles) or dko (−/−, filled circles) mice. Bars (error bars) on the right indicate mean ± SEM of the response threshold, gain, and range for all cells of the respective types recorded from control (open bars) or dko (filled bars) mice. Numbers in brackets signify number of cells analyzed. *p < 0.05 using Wilcoxon–Mann–Whitney rank sum tests.
- Figure 5.
Contrast adaptation in the LN model for representative ON and OFF RGCs of control and dko mice. Temporal contrast of a randomly flickering full-field stimulus was altered every 30 s (A), and responses were reconstructed from the second half of each contrast segment to allow adaptation to approach steady state. B–E, Linear filter and static nonlinearity of representative fast ON (B, D) and biphasic OFF (C, E) cells from control (B, C) or dko (D, E) mice during high (bold line, filled circles) and low contrast (thin line, open circles) segments of the stimulus. For plots of the static nonlinearity, full input/output relationships are shown as insets with enlargements of the foot of the respective curves as the main panel. In these plots, the expected low contrast input/output relationship of each cell is shown as a line. It is derived by using the average gain increase of all control cells of the respective type under low contrast stimulation together with the actual threshold and range of the cell. This shows that, for fast ON cells in control and dko and for biphasic OFF cells in control mice, gain adaptation fits the expectation, whereas the shallower rise of the data points (open circles in E) compared with the expectation (solid line) indicates reduced gain adaptation of biphasic OFF cells in dko mice.
- Figure 6.
Changes in response kinetics during contrast adaptation. A, B, Time-to-peak and peak-to-trough interval for all recorded and classified ON (left) and OFF (right) RGCs (n = 100). A, Values during high contrast stimulation are plotted along the x-axis, and values during low contrast stimulation are along the y-axis. Throughout, open symbols signify cell recorded from control mice, and filled symbols mark results from dko mice. Circles indicate fast ON RGCs (left) and biphasic OFF cells (right). Triangles indicate medium ON RGCs (left) and monophasic OFF RGCs (right). B, For cells with biphasic filter functions (fast and medium ON RGCs and biphasic OFF RGCs) the time from peak-to-trough was measured under high (x-axis) and low contrast (y-axis) conditions. For monophasic OFF RGCs, this measure was substituted by determining the rise time from 5% to the peak of the STA. Symbols for the different cell types and genotypes are the same as in A.
- Figure 7.
Contrast adaptation in response gain of RGCs. A, Gain of ON (left) and OFF (right) cells during the high contrast (x-axis) or low contrast (y-axis) stimulation. Gain is normalized by the median gain for all recorded and classified cells during high contrast stimulation. Open and filled symbols represent data from control and dko mice, respectively. Circles are used to mark values from fast ON RGCs (left) and biphasic OFF RGCs (right), and triangles are used to indicate data from medium ON (left) and monophasic OFF (right) RGCs. E, F, Adaptation index for the different cell types as indicated. Open and filled bars represent data from control (+/−) and dko (−/−) mice, respectively. *p < 0.05 using Wilcoxon–Mann–Whitney rank sum tests.


Additional Files
Supplemental Data
Files in this Data Supplement:
- supplemental material - Supplemental Legend
- supplemental material - Supplemental Table
- supplemental material - Supplemental Figure 1
- supplemental material - Supplemental Figure 2


