

Abstract
Within the developing Xenopus spinal cord, voltage-gated potassium (Kv) channel genes display different expression patterns, many of which occur in opposing dorsal–ventral gradients. Regional differences in Kv gene expression would predict different patterns of potassium current (IKv) regulation. However, during the first 24 h of postmitotic differentiation, all primary spinal neurons undergo a temporally coordinated upregulation of IKv density that shortens the duration of the action potential. Here, we tested whether spinal neurons demonstrate regional differences in IKv regulation subsequent to action potential maturation. We show that two types of neurons, I and II, can be identified in culture on the basis of biophysical and pharmacological properties of IKv and different firing patterns. Chronic increases in extracellular potassium, a signature of high neuronal activity, do not alter excitability properties of either neuron type. However, elevating extracellular potassium acutely after the period of action potential maturation leads to different changes in membrane properties of the two types of neurons. IKv of type I neurons gains sensitivity to the blocker XE991, whereas type II neurons increase IKv density and fire fewer action potentials. Moreover, by recording from neurons in vivo, we found that primary spinal neurons can be identified as either type I or type II. Type I neurons predominate in dorsal regions, whereas type II neurons localize to ventral regions. The findings reveal a dorsal–ventral gradient for IKv regulation and a novel form of neuronal plasticity in spinal cord neurons.
Introduction
Xenopus primary spinal neurons form a heterogeneous population that comprises sensory Rohon-Beard (RB) cells, motorneurons, and interneurons (Spitzer and Lamborghini, 1976). Despite this heterogeneity, during the first 24 postmitotic hours, primary spinal neurons behave homogeneously with respect to differentiation of excitability both in vitro and in vivo (Spitzer and Lamborghini, 1976; Baccaglini and Spitzer, 1977; Desarmenien et al., 1993; Ribera, 1996). The shared developmental program for excitability involves delaying upregulation of IKv density with respect to inward currents, thereby allowing neurons to fire long duration impulses initially and then later brief duration spikes (Barish, 1986; O'Dowd et al., 1988).
Previous results have shown that the molecular determinants of IKv differ between spinal neuron subtypes (Gurantz et al., 1996; Ribera, 1996). For example, Kv1.1 and Kv2.2 mRNAs localize to dorsal and ventral regions, respectively, of the embryonic spinal cord (Ribera and Nguyen, 1993; Burger and Ribera, 1996). Why spinal neurons would express different Kv genes and yet upregulate IKv in a temporally coordinated manner is not understood. However, the molecular heterogeneity may set the stage for mature neurons to selectively fine tune membrane properties in response to changes in inputs or activity either during subsequent development or adult plasticity. Thus, regulation of excitability might differ among mature, but not immature, neuronal subtypes.
To test this possibility, we compare the response of Xenopus embryonic immature versus mature spinal neurons to environmental challenges. Studies of developmental regulation of neuronal excitability depend on the ability to record from live neurons at early stages of differentiation. Xenopus spinal neurons in culture develop similarly to ones studied in situ (Baccaglini and Spitzer, 1977; Desarmenien et al., 1993). Additionally, the in vitro model allows the study of all spinal neuron subtypes developing under defined conditions that can be easily manipulated. Moreover, it is possible to record from spinal neurons in situ and compare results obtained in vitro to those in vivo.
Here we report that properties of IKv identify two different neuron types, I and II, in culture as well as in intact preparations of the embryonic Xenopus spinal cord. In vivo, type I comprises RB cells and a small fraction of interneurons, whereas type II neurons correspond to a majority of interneurons and ventral neurons. We challenged neurons in culture with higher concentrations of extracellular potassium, a condition that follows periods of high activity. We found that increasing extracellular potassium levels after, but not before, the time of action potential maturation led to changes in IKv properties of both type I and II neurons. Moreover, type II, but not type I, neurons also displayed changes in firing properties. These findings reveal that Xenopus spinal neurons modulate IKv differently in response to environmental challenges depending on whether they are (1) immature or mature and (2) type I or II. Moreover, because type I and II neurons occupy different positions in the spinal cord, the results reveal a dorsal–ventral gradient for regulation of IKv and early neuronal plasticity.
Materials and Methods
Preparation of Xenopus spinal neurons in culture.
Xenopus embryos were produced by standard in vitro fertilization techniques (Moon and Christian, 1989) and staged according to Nieuwkoop and Faber (1967). Dissociated cultures of neural plate [stage 15 (St 15)] Xenopus embryos were prepared as described previously (Spitzer and Lamborghini, 1976; Blair, 1983; Ribera and Spitzer, 1989; Jones and Ribera, 1994). Control culture media consisted of the following (in mm): 116 NaCl, 0.67 KCl, 1.3 MgSO4, 9.4 CaCl2, 0.6 Ca(NO3)2, and 4.6 Tris, pH 7.8. The elevated potassium culture solution was the same except for elevation of the potassium ion concentration to 3 mm. In preliminary experiments, we also used 10 mm potassium, but this condition resulted in substantial neuronal death and was thus not informative. The standard condition for Xenopus spinal neurons in culture involves use of a relatively low physiological level of potassium, 0.67 mm (Spitzer and Lamborghini, 1976). The classic work of Harrison (1903) and Jones and Elsdale (1963) had established this concentration as one that supported growth of amphibian neurons in culture.
Preparation of semi-intact Xenopus embryo spinal cord.
Semi-intact preparations of the spinal cord of Xenopus embryos were prepared using slight modifications of previous methods used on zebrafish embryos (Ribera and Nüsslein-Volhard, 1998; Pineda et al., 2005). Briefly, in the presence of 0.02% tricaine (ethyl 3-aminobenzoate methanesulfonate salt; Sigma-Aldrich, St. Louis, MO), the yolky endoderm of 48-h-old embryos (St 35/36) was removed, and embryos were mounted onto glass coverslips using Vetbond Tissue Adhesive (3M Animal Care Products, St. Paul, MN), ventral side either down or up, for RB or ventral neuron recordings, respectively. Embryos were then killed by transection at the level of the hindbrain. The spinal cord was exposed by removing the skin and dorsal fin folds. For the ventral recordings, the notochord was also removed. Tricaine was then removed by washing the preparation with ≥40 ml of recording solution over the course of 15 min. Preparations were viewed with differential interference contrast optics on an Axioskop FS2 microscope (Zeiss MicroImaging, Hamburg, Germany) at a magnification of 640×. Neurons in three different spinal cord regions were studied: dorsal, intermediate, and ventral. Dorsally, RB cells were identified by their superficial location and large soma diameter [∼20 μm (Spitzer and Baccaglini, 1976)]. Neurons in intermediate (INs) and ventral (VNs) regions with large somata were selected to avoid recording from later-born secondary spinal neurons.
Electrophysiological methods.
Whole-cell currents were recorded from neurons in culture for either 24 or 48 h. Standard patch-clamp techniques (Hamill et al., 1981) were applied using an Axopatch 200B patch-clamp amplifier (Molecular Devices, Sunnyvale, CA) in conjunction with a Digidata 1322A or 1440A analog-to-digital interface (Molecular Devices). pCLAMP8 or 10 software packages (Molecular Devices) were used for data acquisition and analysis. Unpolished electrodes were pulled from borosilicate glass (Microcaps; Drummond Scientific, Broomall, PA) using a P-97 Flaming-Brown micropipette puller (Sutter Instruments, Novato, CA) and then filled with solution containing the following (in mm): 100 KCl, 10 EGTA, and 10 HEPES, pH 7.4. Tip resistances ranged between 2.5 and 3.5 MΩ. Cell capacitance and series resistance were routinely compensated by 70–80% with a lag of 10 μs using the electronic features of the amplifier. Currents were filtered at 5 kHz and digitized at 25 kHz. Passive leak and capacitative transients were subtracted on-line using a P/4 algorithm with eight substeps (Bezanilla and Armstrong, 1977). All experiments were performed at room temperature (20–22°C).
Potassium currents.
Voltage-gated potassium currents were evoked from a holding potential of −80 mV by 60 ms depolarizing voltage steps to test potentials ranging between −60 and +120 mV in 10 mV increments. After stepping to the test potential, the membrane was first returned to −40 mV for 10 ms to elicit tail currents and then back to the −80 mV holding potential. The bath solution contained the following (in mm): 80 NaCl, 3 KCl, 5 MgCl2, 10 CoCl2, 5 HEPES, and 3 μm TTX, pH 7.4. Only data from neurons that maintained a constant access resistance during the recording period were analyzed.
Capacitative transients that decayed monoexponentially indicated good spatial control of the membrane voltage. We assessed further the adequacy of the voltage clamp by determining the reversal potential of tail currents after activation to different membrane potentials. In all cases examined, the reversal potential was the same regardless of the magnitude of the activating step. We also examined tail currents evoked at +60 mV, after steps to +30, +60, or +90 mV. The tail current after a step to +90 mV was outward and of larger amplitude than that after a step to +60 mV, indicating greater activation of the conductance at +90 versus +60 mV.
Action potentials.
Action potentials and resting potentials were recorded with whole-cell electrodes by switching to fast current-clamp mode. The pipette solution was the same as that used for recording of potassium currents. Cells were bathed in a standard saline solution (in mm): 115 NaCl, 3 KCl, 10 CaCl2, and 5 HEPES, pH 7.4. A steady level of current was injected to hold the membrane potential near −80 mV. Action potentials were initiated by a 1 Hz series of seven 2 or 150 ms current injections ranging between 0.1 and 1.3 nA in 0.2–0.3 nA increments.
Drug application.
3,3-Bis(4-pyridinylmethyl)-1-phenylindolin-2-one (linopirdine; 100 μm; DuP 996; Sigma-Aldrich), 10,10-bis(4-pyridinylmethyl)-9(10H)-anthracenone (XE991; 10–25 μm; Tocris Bioscience, Ellisville, MO], 6-cyano-7-nitroquinoxaline-2,3-dione disodium salt (CNQX; 10 μm; Sigma-Aldrich), dl-2-amino-5-phosphonopentanoic acid (AP5; 25 μm; Sigma-Aldrich) and picrotoxin (PTX; 50 μm; Sigma-Aldrich) were dissolved in the external bath solution and applied through a borosilicate pipette (10 μm tip) placed within 100–200 μm of the cell. Drug application was either gravity or pressure driven, the latter via a Picospritzer III (Parker Hannifin, Fairfield, NJ) using 10 psi.
Data analysis.
Data analysis was accomplished using Clampfit 8/10 (Molecular Devices), AxoGraph (Axograph Scientific, Sidney, Australia), Excel (Microsoft, Redmond, WA) and Origin (OriginLab, Northampton, MA) software. Steady-state current amplitudes were measured as the average value within a 10 ms interval 45 ms after the depolarizing test voltage step began. Normalization of current amplitude to cell size was achieved by dividing the steady-state current by the membrane capacitance, which serves as an indicator of membrane surface area (1 pF/cm2) (Marty and Neher, 1983). For I–V plots, we present current density (in picoamperes per square micrometer) as a function of voltage.
We determined conductance density by dividing current densities by driving force. In addition, we made conductance–voltage (G–V) plots by measuring the tail currents elicited at −40 mV after activation at depolarized test voltages. Tail current amplitudes were measured 1 ms after termination of the depolarizing step. The Boltzmann equation (G = Gmax/{1 + exp[(V1/2 − V)/k]}), where Gmax is the maximal conductance, V1/2 is the voltage at which activation is half-maximal, and k is the slope factor, was fit to the data.
Results are presented as means ± SD within the text and tables. In the graphs, however, data are presented as means ± SEM. Statistical comparisons were done using InStat 3 software (GraphPad Software, San Diego, CA). Unpaired t tests were used for comparisons of two independent sample means (see Figs. 3B, 5E). For the comparison of more than two means, one-way ANOVA was first used to determine whether differences between means were significant (see Figs. 6E, 7E, 8E, 10C). If so, post hoc tests were done. The Bonferroni correction for multiple comparisons was used, and corrected p values are reported. p values ≤0.05 were interpreted as indicative of statistical significance.
Results
Neural plate Xenopus cultures display two different types of IKv
At St 15, Xenopus embryos have formed a neural plate but not yet undergone neural tube closure. Nonetheless, the three different types of primary neurons (dorsal RB cells, interneurons, and ventral motor neurons) have exited the cell cycle and continue postmitotic differentiation in culture (Spitzer and Lamborghini, 1976; Harris and Hartenstein, 1991; Chitnis et al., 1995). As they differentiate, the primary spinal neurons display a wide range of morphologies, as expected for a heterogeneous population. However, the different morphologies have not served as reliable indicators of neuron type in previous studies (Spitzer and Lamborghini, 1976; Bixby and Spitzer, 1984).
Molecular characterization of neurons in situ has also revealed heterogeneity in potassium channel gene expression in spinal neurons (Ribera and Nguyen, 1993; Burger and Ribera, 1996; Gurantz et al., 1996). Accordingly, we tested whether IKv properties could allow distinction of different neuron types in culture at 24 h (Fig. 1). We found that all spinal neurons had one of two obviously different types of IKv. The I–V relationship for currents recorded from type I neurons exhibited a conventional delayed rectifier-like behavior with current amplitudes becoming progressively larger with increasing depolarization (Fig. 1A,C). In contrast, the I–V relationship obtained for currents recorded from type II neurons indicated that at voltages positive to +60 mV, current amplitudes decreased with increasing depolarization (Fig. 1B,C).

I–V properties reveal two different types of Xenopus spinal neurons in culture. A, Voltage-gated potassium currents recorded from type I neurons increase in amplitude with increasing depolarization. B, In contrast, for type II neurons, current amplitudes decrease in amplitude for depolarizations to membrane potentials positive to +60 mV. For A and B, currents elicited for steps to +60, 90, and 120 mV are designated. C, IKv current–voltage relationships for type I (circles; n = 23) and type II (squares; n = 74) neurons.
All spinal neurons in culture were either type I or type II. Both neuronal types displayed a wide range of morphologies, preventing distinction on this basis. Type I and II neurons did not differ statistically with respect to intrinsic membrane properties such as cell capacitance, input resistance, and resting membrane potential (Table 1). However, type II neurons outnumbered type I by a factor of ∼3.
Membrane properties of type I and type II neurons in vitro
Characterization of IKv recorded from type II neurons
To obtain insights into possible differences between type I and type II neurons, we studied further the basis for the nonconventional I–V relationship for IKv recorded from type II neurons. I–V relationships, similar to those of type II IKv, can result from intracellular Mg2+ inducing a voltage-dependent inward rectification at potentials more positive than +50 mV (Lopatin and Nichols, 1994; Harris and Isacoff, 1996; Tammaro et al., 2005a,b). High extracellular potassium concentration antagonizes the voltage-dependent Mg2+ blockade, allowing a test for Mg2+-induced inward rectification (Lopatin and Nichols, 1994; Harris and Isacoff, 1996). However, we found that elevated levels of extracellular potassium did not affect the I–V relationship for type II current (Fig. 2A) (n = 13), even though current amplitudes were diminished as expected by the reduction in driving force. These data are not consistent with Mg2+ blockade as the basis for the I–V relationship of IKv recorded from type II neurons.

Neither Mg2+ block nor sodium-dependent potassium current accounts for IKv of type II neurons. A, Increases in elevated extracellular potassium ion concentration do not change the shape of the I–V relationship of IKv recorded from type II neurons. n values ranged between 9 and 13 for each condition. B, Substitution of permeant sodium ion with impermeant NMG (gray trace) does not reduce the amplitude of IKv recorded from type II neurons (n = 10). Black traces (control) present currents recorded in standard bath solution before sodium substitution with NMG. The exemplars show currents elicited by step depolarizations from a holding potential of −80 mV to +20 (left), +60, (middle) or +100 mV (right).
Sodium-activated potassium current (IKNa), recorded from spinal neurons acutely isolated from stage 37/38 Xenopus embryos, also displays a type II-like I–V relationship (Dale, 1993). If IKv of type II neurons were sodium dependent, we would expect current amplitudes to continue to increase at voltages positive to +60 mV if permeant sodium ions were replaced by impermeant N-methyl-d-glucamine (NMG). However, substitution of external sodium by NMG did not reduce IKv amplitudes (Fig. 2B) (n = 10), suggesting that IKNa does not contribute to IKv in type II neurons. It is possible that, at the early stages that we studied, Xenopus spinal neurons have not yet acquired the IKNa detected at the later stages studied by Dale (1993).
Potassium currents carried by KCNQ channels can produce I–V relationships similar to those that we obtained for IKv of type II neurons. To test this possibility, we used the KCNQ channel blockers linopirdine and XE991 (Robbins, 2001; Gribkoff, 2003; Cooper and Jan, 2007). At a concentration of 25 μm, the sensitivity of type I IKv to XE991 was significantly less than that of type II (Fig. 3A). Although XE991 sensitivity distinguished between the IKv values of type I and type II neurons, linopirdine sensitivity did not differ between type I and type II neurons (Fig. 3B). These data indicate that type I and II neurons possess channels that are differentially sensitive to some (e.g., XE991), but not all (e.g., linopirdine), KCNQ channel blockers.

Sensitivity of IKv to XE991 distinguishes between type I and type II neurons IKv. A, The IKv sensitivities to XE991 of type I (left) versus type II (right) neurons differ; the XE991 (25 μm; XE)-sensitive current (dark gray) was obtained by subtracting the XE-insensitive current (light gray) from current recorded before drug application (control; black). B, Comparison of IKv sensitivity in type I (white bars) and type II (black bars) neurons to 100 μm linopirdine (Lino) and 10 and 25 μm XE. n values ranged between 6 and 12 for each condition. The asterisk indicates significance at p < 0.01 for type I versus type II (25 μm XE991).
To characterize IKv of type I and II neurons further, we compared the conductance–voltage relationship determined from tail currents to that calculated by dividing by driving force. For type II IKv, the two methods produced different conductance–voltage relationships. Specifically, at voltages positive to +60 mV, tail currents did not decrease in amplitude as a function of voltage (Fig. 4A), in contrast to conductance values determined by division of driving force (Fig. 4B). The discrepancy suggests that type II IKv undergoes voltage-dependent rectification or block at membrane potentials positive to +60 mV.

Conductance–voltage relationships for IKv of type I and type II neurons differ. G–V relationships for IKv of type I (open circles; n = 23) and type II (open squares; n = 74) neurons were determined either from tail currents (A) or by dividing current amplitudes by driving force (B).
Together, the data indicate that two properties of IKv, I–V relationship and sensitivity to XE991, serve as markers that can be used on live cells to identify type I and type II neurons.
Type I and II neurons display different firing properties
We next tested whether the type I and type II neurons have different firing properties at 24 h in culture. We assayed responses of neurons to both brief (2.5 ms) (Fig. 5A,B) and long-duration (150 ms) (Fig. 5C–E) current injections. In response to brief current injection, 60 and 92% of type I and II neurons fired an action potential, respectively (n = 10 and 12). Furthermore, postsynaptic potentials (determined by their complete blockage with 10 μm CNQX, 25 μm AP5, and 50 μm PTX; data not shown) were often seen when recording from type II neurons (Fig. 5B, arrow) but never from type I neurons.

Firing properties of type I and type II neurons differ at 24 h under control conditions. A, B, Type I (A) and type II (B) neurons fired differently in response to brief (2.5 ms) current injection. Additionally, only type II neurons generated depolarizations after an action potential (B, arrow); the depolarizations were blocked by the bath application of APV, CNQX, and PTX, indicating that they were caused by synaptic interactions. C, D, Type I (C) and type II (D) neurons also responded differently to sustained (150 ms) current injection. E, The frequency of action potential firing as a function of current intensity indicates that type II neurons fired more on average that did type I neurons. Unpaired t tests indicated, however, that the difference was not significant (p < 0.12). n values ranged between 11 and 12. Symbols are identified in C and D.
In response to sustained current injection, the maximum number of action potentials evoked was consistently approximately twofold larger for type II neurons than type I, although the difference was not statistically significant (Fig. 5E). Overall, the data indicate that type II neurons were more excitable than type I, despite similar inward current properties (e.g., see Fig. 8).
At 24 and 48 h, chronic elevation of extracellular potassium concentration in culture does not affect type I or II IKv
In the presence of the standard extracellular potassium concentration (0.67 mm), the resting membrane potential was −58.5 ± 11.2 mV (n = 15). Elevating the external potassium concentration to 3 or 10 mm depolarized the resting membrane potential, in a Nernstian manner, by ∼13 and 22 mV [−45.7 ± 10.0 and −36.7 ± 5.8, respectively; n = 15 and 15]. However, after prolonged exposure to 10 mm potassium, neuronal viability was compromised. Thus, we present results obtained for the 3 mm potassium condition only.
Neurons were tested for effects of high extracellular potassium at either 24 h (when synapse formation initiates) or 48 h (when neurons have been synaptically active for ∼24 h). The culture media contained either standard (0.67 mm) or high (3 mm) external potassium. Between 24 and 48 h, control current density values did not change for either type I or type II neurons, as expected given the previously described set point for IKv density (Blaine et al., 2004).
Consistent with previous findings of Desarmenien and Spitzer (1991), chronic high potassium had no effect on IKv density of either type I or type II neurons at 24 or 48 h (Fig. 6A,B). Overall, the results suggest that when type I and II neurons differentiate in a constant ionic environment, they maintain their normal developmental program and set point for IKv, even if the potassium concentration is not standard.

Acute exposure to elevated K+ selectively alters IKv density of type II neurons. A, B, Comparison of IKv densities of type I (A) and type II (B) neurons and their respective control recordings at 24 and 48 h grown chronically in either control or high-K+ media. No significant difference was found. Symbols are indicated in the figure. n values ranged between 5 and 18. C, Current densities of IKv of type I neurons grown in either acute I (n = 8) or acute II (n = 3) conditions. D, Current densities of IKv of type II neurons grown in either acute I (n = 30) or acute II (n = 18) conditions differ. The acute I, but not other culture conditions, produced a significant increase in current density (p < 0.01, 24 h control vs acute I) for type II but not type I neurons (p ≤ 0.03). E, The acute I, but not other culture conditions, produced a significant increase in Gmax. n values ranged between 3 and 74. For comparisons of Gmax between type I cells, one-way ANOVA determined a p value of 0.6167, and no post hoc tests were performed. In contrast, for comparisons between type II cells, one-way ANOVA determined a p value of 0.0015. Bonferroni-corrected p values (see Materials and Methods) for specific pairwise comparisons <0.05 are indicated by asterisks: *p < 0.05, 48 h control versus acute I type II.
Effects of acute I culture conditions on IKv properties
Next, we used culture protocols that would change the ionic environment after the period of action potential maturation (24 h). In the acute I condition, neurons were initially grown in control medium and then switched to high-K+ medium. Conversely, in the acute II condition, cells were grown for the first 24 h period in medium with high K+, after which it was switched to control medium. For both, the acute I and acute II conditions, neurons were recorded at 48 h only.
In type I and type II neurons grown under the acute II condition, the current density did not differ from 48 h control cells. In contrast, the acute I condition did lead to significant changes in potassium current density of type II neurons (Fig. 6C,D). Interestingly, IKv density of type I neurons was not altered, suggesting that the effects of elevated potassium after 24 h depended on the neuron type.
Consistent with the above data, the only condition that led to a significant change in maximum conductance density was acute I in type II neurons (Fig. 6E). Conductance density of type I IKv was not altered. These findings suggest that the increased current density produced by the acute I condition resulted from an increase in the number of functional surface membrane channels.
Effects of acute I condition on excitability of type I and type II neurons
At 48 h, neurons grown under control conditions had firing properties similar to those at 24 h (Fig. 5). Sustained current injection elicited significantly more action potentials in type II than in type I neurons (Fig. 7E). Thus, for both 24 and 48 h control conditions, type II neurons showed greater excitability than did type I neurons.

Firing properties of type I and II cells at 48 h grown under control and the acute I condition. A, B, Under control conditions, sustained current injection in type I (A) and type II (B) neurons elicited firing properties that were similar to those at 24 h (compare Fig. 5). C, D, The acute I condition led to changes in firing properties of both type I (C) and type II (D) neurons. In contrast to control, acute I type I neurons fired repetitively (C). Furthermore, type II neurons in the acute I condition occasionally fired single action potentials in response to sustained current injection (D). E, The frequency of action potential firing for different sustained levels of current injection (0.1–1.3 nA) differed significantly between type I and type II neurons grown under control conditions (*p < 0.0001). Symbols are identified in A–D. The acute I condition, however, reduced excitability of type II neurons, so that it no longer was statistically different from that of type I neurons grown under the same (acute I) condition. Furthermore, control and acute I type II neurons displayed significantly different firing rates (**p < 0.05). n values ranged between 7 and 10. One-way ANOVA analysis followed by post hoc Bonferroni multiple-comparison tests were used to evaluate statistical significance. For a current stimulus intensity of 0.7 nA, a p value of 0.0001 was determined; for other stimuli intensities (0.1–1.3 nA), p ranged between 0.0001 and 0.151. Post hoc tests were then used to determine p values for specific comparisons. In addition to the values mentioned for a stimulus intensity of 0.7 nA, control type I and II neurons displayed significantly different firing rates for all stimuli intensities (0.1–1.3 nA; p ranged between 0.001 and 0.05). Control type II neurons also fired at significantly different rates than did acute I type II neurons at a stimulus intensity of 0.3 nA.
In contrast, when grown under the acute I condition, type II neurons showed a reduction in excitability (Fig. 7D,E). No changes were observed in type I neurons versus control (Fig. 7C,E). The decrease in excitability of type II neurons would be expected on the basis of the increased potassium current conductance produced by the acute I condition (Fig. 6).
It is possible that acute I condition had effects on other conductances, such as sodium or calcium. However, neither peak inward current density nor rate of rise differed significantly between type I and type II neurons for either control or the acute I condition (Fig. 8A,B). Additionally, we tested whether other properties of potassium currents were affected by the acute I condition. Under standard potassium concentration, sensitivity to XE991 distinguished the type II IKv from that of type I neurons. However, when grown under the acute I condition, IKv of type I neurons showed an increase in sensitivity to XE991 (Fig. 8C,D). In contrast, the IKv sensitivity to XE991 in type II neurons was not altered. Thus, when grown under the acute I condition, the sensitivity of type I and II neurons to XE991 was similar. Although XE991 sensitivity no longer differed between type I and type II neurons, the I–V relationship of IKv still distinguished two classes of neurons. As under control 24 or 48 h conditions, all neurons tested were either type I or type II.

The acute I condition affects other current properties. A, B, The acute I condition did not have significant effects on inward current properties, as assessed by measuring either the peak inward current density (A) or the maximum rate of rise of the action potential (B). C, The acute I condition altered the pharmacological sensitivity of IKv of type I neurons. Unlike control 24 or 48 h type I neurons (compare Fig. 4), IKv of type I neurons grown under the acute I condition was sensitive to 25 μm XE991. D, The sensitivities of IKv type I and II neurons to 25 μm XE991 were similar for the acute I but not control conditions. One-way ANOVA determined a p value of <0.0003. Bonferroni-corrected p values (see Materials and Methods) for specific pairwise comparisons <0.05 are indicated: *p < 0.001, 48 h control type I versus 48 h control type II; **p < 0.05, 48 h control type I versus acute I type I.
In sum, the results indicate that the acute I condition had several effects on membrane properties of type I and II neurons. The decreased excitability of type II neurons is consistent with the increased potassium conductance produced by the acute I condition. The basis for the altered XE991 sensitivity of type I neurons is less obvious, but may in part be attributable to expression of molecularly different potassium channels.
Spinal neurons in situ display either type I or type II IKv properties
Next, we tested whether type I and II neurons were also present in situ and whether they corresponded to different neuron subtypes. We conducted in situ studies on 48 h embryos and targeted neurons with larger somata to limit recordings to primary neurons, the population that differentiates in culture.
We recorded from neurons in three different dorsal–ventral positions of the spinal cord. Dorsally, we focused on RB cells, a population of primary sensory neurons that are easily identified in situ (Spitzer and Baccaglini, 1976). Next, we chose intermediately positioned neurons with large cell bodies, INs. The third group consisted of ventrally positioned neurons, VNs, with large somata characteristic of primary motor neurons.
Consistent with previous work, RB cells tended to have the most negative resting membrane potentials, compared with INs and VNs (Table 2) (Spitzer, 1976). Also consistent with previous work, INs had varied membrane properties, as reflected by the larger errors associated with the mean values (Table 2) (Desarmenien et al., 1993). VNs displayed the largest conductance maxima (Table 2).
Membrane properties of RB cells, INs, and VNs in vivo
Potassium currents recorded from RB cells in situ had I–V relationships similar to those recorded from type I neurons in culture (Fig. 9A,B) (n = 6). In contrast, VNs displayed currents similar to those of type II neurons (Fig. 9A,D) (n = 5). Interestingly, the I–V curves obtained for potassium currents recorded from INs were intermediate to those of RB cells and VNs, suggestive of a mixed population (Fig. 9A,C) (n = 7). Indeed, examination of the I–V relationships for individual cells revealed that ∼30% (2/7) were type I, whereas the remainder were type II. These results suggest that, in culture, type I cells are similar to RB cells and a minority of INs, whereas type II cells in vitro correspond to a mixed population of interneurons and motor neurons.
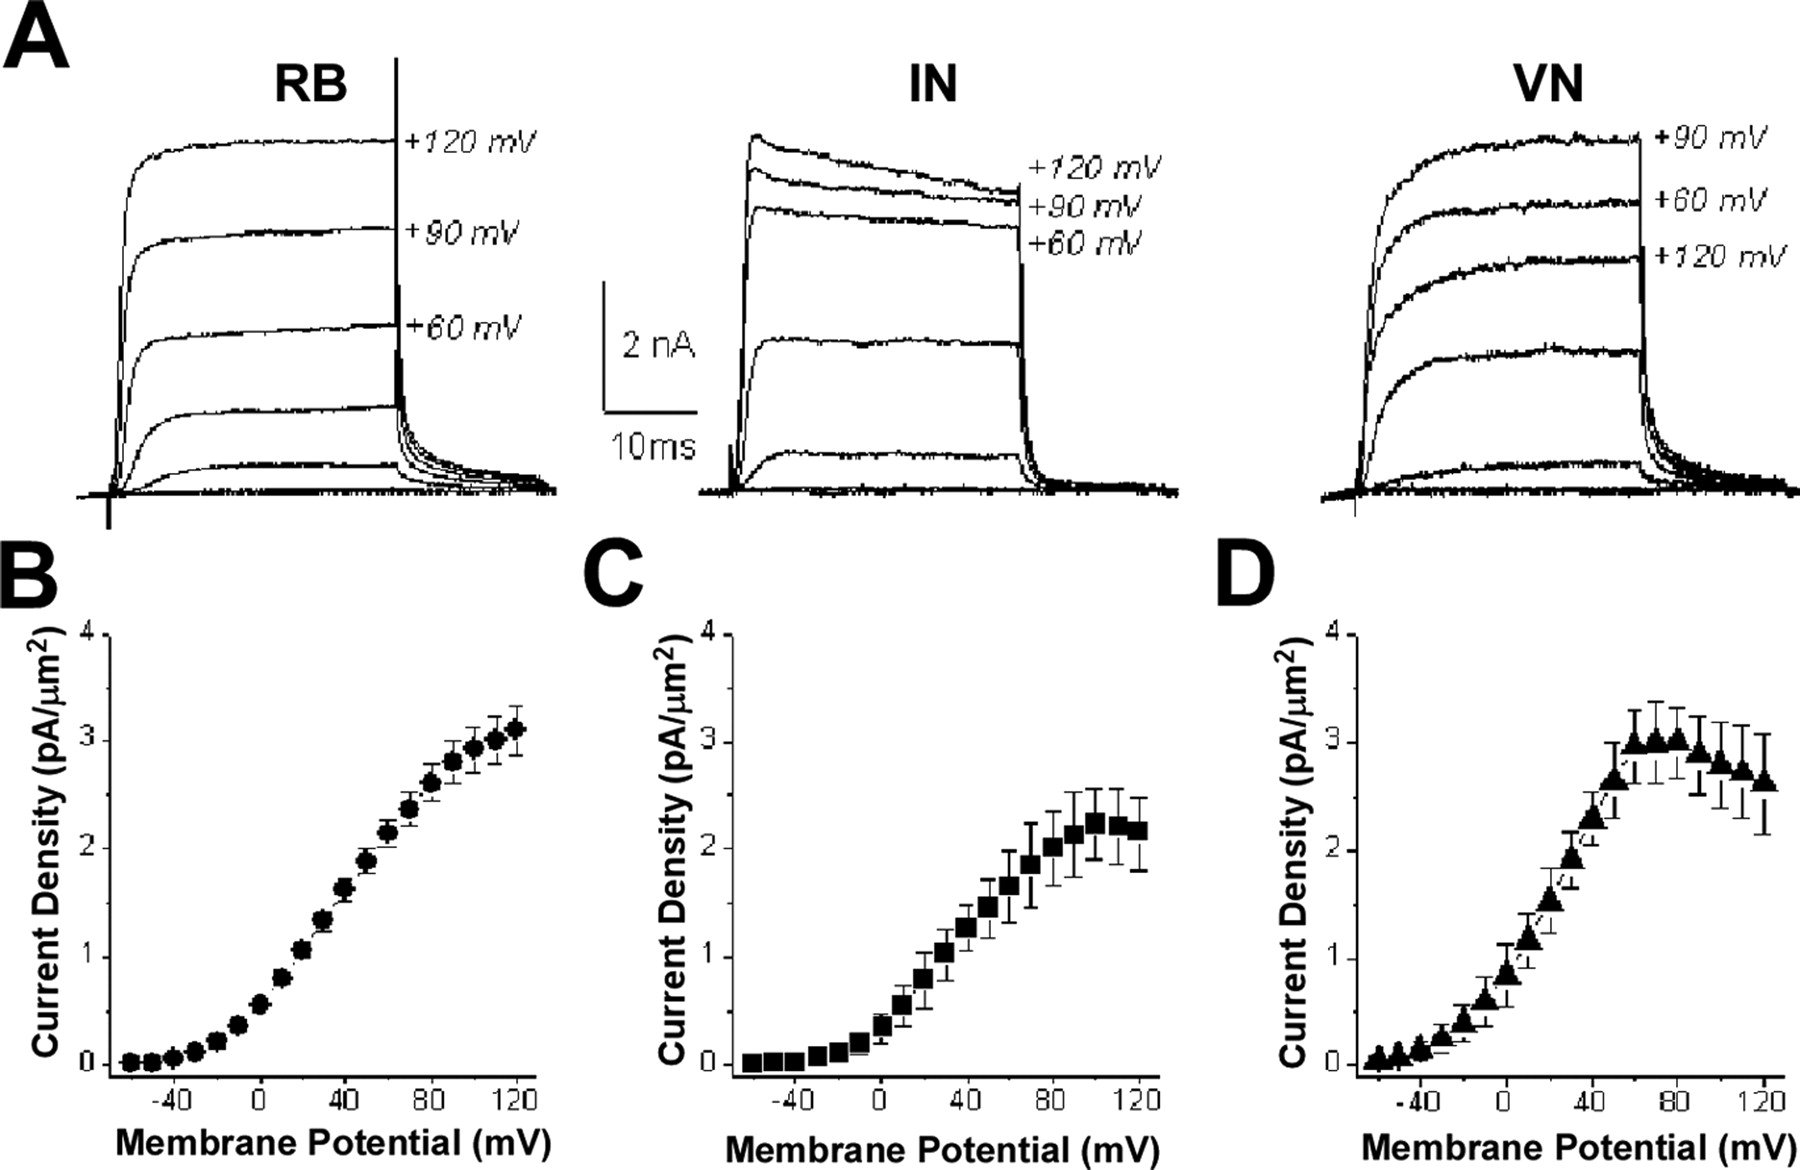
IKv recorded from RB cells, INs, and VNs in situ resemble those recorded from type I and type II neurons in culture. A, IKv values recorded from RB (left), IN (center), and VN (right) neurons in situ display different properties. B–D, Current–voltage curves for IKv values from RB cells (B; n = 6), INs (C; n = 7), and VNs (D; n = 5). On the basis of IKv properties, RB cells are type I neurons, whereas VNs are type II. INs contain a mixture of type I and II neurons, with ∼30% (2/7) being type I and the majority (5/7) type II.
RB cells, INs, and VNs display different firing properties
We next determined the firing properties of neurons in situ. In response to brief current injection, all neurons in situ fired a single action potential (Fig. 10A). VNs often displayed a subthreshold depolarization after an impulse (Fig. 10A, right, arrow). In response to sustained, current injection, RB cells fired one action potential at most, whereas VNs fired at the highest frequencies (Fig. 10B,C). INs fired at rates intermediate to those of RB cells and VNs. Thus, both in vivo and in vitro type II comprises neurons with higher firing frequencies and greater excitability.

RB cells, INs and VNs neurons have different firing properties. A, In response to brief stimulation (2.5 ms), RB cells (left), INs (middle), and VNs (right) fire single action potentials, as do type I and II neurons in culture (Fig. 5). Furthermore, after an action potential, VNs show a delayed depolarization (arrow), as do type II neurons in culture (Fig. 5). It is not known whether the delayed depolarization recorded in vivo from VNs was caused by synaptic input, as was the case for type II neurons in vitro (Fig. 5). B, In response to sustained current injections (150 ms), RB cells, INs, and VNs display different firing patterns. RB cells (left) fire a single action potential, as do type I neurons in culture (Fig. 5). In contrast, INs (middle) and VNs (right) fire repetitively, as do type II neurons in culture (Fig. 5). C, The frequency of action potential firing for different sustained levels of current injection differed for RB cells (circles; n = 4), INs (squares; n = 4), and VNs (triangles; n = 3). For current intensities >0.1 nA, RB cells and VNs had significantly different firing rates (*p < 0. 01; except for 1.0 nA, **p < 0.05). At 1.3 nA, VNs and INs also had significantly different firing rates (***p < 0.05).
Discussion
Both in vivo and in vitro, IKv properties identify two distinct types of Xenopus spinal neurons with different firing properties. In response to sustained depolarization, type I neurons fire a single or few action potentials, whereas type II neurons fire repetitively. In vivo, type I and II neurons have opposite locations along the dorsal–ventral axis. Type I neurons predominate dorsally and consist of all RB cells and a minority of INs. Type II neurons locate to ventral regions and comprise the majority of INs and all VNs.
Primary spinal neurons form an early functional network underlying simple behaviors of the developing Xenopus embryo (Harris and Hartenstein, 1991). Our results suggest that the neurons (type I: RB cells and interneurons) that detect and process sensory information are less excitable than neurons that provide motor output (type II: intermediate and ventral neurons). This fundamental difference in excitability of primary neurons along the dorsal–ventral axis may serve a gating function, with dorsal spinal cord filtering signals and ventral neurons responding faithfully to dorsally processed information. As secondary spinal neurons are added to the circuits, further refinements of network function may occur (McLean et al., 2007).
Because KCNQ channels expressed heterologously produce I–V relationships similar to those observed for IKv of type II neurons, the available evidence points to KCNQ-type channels as candidates for the molecular determinants of IKv of type II neurons. The KCNQ-like channels might be expected to predominate in ventral spinal cord, the domain of type II neurons. Furthermore, the unusual pharmacology of IKv of both type I and II neurons to XE991 and linopirdine raises the possibility of novel KCNQ isotypes in Xenopus spinal neurons. At present, only a single KCNQ channel gene (KCNQ1) has been cloned in Xenopus laevis, but its expression pattern within the cord has not yet been determined (Sanguinetti et al., 1996).
Kv genes expressed in the embryonic Xenopus spinal cord include Kv1.1, Kv1.2, Kv1.4, Kv1.10, Kv2.2, Kv3.1, Kvβ4, and Kvβ2 (Ribera and Nguyen, 1993; Burger and Ribera, 1996; Lazaroff et al., 1999; Gurantz et al., 2000; Fry et al., 2001). Interestingly, the expression patterns of the majority of these genes show regional differences along the dorsal–ventral axis. Kv1.1 and Kvβ2 transcripts localize to dorsal regions where RB type I neurons abound (Ribera and Nguyen, 1993). Kv2.2 mRNA predominates in ventral regions, the location of VN type II neurons (Burger and Ribera, 1996). Kv3.1 transcripts appear in a more intermediate region that resembles the expression domain of glutamic acid decarboxylase mRNA, a marker for GABAergic interneurons (Gurantz et al., 2000; Watt et al., 2000). Kvβ4 is detected diffusely, mostly in intermediate regions. Expression of Kv1.1, Kv2.2, and Kv3.1 genes has also been examined for neurons in vitro and found to temporally parallel the patterns observed in vivo (Gurantz et al., 1996, 2000). These results indicate that the mechanisms that direct expression of potassium currents of type I and II neurons occur either by the time of neural plate formation (St 15, the time of culture) or independently of cell–cell interactions. Consistent with this notion, type II neurons outnumber type I neurons in vitro by a factor of ∼3, corresponding with their numbers in vivo.
Because type II neurons and Kv2.2 mRNA predominate in ventral regions, it is worthwhile to consider whether Kv2.2 channels could underlie IKv of type II neurons. When expressed heterologously, Kv2.2 mRNA alone generates currents typical of type I neurons (Burger and Ribera, 1996), a result that does not support Kv2.2 as a molecular determinant of Kv current in type II neurons. Similar results have been obtained for the other Kv genes expressed in the embryonic Xenopus spinal cord (Ribera and Nguyen, 1993; Lazaroff et al., 1999; Gurantz et al., 2000; Fry et al., 2004). However, in heterologous systems, Kv2 subunits coassemble with electrically silent α-subunits [e.g., Kv2.3r, Kv5, Kv6, Kv8, Kv9, and Kv10 subunit (Post et al., 1996; Castellano et al., 1997; Patel et al., 1997; Salinas et al., 1997; Kerschensteiner and Stocker, 1999; Stocker et al., 1999; Zhu et al., 1999; Vega-Saenz de Miera, 2004; Ottschytsch et al., 2005)] and generate currents that have I–V properties similar to those of type II neurons. Electrically silent modulatory subunit genes or ESTs have not yet been identified for Xenopus. However, BMP-2 induces dorsal spinal cord and also downregulates >10-fold expression of electrically silent Kv channel genes in pulmonary smooth muscle cells (Fantozzi et al., 2006).
Changes in neuronal activity have been shown to induce homeostatic changes allowing neurons to respond appropriately (Turrigiano et al., 1994; Golowasch et al., 1999; Turrigiano, 1999; Davis and Bezprozvanny, 2001). Increased extracellular potassium levels, the challenge imposed on neurons in this study, follow periods of high activities. A different class of potassium channel, the inward rectifier, resorbs excess potassium from the extracellular space after periods of activity. In mammals, astrocytic Kir4.1 inward rectifiers are more abundant in ventral spinal cord, suggesting a greater need to maintain potassium homeostasis in this region (Olsen et al., 2007). Our data raise the possibility that the homeostatic ability of neurons may be partially specified by heterogeneous potassium channel gene expression. For the case studied here, ventral but not spinal cord neurons responded to increases in extracellular potassium concentration by increasing IKv density.
Nervous system function requires considerable plasticity in neuronal function. Moreover, individual neurons have different plastic abilities. The molecular and/or developmental mechanisms allowing neurons to display unique identity-dependent forms of plasticity are not yet known. Our studies show that a novel form of plasticity is displayed by ventral but not dorsal neurons. It is possible that the mechanisms that pattern the spinal cord along the dorsal–ventral axis also set in place regional patterns of ion channel gene expression required for specific forms of plasticity. Moreover, the mechanisms that specify neuronal identities along the dorsal–ventral axis may also encode gradients of potassium channel gene expression required for individual neurons to adapt in a cell-specific manner to environmental changes.
Footnotes
-
This work was supported by National Institutes of Health Grant NS25217. We thank Dr. Kurt Beam and members of the Ribera laboratory for helpful discussion.
- Correspondence should be addressed to Angeles B. Ribera, Department of Physiology and Biophysics, MS 8307, RC-1N, P18-7117, 12800 East 19th Avenue, P.O. Box 6511, Aurora, CO 80045. angie.ribera{at}uchsc.edu


