

Article Figures & Data
Figures
- Figure 1.
Fluorescence transient in response to a single bAP compared with a saturating response evoked by high-frequency train of bAPs. A, Fluorescence image of a mitral cell tuft loaded with bis-fura-2. B, Electrical recordings from the soma (bottom 2 traces) and optical recordings of related Ca2+ signals from a dendritic branch in the tuft. Optical signals are spatial averages of pixels indicated in A. All signals are single-trial recordings.
- Figure 2.
Action potential signals recorded optically from multiple locations on thin terminal dendritic branches of the glomerular tufts of two mitral cells. A, C, CCD images of two dendritic tufts in recording position (inverse gray scale). B, D, Recordings of AP signals from multiple locations; signals are temporal averages of nine trials and spatial averages from indicated color-coded pixels.
- Figure 3.
EPSP-related optical signals from multiple locations on dendritic branches of a glomerular tuft were similar in amplitude. A, Fluorescence image of a mitral cell tuft obtained with a fast, low-resolution (80 × 80 pixels) CCD camera used for voltage imaging. Red, blue, and green pixels show nine areas of interest. B, EPSP signals in response to near-threshold synaptic stimulation recorded optically from nine locations indicated in A. The green trace with no signal is recorded from a region that did not receive light from the tuft, indicating low level of light scattering. EPSP signals were calibrated in terms of millivolts using AP signals as calibration standard. C, The spatial average of EPSP signals from red and blue pixels on two sides of the tuft. The shape and the size (calibrated in millivolts) of two signals are almost identical.
- Figure 4.
Spatial distribution of near-threshold EPSP signals and associated Ca2+ transients derived from combined Vm and Ca2+ measurements from thin terminal dendritic branches of the glomerular tuft of a mitral cell. A, The fluorescent image of the glomerular tuft in recording position. B, EPSP-related Vm signals from multiple locations as indicated in the bottom frame in A. C, EPSP-driven Ca2+ signals from the same locations (superimposed black trace are normalized to AP-related calcium signals). D, AP-driven Ca2+ signals from the same locations. E, Trace display of the Vm signal. F, The EPSP signal shown as a temporal sequence of color-coded spatial maps determined at four time points indicated by arrows in E. The peak of the Vm signal was reached uniformly throughout the tuft within 4 ms. G, Trace display of the Ca2+ signal. H, The spatial characteristics of the Ca2+ response shown as a temporal sequence of color-coded spatial maps determined at four time points indicated by arrows in G.
- Figure 5.
Spatial distribution of small subthreshold EPSP signals is uniform in thin terminal dendritic branches of the tuft. A, Fluorescence image of a mitral cell tuft obtained with a conventional high-resolution CCD camera. B, Fluorescence image of the same tuft in recording position obtained with a fast, low-resolution (80 × 80 pixels) CCD camera used for voltage imaging. Six color-coded recording locations correspond to traces in C. C, Trace display of Vm signals. Bottom black traces, Electrical recordings from soma. Left traces, Single-trial recordings of the small EPSP signal are at the limit of amplitude resolution. Middle traces, Nine averages of the EPSP signals shown on the left improved the signal-to-noise ratio. Right traces, Nine averages of the EPSP four times larger in amplitude.
- Figure 6.
Simultaneous optical and electrical recordings of the near-threshold EPSP signal and an evoked spike in a mitral cell. A, A composite fluorescence image of a mitral cell. Optical signals are spatial average of pixels marked in red. The white rectangle indicates partial readout area of 12 × 80 pixels sampled at 10 kHz frame rate. B, Optical signal of a subthreshold EPSP (bottom red trace) and a spike evoked by two sequential weak stimuli (top red trace) applied to the olfactory nerve. Optical signals acquired at a frame rate of 10 kHz. Corresponding signals recorded electrically from the soma are shown below (black traces). Note the delay between bAP signals recorded in the soma and in the dendritic tuft, indicating soma–axon initiation site.
- Figure 7.
Attenuation of the EPSP along the primary dendrite. A, Relative EPSP peak amplitude in the primary dendrite as a function of distance from the center of the tuft for control and QX314-treated cells. The prediction from the passive model is included on the same graph. B, Comparison of EPSP attenuation between control and QX314 measurements at 22–24°C and at 33–36°C. Differences are not significant (t test; for control vs QX314 at 22–24°C, p > 0.7; for control vs QX314 at 33–36°C, p > 0.1; for control 22–24°C vs 33–36°C, p > 0.4; for QX314 22–24°C vs 33–36°C, p > 0.8).
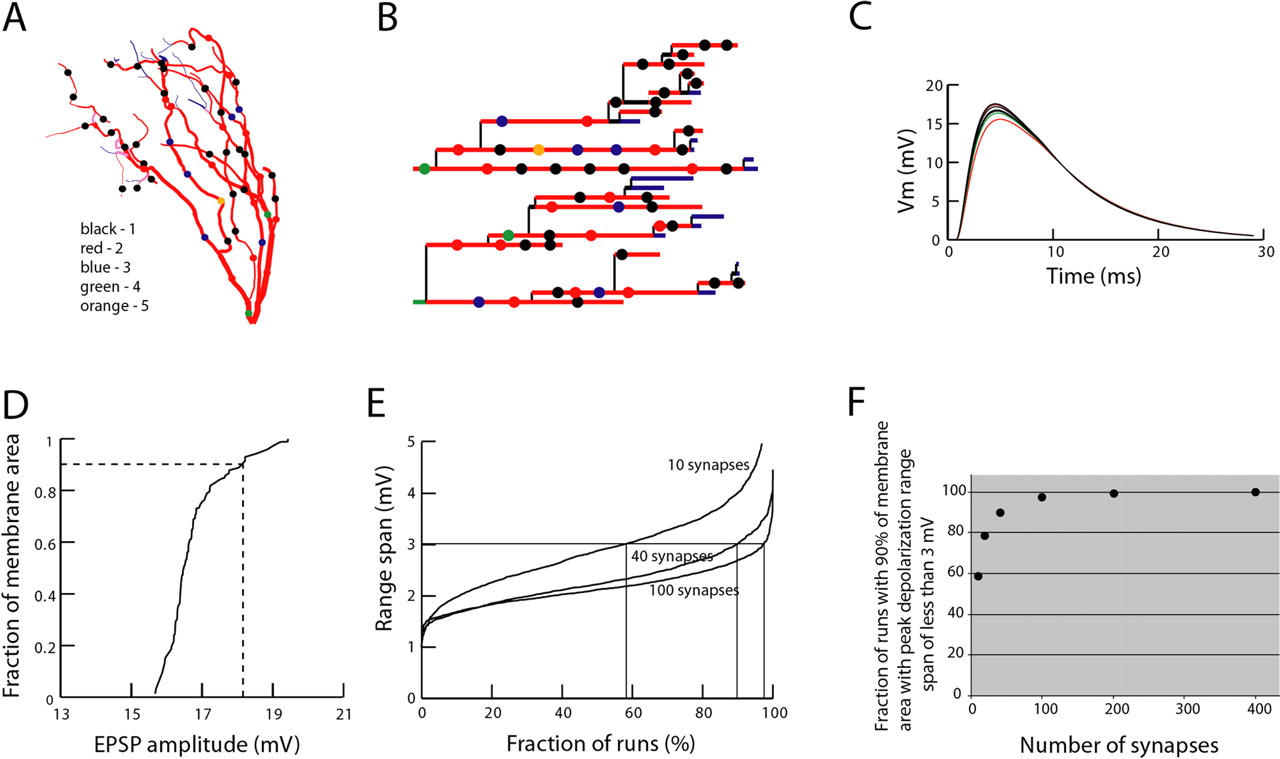
- Figure 8.
Modeling of the spatial distribution of EPSP amplitudes in mitral cell glomerular tuft. A, Anatomical reconstruction of a dendritic tuft with random distribution of synapses. B, Location of randomly distributed synapses on the dendrogram of a mitral cell tuft obtained in one simulation run. C, Time course of an EPSP from multiple locations. D, Cumulative membrane area versus EPSP amplitude plot for one simulation run. E, Fraction of runs with 90% of membrane area within a given peak depolarization range span versus peak depolarization range span. F, The percentage of random synaptic distribution patterns with uniform EPSP amplitude distribution versus the number of activated synapses.


Additional Files
Supplemental Data
Files in this Data Supplement:
- supplemental material - Supplemental Figure 1
- supplemental material - Supplemental Figure 2
- supplemental material - Supplemental Table


